Canada’s economy: national, provincial and metropolitan
Output, jobs, prices, interest rates, population, housing, industry and trade for Canada, its ten provinces and three territories and its metropolitan areas, pulled by script from Statistics Canada and the Bank of Canada. Provincial and metropolitan series use the same published tables as the national ones, so like-for-like comparisons are possible and mismatched ones are blocked.
What are the main things to understand about Canada's economy right now?
Growth is slow and uneven, inflation has risen alongside higher energy prices, and unemployment is lower than a year ago while participation has also fallen
Graphic: Growth, jobs, prices, rates, homes and trade
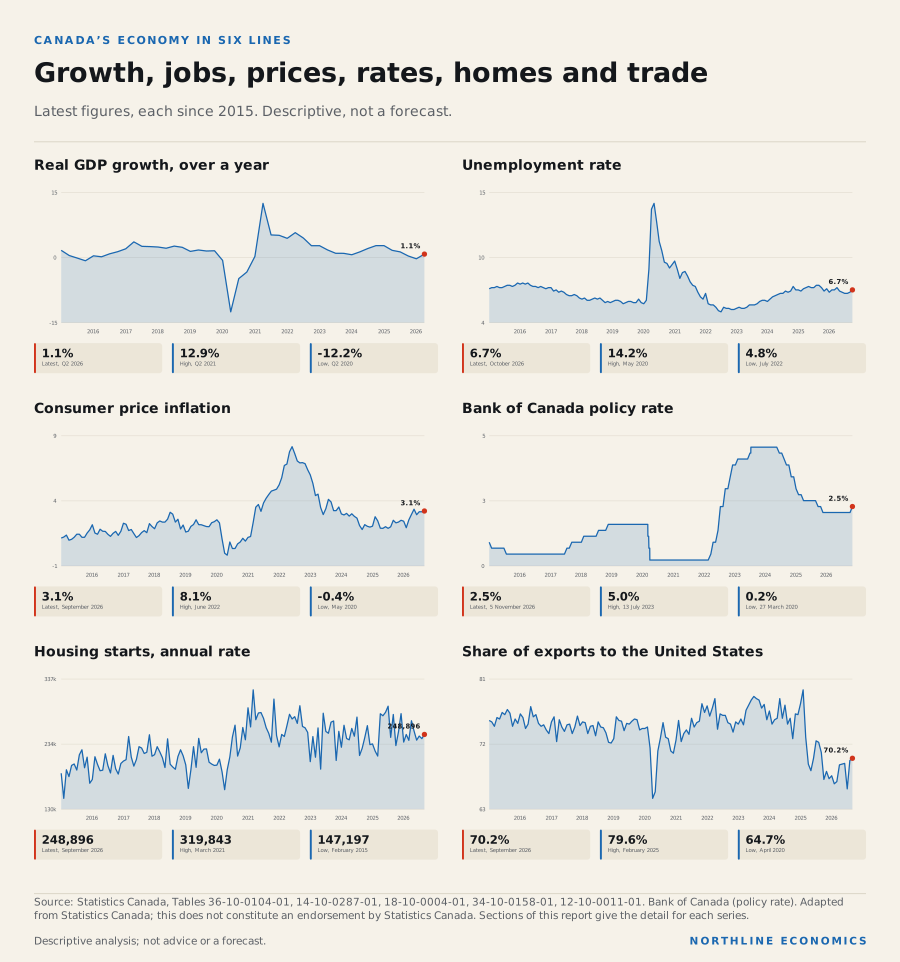
The picture in one page
Canada's economy is growing, slowly and unevenly. Real GDP was 1.1% higher in Q2 2026 than a year earlier, with a quarter-on-quarter gain of 0.8% in that quarter, and real GDP per person was 0.6% higher; the population grew 0.5% over the four quarters to 1 July 2026, a quarter later. Over a longer span output per person has barely moved: real GDP per person is 1.5% above its end-2019 level. The labour market tells a similar story. Unemployment is 6.7%, but employment grew only 0.1% over the year and the participation rate is 64.8%, so the unemployment rate says little about hiring on its own; the labour section sets out how the two moved over the year.
The institutions that watch prices point to energy. Consumer prices were up 3.1% in the year to September 2026 while the Bank of Canada's CPI-trim core measure was 1.8%, and both the Bank and Statistics Canada tie the acceleration to gasoline and to the conflict in the Middle East. The Bank raised its policy rate to 2.50% on 28 October and says inflation is higher and more persistent than it projected in July. That is the institutions' reading, not a measured effect of oil on Canadian inflation.
Evidence: relationship: Middle East conflict and disrupted energy shipping (2026) and World oil price (WTI); relationship: World oil price (WTI) and Consumer energy and gasoline prices; relationship: Consumer energy and gasoline prices and Consumer price inflation; Bank of Canada: Bank of Canada raises the policy rate by 25 basis points to 2½% (28 October 2026); Bank of Canada: Bank of Canada maintains the policy rate (2 September 2026); Statistics Canada: The Daily: Consumer Price Index, September 2026
Borrowing costs depend on more than the policy rate. The ten-year government yield was 3.67% on 5 November 2026 and the posted five-year mortgage rate 6.19% on 28 October 2026, and the Bank describes how rate changes reach households through loan repricing and then through borrowing and the rate-sensitive sectors, housing first. Housing starts were 248,896 at an annual rate in September 2026, and household debt was 176.4% of disposable income in Q2 2026.
Evidence: relationship: Bank of Canada policy rate and Prime and posted mortgage rates; relationship: Bank of Canada policy rate and Household mortgage debt-servicing costs; relationship: Household mortgage debt-servicing costs and Housing demand; Bank of Canada: Tiff Macklem, Governor: Monetary policy at work, remarks to CFA Québec (7 February 2023); Bank of Canada: Bounajm and McWhirter, Modelling Canadian mortgage debt and payments in a semi-structural model (Staff Analytical Note 2024-1)
Provinces and cities are far from interchangeable. The unemployment rate is 7.3% in Alberta, 7.3% in Ontario, 5.7% in Quebec and 6.3% in British Columbia; among the six metropolitan areas it is 6.6% in Calgary, 7.1% in Edmonton, 7.1% in Toronto and 6.7% in Vancouver (three-month averages, a different smoothing from the provincial series). In the fiscal year that began in April 2024, the provincial government's net operating balance was 8.5% of revenue in Alberta and -8.2% in Ontario, on Statistics Canada's preliminary figures. The provinces' own audited accounts, which differ in coverage and accounting rules, tell a different story for Ontario: a deficit of 1.1 billion dollars in 2024-25, then 13.0 billion in 2025-26; Alberta's show surpluses of 8.3 billion and 2.2 billion dollars in the same two years. Each province has a data profile, each city a report or profile, and the exposure profile shows where industry structure could make a global driver matter.
Evidence: Statistics Canada: Consolidated Canadian Government Finance Statistics, 2024 (The Daily, note to readers); Government of Ontario: Public Accounts 2025-26: Annual report; Government of Alberta (Treasury Board and Finance): 2025-26 Final Results: Year-End Report
The world reaches Canada through a small number of channels that the relationship explorer documents with their evidence: the United States took 70.2% of goods exports in September 2026 (balance-of-payments basis), energy products were 26.3% of all goods exports, Brent crude averaged US$125.00 a barrel in October 2026 and the US ten-year yield was 4.84% on 5 November 2026. Whether any of these moves Canadian jobs, prices or house prices is a matter of evidence the report grades one link at a time; none of this section is a forecast.
Six tensions
The report is organised as a sequence of sections, but the economy is not. Six tensions cut across the sections. Each is a pair of facts that look inconsistent until the relation between them is understood.
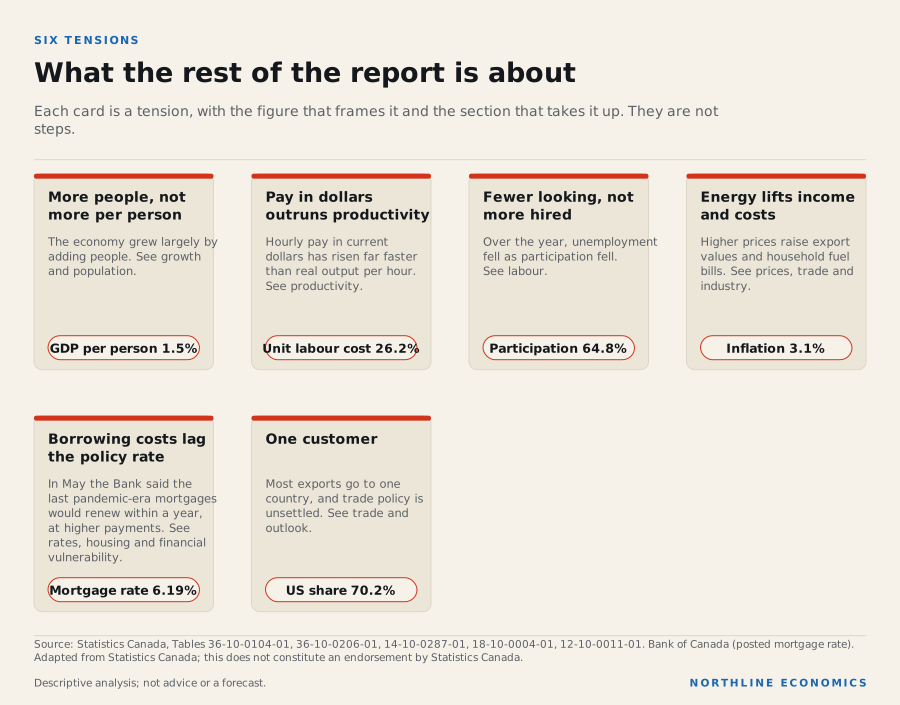
The data behind this graphic
| Step | What happens |
|---|---|
| More people, not more per person | The economy grew largely by adding people. See growth and population. |
| Pay in dollars outruns productivity | Hourly pay in current dollars has risen far faster than real output per hour. See productivity. |
| Fewer looking, not more hired | Over the year, unemployment fell as participation fell. See labour. |
| Energy lifts income and costs | Higher prices raise export values and household fuel bills. See prices, trade and industry. |
| Borrowing costs lag the policy rate | In May the Bank said the last pandemic-era mortgages would renew within a year, at higher payments. See rates, housing and financial vulnerability. |
| One customer | Most exports go to one country, and trade policy is unsettled. See trade and outlook. |
More people, not more per person. Real GDP is 11.9% higher in Q2 2026 than at the end of 2019. Real GDP per person is 1.5% higher. The difference is population growth: by 1 July 2026, a quarter after the latest GDP figures, the population was 10.5% larger than on 1 October 2019. The growth section sets out the components of output; the population section explains where the new residents came from and why growth has now slowed to 0.5% a year.
Pay in dollars outruns productivity. Hourly compensation in current dollars is up 29.2% from the end of 2019 to Q2 2026, consumer prices 24.6% (to September 2026) and real output per hour 2.4%. The productivity section shows that output per hour has grown slowly for a generation and that Canada’s level of output per worker is 72% of the American. The investment section shows that business investment is no higher than in 2014.
Fewer looking, not more hired. Unemployment is 6.7%, close to the ten-year average, but participation is 64.8%, against 67.7% in November 2007, and employment is up only 0.1% over the year. The labour section separates the two.
Energy lifts income and costs. The same price that lifts the value of energy exports lifts gasoline prices. Energy products were 26.3% of goods exports in September 2026 and 76% of Alberta’s in 2025, and the Bank of Canada and Statistics Canada tie the rise in inflation, now 3.1%, mainly to gasoline. The prices, trade and industry sections cover the two sides, and the regions section compares the provinces.
Evidence: Bank of Canada: Monetary Policy Report, October 2026: Current conditions; Statistics Canada: The Daily: Consumer Price Index, September 2026
Borrowing costs lag the policy rate. The Bank held its policy rate at 2.25% for a year before raising it to 2.50% on 28 October, but the posted five-year mortgage rate was 6.19% on 28 October 2026, and in May the Bank said the last of the five-year fixed-payment mortgages taken out during the pandemic would renew over the following 12 months. The rates, housing, household-finance and financial-vulnerability sections follow the chain from the rate to the household budget.
Evidence: Bank of Canada: Financial Stability Report 2026: Households (22 May 2026)
One customer. The United States takes 70.2% of goods exports, and at the joint review on 1 July 2026 it did not agree to renew the Canada-United States-Mexico Agreement, which remains in force until 2036 and can be renewed at any time. The trade and outlook sections, and the research notes on Canada–United States trade, set out the shares and the options.
Evidence: Office of the United States Trade Representative: Ambassador Greer Issues Statement on the USMCA Joint Review; Global Affairs Canada: Statement by Minister LeBlanc following trilateral CUSMA joint review meeting
How to use this report
Each section carries the same eight core headings, so that a reader can compare. A reader with a specific decision can start where it fits:
- Setting a budget or a price: prices, rates, labour and consumers.
- Deciding where to expand: regions, population, housing and industry.
- Lending or investing: credit and banks, financial vulnerability, investment and government.
- Selling abroad: trade, transportation, agriculture and the outlook.
- Judging the long run: productivity, long-run and technology.
Every figure in the text is drawn from a named source when the page is built. Where a source says something that the data cannot test, it is quoted as the source’s statement, and where the report has no evidence it says so. The report makes no forecast of its own.
Key findings at a glance
- The economy grew 0.8% in Q2 2026, 1.1% over the year, but output per person is little changed since 2019. Real GDP is 11.9% higher than at the end of 2019 and real GDP per person only 1.5%. In arithmetic terms, population growth accounts for most of the rise in the economy's size. Growth
- Business-sector productivity is up 2.4% from the end of 2019 to Q2 2026 while hourly pay in current dollars is up 29.2%. Unit labour costs, which combine the two, are up 26.2%, and consumer prices 24.6% (to September 2026). Productivity
- Unemployment is 6.7%, but employment grew only 0.1% over the year and the participation rate is 64.8%. Over the year the unemployment rate fell while the participation rate also fell and employment growth was weak, which is consistent with fewer people looking for work rather than faster hiring; the reasons are not in these series. Labour
- Inflation is 3.1%; Statistics Canada says gasoline and fuel oil drove the September acceleration, and the Bank of Canada says the Middle East conflict is keeping energy prices high. The CPI-trim core measure is 1.8%. Since January 2021 the real average hourly wage, which is not seasonally adjusted, has changed by -0.5%: pay has roughly kept pace with prices. Prices
- The policy rate is 2.50% after the rise of 28 October, and the ten-year yield rose 0.52 percentage points over the past year. Longer-term borrowing costs depend on longer-term yields as well as on the policy rate. Rates
- Housing starts, at 248,896 in September 2026, are near their decade average, new-home prices changed -2.0% over the year, and CMHC estimates a national supply gap of 187,000 to 238,000 homes a year. CMHC's estimates of the gap differ by city. Housing
- Population grew only 0.5% in the year to 1 July 2026 as non-permanent residents fell by 155 thousand. Over the same four quarters Alberta's population grew 1.5%, Ontario's 0.3%, Quebec's 0.2% and British Columbia's 0.1%. Population
- The United States takes 70.2% of goods exports and energy products are 26.3% of all goods exports (balance-of-payments basis, September 2026). The exposure differs by province: on a customs basis in calendar 2025, energy products were 76% of Alberta's exports but 1% of Ontario's. Trade
Since 22 August 2026 the United States has applied additional tariffs of 50% under Section 338 of its Tariff Act to certain Canadian goods, which the US Trade Representative put at nearly US$20 billion of imports, and since 29 September it has banned some of those products from entry. Trade
Evidence: The White House (Fact Sheet): Fact Sheet: President Donald J. Trump Imposes Additional Tariffs on Canada (Section 338, 20 July 2026); Office of the United States Trade Representative: Ambassador Greer Issues Statement on President Trump Imposing Section 338 Tariffs on Canada; The White House (Presidential Actions): Temporary Suspension of Additional Duties to Offset Canadian Discrimination Against the Commerce of the United States With Respect to Alcoholic Beverages, Dairy, and Motor Vehicles (Proclamation, 18 August 2026); The White House (Fact Sheet): Fact Sheet: President Donald J. Trump Responds to Canada's Retaliation (Section 338, 8 September 2026)
On 28 October the Bank of Canada said it raised the policy rate to reduce the risk that continuing high energy prices spread broadly to the prices of other goods and services, that new US tariffs are expected to slow growth in the fourth quarter, and that there could be a need to increase the policy rate further, though it agreed to proceed carefully. This report makes no forecast. Outlook
Evidence: Bank of Canada: Bank of Canada raises the policy rate by 25 basis points to 2½% (28 October 2026)
Prepared with AI assistance.
Follow the relationships
- Canada 12 with evidence · 22 recorded Open in Studio
Upcoming releases
- 2026-11-16 Consumer Price Index October 2026 · Statistics Canada
- 2026-11-30 Gross domestic product, income and expenditure Third quarter 2026 · Statistics Canada
- 2026-12-04 Labour Force Survey November 2026 · Statistics Canada
- 2026-12-09 Bank of Canada interest rate announcement · Bank of Canada
Sources for this section (21 datasets, 17 documents)
Data
- Gross domestic product, expenditure-based, Canada, quarterly (36-10-0104-01; 4 series; latest Q2 2026; retrieved 2026-10-23)
- Population estimates, quarterly (17-10-0009-01; 5 series; latest 1 July 2026; retrieved 2026-10-23)
- Labour force characteristics, monthly, seasonally adjusted and trend-cycle (14-10-0287-01; 7 series; latest October 2026; retrieved 2026-11-07)
- Consumer Price Index, monthly, not seasonally adjusted (18-10-0004-01; 2 series; latest September 2026; retrieved 2026-10-23)
- Consumer Price Index (CPI) statistics, measures of core inflation and other related statistics - Bank of Canada definitions (18-10-0256-01; 1 series; latest September 2026; retrieved 2026-10-23)
- Bank of Canada target for the overnight rate (business daily) (V39079; 1 series; latest 5 November 2026; retrieved 2026-11-07)
- Government of Canada benchmark bond yield, 10-year (BD.CDN.10YR.DQ.YLD; 1 series; latest 5 November 2026; retrieved 2026-11-07)
- Conventional 5-year mortgage rate (posted) (V80691335; 1 series; latest 28 October 2026; retrieved 2026-11-03)
- Canada Mortgage and Housing Corporation, housing starts, all areas, Canada and provinces, seasonally adjusted at annual rates, monthly (34-10-0158-01; 1 series; latest September 2026; retrieved 2026-10-23)
- Household sector credit market summary table, seasonally adjusted estimates (38-10-0238-01; 1 series; latest Q2 2026; retrieved 2026-10-23)
- Labour force characteristics by census metropolitan area, three-month moving average, seasonally adjusted (14-10-0459-01; 4 series; latest October 2026; retrieved 2026-11-07)
- Canadian government finance statistics for the provincial and territorial governments (10-10-0017-01; 2 series; latest 2024; retrieved 2026-11-07)
- International merchandise trade for all countries and by Principal Trading Partners, monthly (12-10-0011-01; 1 series; latest September 2026; retrieved 2026-11-05)
- International merchandise trade by commodity, monthly (12-10-0163-01; 1 series; latest September 2026; retrieved 2026-11-05)
- Crude oil, Brent, monthly average price (Pink Sheet (monthly prices); 1 series; latest October 2026; retrieved 2026-11-05)
- US Treasury yield, 10-year (Federal Reserve statistical release H.15; 1 series; latest 5 November 2026; retrieved 2026-11-07)
- Indexes of business sector labour productivity, unit labour cost and related measures, seasonally adjusted (36-10-0206-01; 3 series; latest Q2 2026; retrieved 2026-10-23)
- Employee wages by industry, monthly, unadjusted for seasonality (14-10-0063-01; 1 series; latest September 2026; retrieved 2026-11-07)
- New housing price index, monthly (18-10-0205-01; 1 series; latest September 2026; retrieved 2026-10-23)
- Estimates of the components of international migration, quarterly (17-10-0040-01; 1 series; latest Q2 2026; retrieved 2026-10-23)
- GDP per person employed (constant 2021 PPP $) (all economies; World Bank) (WDI SL.GDP.PCAP.EM.KD; series; latest annual; retrieved 2026-10-23)
Documents cited
- Bank of Canada: Bank of Canada raises the policy rate by 25 basis points to 2½% (28 October 2026) (retrieved 2026-11-07)
- Bank of Canada: Bank of Canada maintains the policy rate (2 September 2026) (retrieved 2026-10-22)
- Statistics Canada: The Daily: Consumer Price Index, September 2026 (retrieved 2026-11-07)
- Bank of Canada: Tiff Macklem, Governor: Monetary policy at work, remarks to CFA Québec (7 February 2023) (retrieved 2026-11-07)
- Bank of Canada: Bounajm and McWhirter, Modelling Canadian mortgage debt and payments in a semi-structural model (Staff Analytical Note 2024-1) (retrieved 2026-11-07)
- Statistics Canada: Consolidated Canadian Government Finance Statistics, 2024 (The Daily, note to readers) (retrieved 2026-11-06)
- Government of Ontario: Public Accounts 2025-26: Annual report (retrieved 2026-10-25)
- Government of Alberta (Treasury Board and Finance): 2025-26 Final Results: Year-End Report (retrieved 2026-10-25)
- Bank of Canada: Monetary Policy Report, October 2026: Current conditions (retrieved 2026-11-07)
- Bank of Canada: Financial Stability Report 2026: Households (22 May 2026) (retrieved 2026-10-25)
- Office of the United States Trade Representative: Ambassador Greer Issues Statement on the USMCA Joint Review (retrieved 2026-11-06)
- Global Affairs Canada: Statement by Minister LeBlanc following trilateral CUSMA joint review meeting (retrieved 2026-11-06)
- The White House (Fact Sheet): Fact Sheet: President Donald J. Trump Imposes Additional Tariffs on Canada (Section 338, 20 July 2026) (retrieved 2026-11-07)
- Office of the United States Trade Representative: Ambassador Greer Issues Statement on President Trump Imposing Section 338 Tariffs on Canada (retrieved 2026-11-07)
- The White House (Presidential Actions): Temporary Suspension of Additional Duties to Offset Canadian Discrimination Against the Commerce of the United States With Respect to Alcoholic Beverages, Dairy, and Motor Vehicles (Proclamation, 18 August 2026) (retrieved 2026-11-07)
- The White House (Fact Sheet): Fact Sheet: President Donald J. Trump Responds to Canada's Retaliation (Section 338, 8 September 2026) (retrieved 2026-11-07)
- Canada Mortgage and Housing Corporation: Fall 2026 Housing Supply Report (retrieved 2026-11-07)
Each dataset is used under its licence; attribution and series-level detail are in each chart’s “About this data” panel. Limitations: Findings summarise the sections that follow and inherit their limitations. No forecast is made: the Bank of Canada's projections are quoted as theirs in the outlook section.
Is the Canadian economy growing, and is that growth making people better off?
Output rose 1.1% in the year to Q2 2026, but output per person has barely moved since 2019
Graphic: Real growth by part of the economy, over twelve months
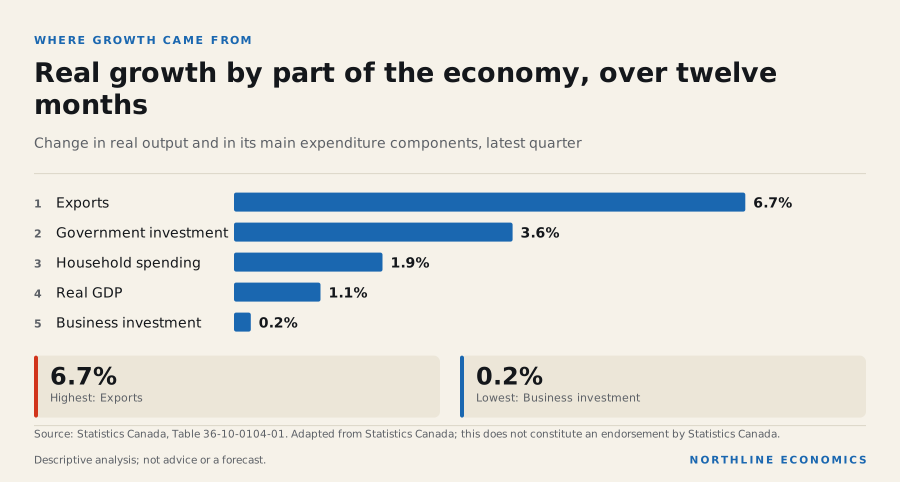
What happened
Real gross domestic product in the second quarter of 2026 was C$2.52 trillion at an annual rate (chained 2017 dollars), 0.8% higher than in the first quarter and 1.1% higher than a year earlier. The quarter followed 0.1%, -0.2%, 0.5% and -0.2% in the four quarters before it: output stalled from early 2025 to early 2026, then picked up. Over two years real GDP grew 3.2%, or 1.2% per person.
Within the quarter, exports contributed 4.7 percentage points to annualized growth, household spending 1.8 percentage points, business investment 1.7 percentage points and government spending 0.9 percentage points, while a drawdown of inventories subtracted 4.9 percentage points. These contributions are annualized, so they are about four times larger than the quarterly contributions that Statistics Canada discusses in prose.
Real GDP, change from the previous quarter
Percent, not annualized; seasonally adjusted (Statistics Canada, table 36-10-0104-01).
Chart loads when it comes into view.
Latest values: Real GDP 0.8 (2026 Q2).
What drove quarterly growth: contributions to real GDP growth
Percentage points, annualized rate. Statistics Canada does not make the contributions of inventories, imports and statistical discrepancy sum visibly to GDP in this view; imports are not shown (see the note below).
Chart loads when it comes into view.
Latest values: Household spending 1.802 (2026 Q2); Government spending 0.854 (2026 Q2); Business investment 1.652 (2026 Q2); Exports 4.738 (2026 Q2); and 2 more in the data table.
Statistics Canada reported that the second-quarter gain was led by higher exports, household spending and business capital investment, that exports rose the most since early 2023 mainly because of passenger cars and light trucks, that residential investment rose after two quarterly declines, and that a drawdown of inventories took growth off after businesses had built stock up in the first quarter.
Evidence: Statistics Canada: The Daily: Gross domestic product, income and expenditure, second quarter 2026
By industry, the monthly series ends in August 2026, when total real output was essentially unchanged (0.0% from the previous month). Compared with a year earlier, services-producing industries grew 1.7% while goods-producing industries grew 1.0%; oil and gas extraction grew 1.5% and manufacturing 1.8%.
Real output by industry, indexed
Monthly real GDP at basic prices, chained 2017 dollars; start of the period = 100. Industry shares of real GDP are not additive in chained dollars.
Chart loads when it comes into view.
Latest values: Goods-producing 600,300,000,000 (2026-08); Services-producing 1,778,000,000,000 (2026-08); Mining, quarrying, oil and gas 123,400,000,000 (2026-08); Manufacturing 202,900,000,000 (2026-08); and 5 more in the data table.
Related relationships: Forestry, fishing, mining, quarrying, oil and gas · Manufacturing · Construction · Finance, insurance, real estate, rental and leasing
Why it happened
The data show which components moved, not why they moved. For the second quarter, the official explanations are the ones quoted above.
The swing in inventories, which added 4.2 percentage points to annualized growth in the first quarter and then subtracted 4.9 percentage points in the second, suggests that part of the second-quarter pattern reflects timing: stock built up and then drawn down. Inventory movements of this kind reflect timing, so the quarter's 0.8% is a weaker guide to underlying growth than the year-over-year figure of 1.1%. This is a reading of the contribution data, not an estimate of underlying growth.
Evidence: Statistics Canada: The Daily: Gross domestic product, income and expenditure, second quarter 2026
Statistics Canada's trade release for August notes that tariff announcements can prompt importers to bring shipments forward, and records that the United States announced new tariffs on a range of Canadian products in July that took effect at the end of August. Whether such timing effects shaped August exports is not measured in this report, and the link remains a hypothesis.
Evidence: Statistics Canada: The Daily: Canadian international merchandise trade, August 2026
Why it matters
Aggregate output and living standards are different things. Real GDP is up 11.9% since the fourth quarter of 2019, but the population grew over the same period, so real GDP per person is up only 1.5%. Its peak over the past fifteen years was C$61,027 per person in Q3 2022, and the latest quarter is 0.9% below that peak.
Real GDP per person
Chained 2017 dollars per person: real GDP (annual rate) divided by the population on the first day of the quarter.
Chart loads when it comes into view.
Latest values: Real GDP per person 60,500 (2026 Q2).
In arithmetic terms, most of the growth in the size of the economy since 2019 is accounted for by having more people, not by each person producing more. The same population surge that raised total output also raised the number of households needing housing and services, which is why total GDP is a weak guide to whether an average household is better off. Statistics Canada reports that population growth has since slowed sharply, which would reduce this source of growth.
Evidence: Statistics Canada: The Daily: Canada's population estimates, second quarter 2026
Nominal GDP, which is measured in current dollars, grew 7.1% over the year, against 1.1% for real GDP. The gap reflects the change in economy-wide prices (the GDP deflator), and it matters because nominal income, government revenue and debt ratios respond to nominal GDP while living standards respond to real quantities.
Nominal and real GDP growth
Percent change from a year earlier. The gap between the lines is the economy-wide price change (the implicit price deflator is not published separately here).
Chart loads when it comes into view.
Latest values: Nominal GDP 7.05 (2026 Q2); Real GDP 1.13 (2026 Q2).
Output, people and output per person
Three series tell the long-run story together: how big the economy is, how many people live in it, and the quotient. In 1990 real GDP was C$1.17 trillion a year for 27.5 million people. In the second quarter of 2026 it was C$2.52 trillion for 41.7 million.
| Quarter | Real GDP | Population | Real GDP per person |
|---|---|---|---|
| 1990 Q1 | C$1.17 trillion | 27.5 million | C$42,600 per person |
| 2000 Q1 | C$1.51 trillion | 30.5 million | C$49,619 per person |
| 2010 Q1 | C$1.83 trillion | 33.8 million | C$54,141 per person |
| 2014 Q1 | C$2.02 trillion | 35.2 million | C$57,193 per person |
| 2019 Q4 | C$2.26 trillion | 37.8 million | C$59,621 per person |
| 2026 Q2 | C$2.52 trillion | 41.7 million | C$60,504 per person |
Chained 2017 dollars. Real GDP and real GDP per person are annual rates.
Since 2000, real GDP is up 66.6%, population 36.9% (to 1 July 2026) and real GDP per person 21.9%. Between 2014 and the end of 2019 per-person output rose from C$57,193 per person to C$59,621 per person. In the six and a half years since it has risen to C$60,504 per person, which is a smaller gain in a longer time.
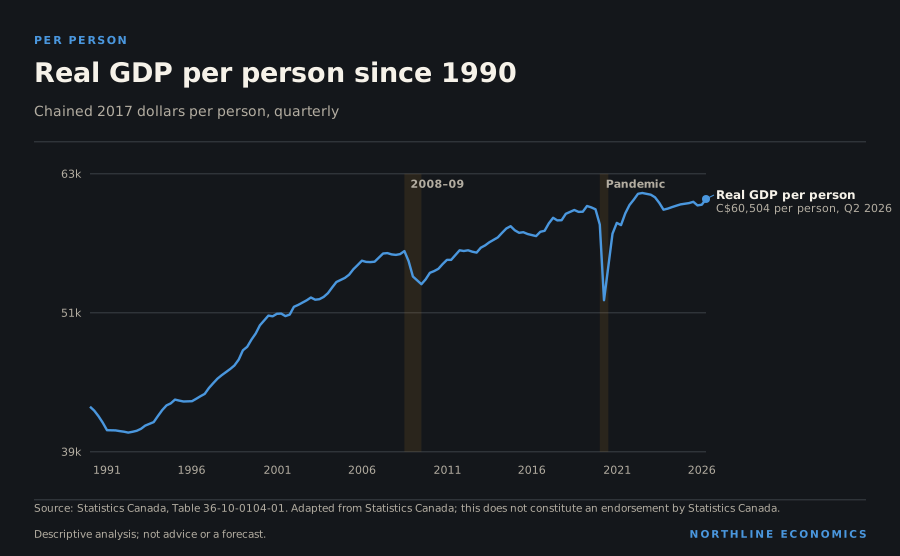
The data behind this graphic
| Series | Latest |
|---|---|
| Real GDP per person | C$60,504 per person, Q2 2026 |
The shape matters as much as the level. Per-person output fell in the early 1990s, then rose until 2008, dipped in 2008–09, grew slowly through the 2010s, fell sharply in the pandemic, recovered by late 2021 and has since been roughly flat. It reached C$61,027 per person in Q3 2022 and is below that now.
How that compares
Other economies have also faced slow growth in the 2020s, but over a decade Canada’s per-person growth stands out as low. At purchasing-power parity, GDP per person rose 4.2% in Canada over ten years, against 19.5% in the United States, 24.2% in South Korea and 12.7% in the euro area. Among the economies shown, only Mexico (2.3%) grew less. Germany (5.3%), which is above Canada in level, grew only slightly more.
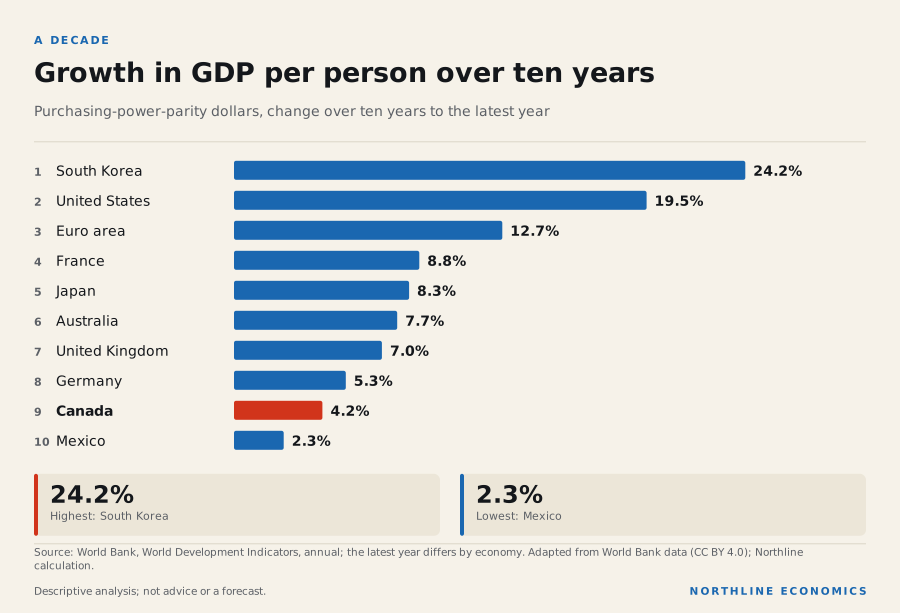
The data behind this graphic
| Item | Value |
|---|---|
| South Korea | 24.2% |
| United States | 19.5% |
| Euro area | 12.7% |
| France | 8.8% |
| Japan | 8.3% |
| Australia | 7.7% |
| United Kingdom | 7.0% |
| Germany | 5.3% |
| Canada | 4.2% |
| Mexico | 2.3% |
In the latest year, Canada’s real GDP grew 1.7% in 2025, a little above the euro area (1.4%) and the United Kingdom (1.4%), below the United States (2.2%) and well below the world (2.9%). A single year is a weak guide: Canada’s growth was 0.6% in 2015 and is higher now, while the United States’ has fallen from 2.9% to 2.2%. The ten-year comparison is the more informative one.
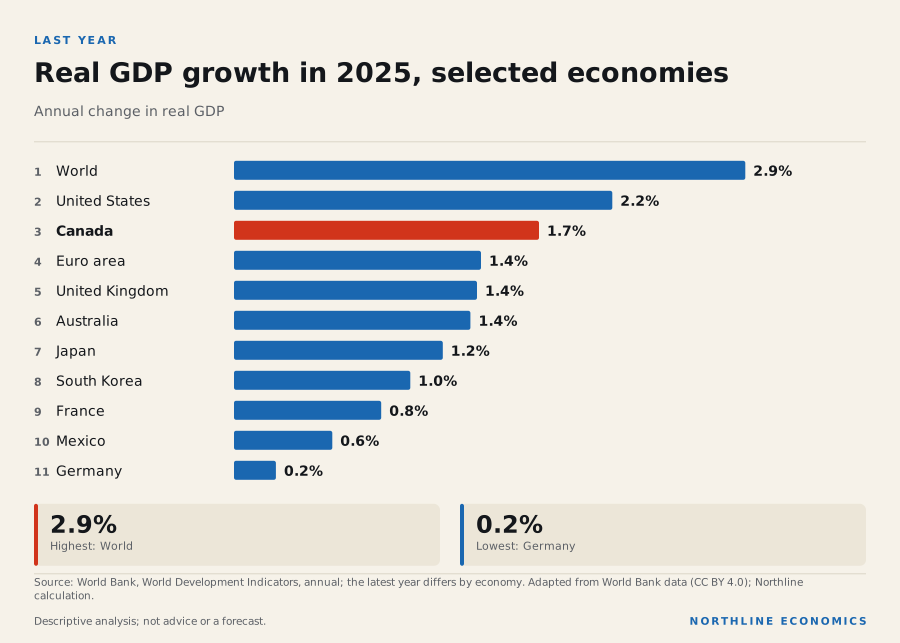
The data behind this graphic
| Item | Value |
|---|---|
| World | 2.9% |
| United States | 2.2% |
| Canada | 1.7% |
| Euro area | 1.4% |
| United Kingdom | 1.4% |
| Australia | 1.4% |
| Japan | 1.2% |
| South Korea | 1.0% |
| France | 0.8% |
| Mexico | 0.6% |
| Germany | 0.2% |
History
The 2008–09 downturn took real GDP down 4.4% from its peak in Q3 2008. The pandemic quarter was far sharper: real GDP fell 12.7% from the fourth quarter of 2019 to the second quarter of 2020. Per-person output has had two further declines that are easy to miss in the total: a fall of 1.5% between Q4 2014 and Q2 2016, and of 2.4% between Q3 2022 and Q4 2023. These are measurements of the series, not statements about their causes. This report does not use an official dating of recessions, so it makes no claim about whether any period was a recession.
Across geographies
Provincial real GDP (at market prices, in 2017 constant prices) is published annually and ends in 2025. In that year Alberta's grew 3.3%, Ontario's 1.8%, Quebec's 1.1% and British Columbia's 2.2%. Over the ten years to then, real output rose 34.8% in British Columbia and 25.3% in Ontario but only 17.0% in Alberta and 8.1% in Newfoundland and Labrador. Alberta's ten-year figure includes the fall in 2020; its real output has risen 22.5% since then, and 13.0% since 2019.
The two provinces with the highest share of energy products in their domestic merchandise exports (76% in Alberta and 54% in Newfoundland and Labrador in 2025) are both among the four smallest ten-year gains, but Manitoba and Saskatchewan, with lower energy shares, grew less than Alberta. That is a co-occurrence, not a rule: output in resource-heavy economies also depends on production volumes, investment cycles and public-sector activity, none of which is decomposed here.
Evidence: relationship: World oil price (WTI) and Alberta; relationship: World oil price (WTI) and Newfoundland and Labrador
Real GDP by province, indexed
Annual, 2017 constant prices (not chained); start of the period = 100. Expenditure-based.
Chart loads when it comes into view.
Latest values: Alberta 382,600,000,000 (2025); British Columbia 356,100,000,000 (2025); Saskatchewan 90,590,000,000 (2025); Manitoba 79,430,000,000 (2025); and 6 more in the data table.
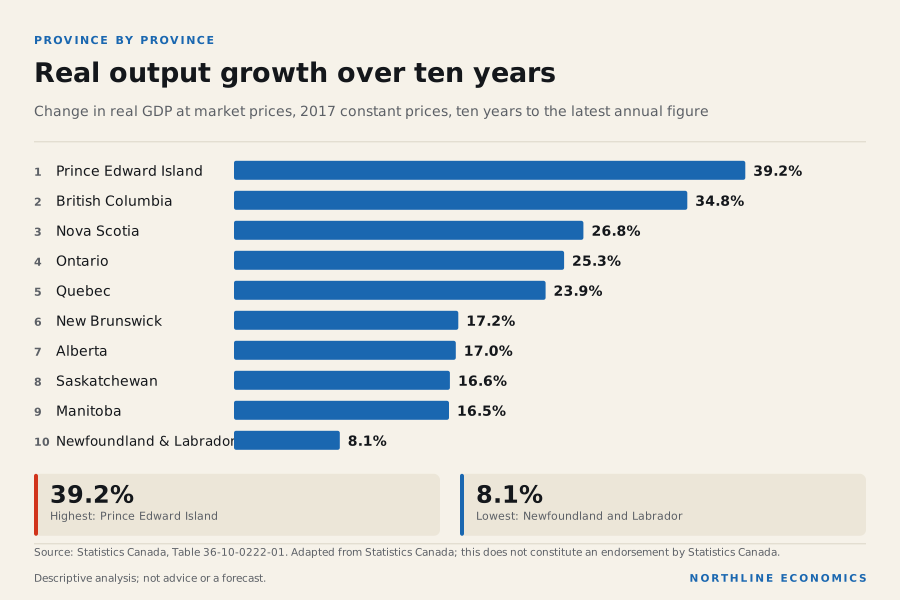
The data behind this graphic
| Item | Value |
|---|---|
| Prince Edward Island | 39.2% |
| British Columbia | 34.8% |
| Nova Scotia | 26.8% |
| Ontario | 25.3% |
| Quebec | 23.9% |
| New Brunswick | 17.2% |
| Alberta | 17.0% |
| Saskatchewan | 16.6% |
| Manitoba | 16.5% |
| Newfoundland and Labrador | 8.1% |
The chart shows the ten-year ranking in full. Prince Edward Island (39.2%) and British Columbia (34.8%) grew most. Newfoundland and Labrador (8.1%) grew least, then Manitoba (16.5%), Saskatchewan (16.6%) and Alberta (17.0%). The regions section looks at provincial output, jobs and population together.
Statistics Canada publishes GDP for metropolitan areas only in current dollars and several years late (to 2022), on a different basis from these constant-price provincial figures, so none is shown here and nothing here should be read as a city GDP. The city reports show the metropolitan series with those limits stated.
The Global report puts these numbers in context. Canada's real GDP growth in 2025, 1.7%, compares with 2.9% for the world, 2.2% for the United States and 1.4% for the euro area. Among thirteen major economies Canada ranks 5th of 13 on that measure and 4th of 13 on GDP per person at purchasing-power parity, 75% of the US level.
What it influences
Household spending, business investment and exports are components of demand that the interest-rate and trade developments covered in later sections could affect. The Bank of Canada describes a path from the policy rate through mortgage costs to household spending, and the idea that US tariffs affect the timing of exports remains a hypothesis. Output growth is related to employment, tax revenue and the fiscal position, which later sections cover; the explorer records no relationship from output to them.
Risks
On 28 October the Bank of Canada said that, owing to new US tariffs, growth is expected to slow in the fourth quarter of 2026, before picking up again in 2027.
Evidence: Bank of Canada: Bank of Canada raises the policy rate by 25 basis points to 2½% (28 October 2026)
In its October report the Bank named the evolution of energy prices and Canada's trade relationship with the United States as the two most important risks to the inflation outlook. These are the central bank's assessments, quoted as context and not tested here.
Evidence: Bank of Canada: Monetary Policy Report, October 2026: Risks
What it means for decisions
For a business planning sales. National output is a poor guide to demand per customer, because per-person output has barely grown. A firm whose sales growth depended on a growing customer base may find that it slows with population growth, while a firm that depends on spending per customer faces near-flat output per person.
For a worker or household. Per-person output is a broad measure of the room for pay to rise in real terms. It has been flat for several years, and the productivity section shows what that means for pay.
For a policymaker. The two sources of growth, more people and more output per person, have different implications. A policy that adds people raises total output but need not raise output per person; a policy that raises investment or productivity raises output per person. The Bank of Canada, cited in the risks section, expects growth to slow in the fourth quarter, and the population section shows the first source slowing.
For an investor. The comparison with peers is more relevant than the national headline: a ten-year record of low per-person growth is part of the context for valuations and for the exchange rate, but this report does not estimate either.
What the data cannot say. The quarterly series are revised, and the international comparison uses a purchasing-power base that is itself revised. Growth contributions are annualised. Nothing here is a forecast.
What to watch
The next releases, both on 30 November 2026, are monthly GDP by industry for September and third-quarter GDP (dates are listed under the charts and in the release calendar).
Prepared with AI assistance.
Follow the relationships
- Canada 12 with evidence · 22 recorded Open in Studio
- Household spending 1 with evidence · 1 recorded Open in Studio
- Business investment 0 with evidence · 0 recorded Open in Studio
- Merchandise exports 4 with evidence · 4 recorded Open in Studio
Upcoming releases
- 2026-11-30 Gross domestic product by industry September 2026 · Statistics Canada
- 2026-11-30 Gross domestic product, income and expenditure Third quarter 2026 · Statistics Canada
Sources for this section (6 datasets, 6 documents)
Data
- Gross domestic product, expenditure-based, Canada, quarterly (36-10-0104-01; 9 series; latest Q2 2026; retrieved 2026-10-23)
- Gross domestic product (GDP) at basic prices, by industry, monthly (36-10-0434-01; 5 series; latest August 2026; retrieved 2026-11-05)
- Population estimates, quarterly (17-10-0009-01; 1 series; latest 1 July 2026; retrieved 2026-10-23)
- Gross domestic product, expenditure-based, provincial and territorial, annual (36-10-0222-01; 8 series; latest 2025; retrieved 2026-11-07)
- GDP per capita, PPP (constant 2021 international $) (all economies; World Bank) (WDI NY.GDP.PCAP.PP.KD; series; latest annual; retrieved 2026-10-23)
- GDP growth (annual %) (all economies; World Bank) (WDI NY.GDP.MKTP.KD.ZG; series; latest annual; retrieved 2026-10-23)
Documents cited
- Statistics Canada: The Daily: Gross domestic product, income and expenditure, second quarter 2026 (retrieved 2026-10-22)
- Statistics Canada: The Daily: Canadian international merchandise trade, August 2026 (retrieved 2026-10-22)
- Statistics Canada: The Daily: Canada's population estimates, second quarter 2026 (retrieved 2026-11-07)
- Bank of Canada: Tiff Macklem, Governor: Monetary policy at work, remarks to CFA Québec (7 February 2023) (retrieved 2026-11-07)
- Bank of Canada: Bank of Canada raises the policy rate by 25 basis points to 2½% (28 October 2026) (retrieved 2026-11-07)
- Bank of Canada: Monetary Policy Report, October 2026: Risks (retrieved 2026-11-07)
Each dataset is used under its licence; attribution and series-level detail are in each chart’s “About this data” panel. Limitations: GDP measures market production, not income, wealth or well-being. Real GDP per person here divides annual-rate output by the population on the first day of the quarter. Quarterly figures are revised for years afterwards. Provincial GDP is annual and ends before the quarterly national figures.
Is Canada getting more out of each hour worked, and can it pay for rising wages that way?
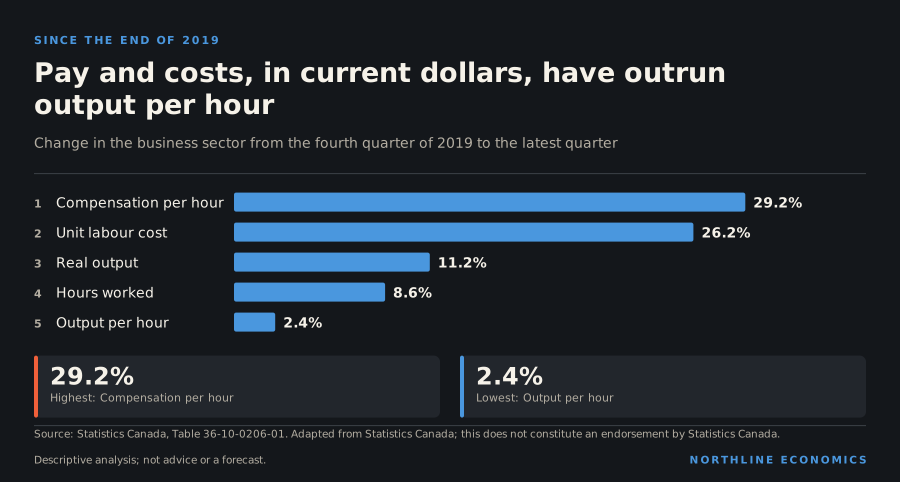
Output per hour in the business sector is up only 2.4% since 2019, while hourly pay in current dollars is up 29.2%: a four-decade story with a sharp recent edge
Graphic: Pay and costs, in current dollars, have outrun output per hour
What happened
Business-sector labour productivity, measured as real output per hour worked, was 105.3 (index, 2017 = 100) in Q2 2026, up 1.0% from the previous quarter and 1.2% from a year earlier. Since the fourth quarter of 2019 business-sector real output has risen 11.2%, but hours worked have risen 8.6%, so most of the growth in output came from working more hours and not from producing more per hour.
Business-sector productivity, hours and output
Index, 2017 = 100, seasonally adjusted. Labour productivity is real GDP per hour worked in the business sector.
Chart loads when it comes into view.
Latest values: Labour productivity (output per hour) 105.3 (2026 Q2); Hours worked 111.1 (2026 Q2); Real GDP 116.9 (2026 Q2).
Related relationships: Labour productivity
Statistics Canada reported that the second-quarter productivity gain was the largest since the second quarter of 2020, that it came from higher value added while hours worked fell, that it was spread across 12 of the 16 main industry sectors, and that mining and oil and gas extraction, wholesale trade and manufacturing contributed most.
Compensation per hour, in current dollars, is up 29.2% since the end of 2019, far more than output per hour, which has pushed unit labour cost (compensation per unit of output) up 26.2% over the same period and 3.2% in the last year.
Hourly compensation and unit labour cost
Index, 2017 = 100. Unit labour cost rises when compensation per hour grows faster than output per hour.
Chart loads when it comes into view.
Latest values: Compensation per hour 141.4 (2026 Q2); Unit labour cost 134.3 (2026 Q2).
Related relationships: Labour productivity
Why it happened
The accounting is straightforward: unit labour cost rises when hourly compensation grows faster than output per hour. Hourly compensation here is in current dollars, so it includes inflation; the productivity series is in real terms. Part of the 29.2% rise in compensation per hour is therefore price inflation, which is why unit labour cost is a better guide to cost pressure than compensation alone.
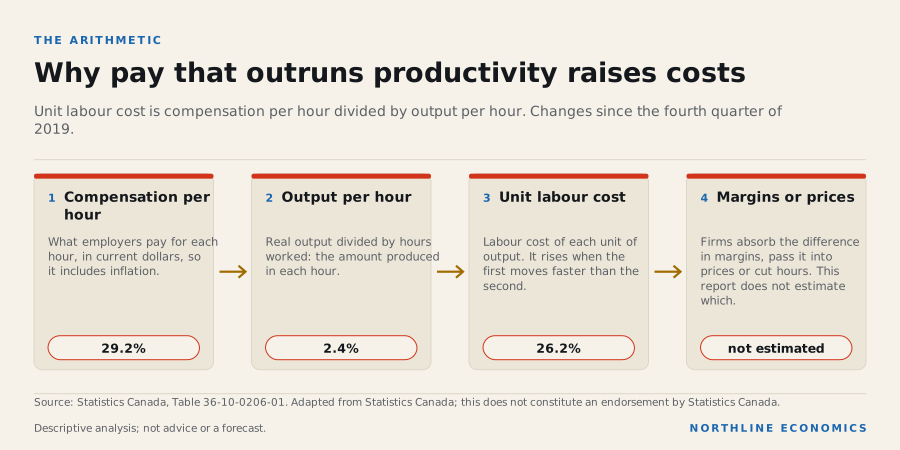
The data behind this graphic
| Step | What happens |
|---|---|
| Compensation per hour | What employers pay for each hour, in current dollars, so it includes inflation. |
| Output per hour | Real output divided by hours worked: the amount produced in each hour. |
| Unit labour cost | Labour cost of each unit of output. It rises when the first moves faster than the second. |
| Margins or prices | Firms absorb the difference in margins, pass it into prices or cut hours. This report does not estimate which. |
This report does not separate the sources of the productivity slowdown: reallocation across industries, capital investment, technology adoption and measurement issues are all discussed in the literature and none is estimated here.
Statistics Canada noted that compensation grew faster than real GDP in the second quarter, so unit labour costs rose for a fifth consecutive quarter.
Why it matters
The Bank of Canada explains productivity as how much is produced in a set amount of time, says high productivity helps raise the standard of living and keep the economy competitive, and states that the average wage tends to rise at about the rate of inflation plus the rate at which labour productivity grows. Read against that rule, a decade in which output per hour grew 0.7% a year on average implies little room for pay to outpace inflation without raising unit labour costs, which is the pattern in the unit labour cost chart.
Evidence: Bank of Canada: Understanding productivity; Bank of Canada: Making cents of wages
Productivity also bears on competitiveness (an exporter's cost per unit of output) and on monetary policy: the Bank notes that a more productive economy can grow without sparking inflation, which generally reduces the need to raise interest rates.
Labour productivity growth
Percent change from the same quarter a year earlier (derived).
Chart loads when it comes into view.
Latest values: Output per hour 1.19 (2026 Q2); Hours worked 0.03 (2026 Q2).
History
The business-sector productivity index stood at 63.7 in the first quarter of 1981 (2017 = 100). It is 105.3 now, so output per hour is up 65.3% in the 45 years of data this report holds. That is a rise, but a slow one, and the pace has not been even.
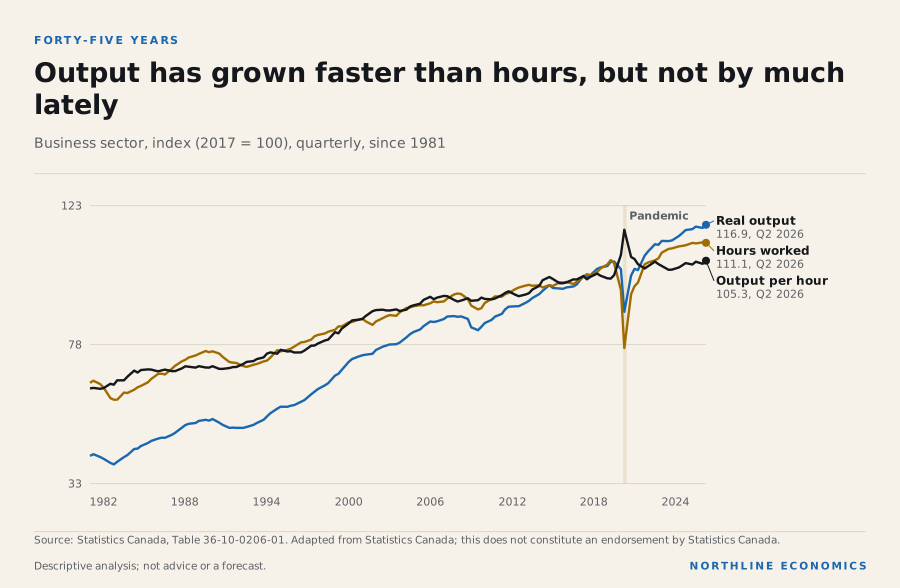
The data behind this graphic
| Series | Latest |
|---|---|
| Real output | 116.9, Q2 2026 |
| Hours worked | 111.1, Q2 2026 |
| Output per hour | 105.3, Q2 2026 |
The decade-by-decade levels show the unevenness. Output per hour gained more in the 1990s than in either of the two decades after it.
| Quarter | Output per hour | Hours worked | Real output | Compensation per hour |
|---|---|---|---|---|
| 1981 Q1 | 63.7 | 65.5 | 41.7 | 27.0 |
| 1990 Q1 | 70.9 | 75.8 | 53.7 | 45.5 |
| 2000 Q1 | 84.9 | 85.2 | 72.3 | 62.0 |
| 2010 Q1 | 92.8 | 91.5 | 85.0 | 84.2 |
| 2019 Q4 | 102.9 | 102.3 | 105.2 | 109.4 |
| Latest | 105.3 | 111.1 | 116.9 | 141.4 |
Index, 2017 = 100. Compensation per hour is in current dollars; the other three are in real terms.
Read across a row and the sources of growth separate. Between 1990 and 2000 the productivity index rose from 70.9 to 84.9. Between 2000 and 2010 it rose from 84.9 to 92.8, and between 2010 and the end of 2019 from 92.8 to 102.9. Since the end of 2019 it has moved from 102.9 to 105.3 in Q2 2026. The latest window is the shortest and the weakest of the five.
Over the past twenty years output per hour has grown 0.6% a year on average and over the past ten 0.7%. Quarter-to-quarter growth is noisy, and the averages smooth that, but the table shows the same thing without averaging.
The comparison with pay is the part of the history that has changed most. Over the 45 years, compensation per hour rose from 27.0 to 141.4 in current dollars, a figure dominated by inflation. The unit labour cost index tells the more useful story, because it nets productivity out.
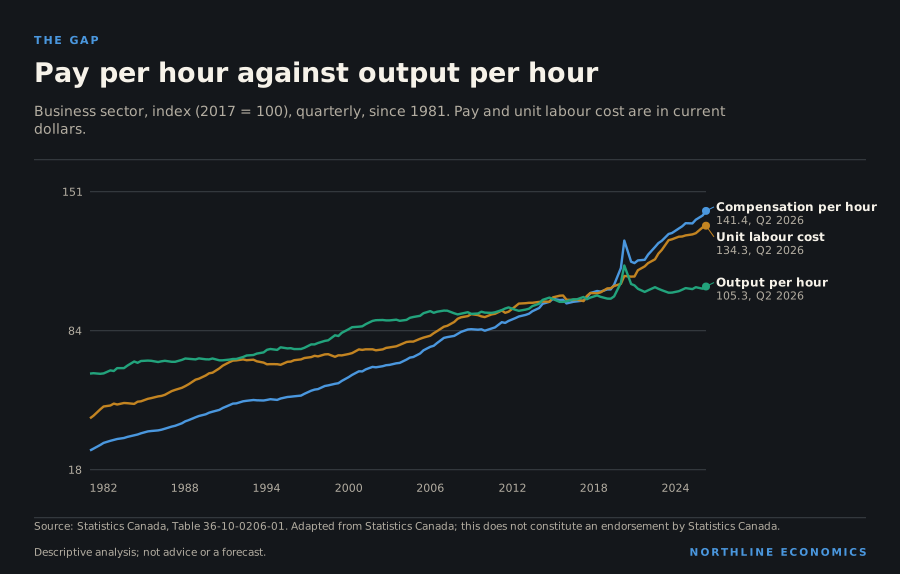
The data behind this graphic
| Series | Latest |
|---|---|
| Compensation per hour | 141.4, Q2 2026 |
| Unit labour cost | 134.3, Q2 2026 |
| Output per hour | 105.3, Q2 2026 |
Unit labour cost is up 83.8% since the start of 2000 and 26.2% since the end of 2019. A large part of the first rise is inflation, which a nominal series cannot separate, so the right comparison is with prices over the same period; the prices section carries that. The recent rise matters because it came quickly. Since 2000, hours worked have grown by more than output per hour: Canada’s business sector has grown more by adding hours than by making each hour more productive, and the same is true of the past six years.
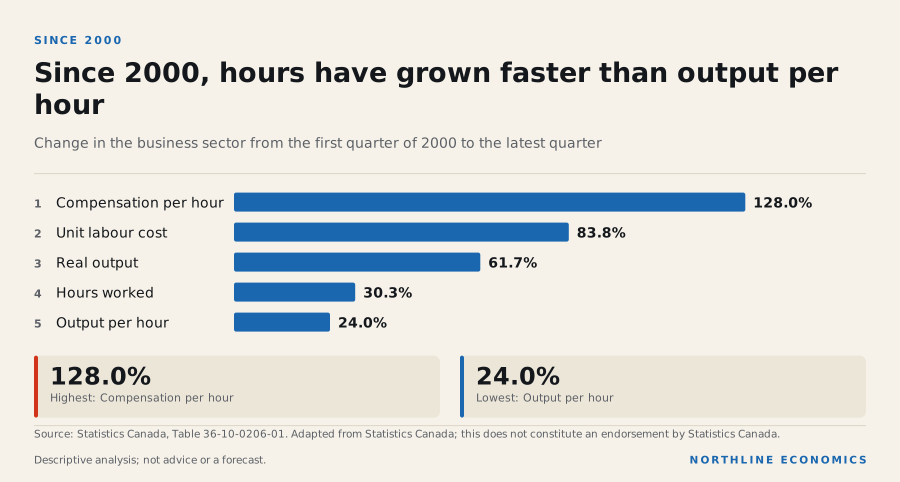
The data behind this graphic
| Item | Value |
|---|---|
| Compensation per hour | 128.0% |
| Unit labour cost | 83.8% |
| Real output | 61.7% |
| Hours worked | 30.3% |
| Output per hour | 24.0% |
Across geographies
Among the peer economies on this platform, Canada’s output per person employed (World Bank, constant 2021 purchasing-power-parity dollars) was $113,563 in 2025, which is 72% of the United States level of $156,983. This definition (per person employed, adjusted for purchasing power) differs from the Statistics Canada hours-based index above, so the two should be compared on direction, not level.
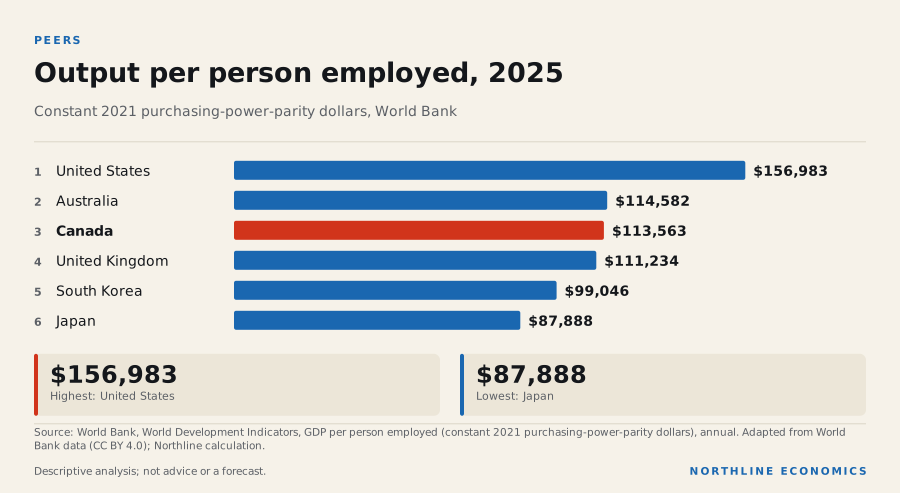
The data behind this graphic
| Item | Value |
|---|---|
| United States | $156,983 |
| Australia | $114,582 |
| Canada | $113,563 |
| United Kingdom | $111,234 |
| South Korea | $99,046 |
| Japan | $87,888 |
In 2000 a Canadian worker produced $98,476 against $109,946 in the United States. Canada was then ahead of the United Kingdom ($93,311) and Australia ($95,966). In 2025 the United Kingdom, at $111,234, is within a few per cent of Canada and Australia, at $114,582, is slightly ahead of it. South Korea, at $57,330 in 2000, is at $99,046 now: it has closed most of its distance from Canada in 25 years. Japan, at $87,888, is below all five.
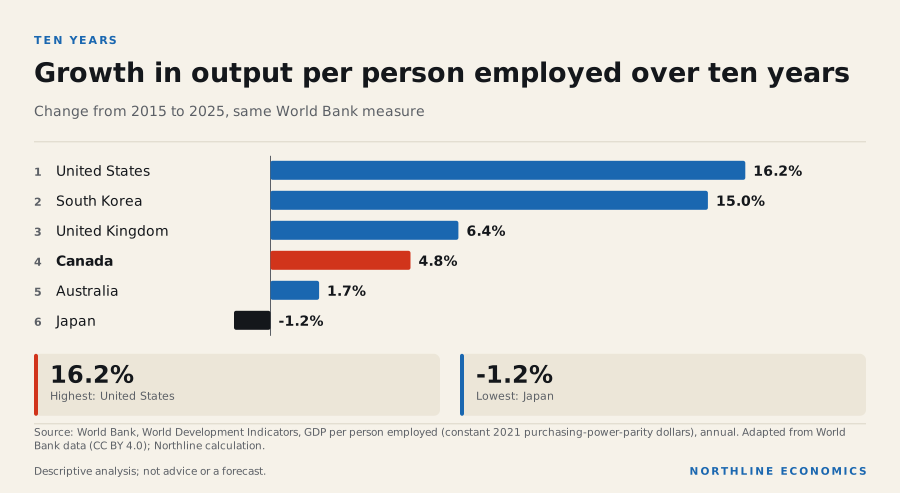
The data behind this graphic
| Item | Value |
|---|---|
| United States | 16.2% |
| South Korea | 15.0% |
| United Kingdom | 6.4% |
| Canada | 4.8% |
| Australia | 1.7% |
| Japan | -1.2% |
Over the last ten years the United States and South Korea pulled ahead of the rest. Canada’s 4.8% sits fourth of the six, ahead of Australia and Japan and behind the United Kingdom. The United States rose 16.2%, so the gap that opened with it in the 2000s has grown rather than narrowed. This is a comparison of levels on a purchasing-power basis. It is not a measure of living standards, which also depend on hours worked per person, the terms of trade and how income is distributed.
Regional productivity differences are not assessed: Statistics Canada publishes industry-level productivity for provinces on a different, less timely schedule, and this report does not hold it. The provincial pattern of output per worker for energy-heavy provinces is described in the research note on Alberta’s energy economy.
What it influences
Productivity feeds into wages, unit labour costs and competitiveness. The Bank of Canada's rule of thumb, cited above, is the only statement here that links productivity and wages, and the relationship in Canadian data is not estimated in this report. That inflation feeds into wages is a hypothesis.
Risks
A Bank of Canada speech says businesses in Canada have been investing too little for too long, that faced with sluggish demand growth they are less inclined to invest in new equipment or technology that could improve productivity, and that the average productivity gap between Canada and the other G7 countries has continued to widen since the start of the 2000s, particularly with the United States.
Evidence: Bank of Canada: Toward a virtuous circle for productivity (speech, N. Vincent)
Statistics Canada finds that the Canada-US business-sector productivity gap is partly explained by Canada's higher share of small firms and their greater productivity disadvantage relative to large firms, and attributes the prevalence of small firms partly to the country's smaller domestic market, which limits opportunities for scaling up.
Evidence: Statistics Canada: The role of firm size in the Canada–U.S. labour productivity gap since 2000
Budget 2025 cites a Statistics Canada estimate that the federal regulatory burden rose 37 per cent between 2006 and 2021 and that business investment in 2021 would have been 9 per cent higher had it stayed at 2006 levels.
Evidence: Finance Canada: Budget 2025, Chapter 1: Productivity and Competitiveness
The Competition Bureau's study says Canada has faced persistent productivity challenges and that its regulatory environment is now among the least competition-friendly compared with similar countries.
The Bank of Canada's July 2026 report said that in its base case trend labour productivity was estimated to have picked up in 2025 and to continue growing strongly, and that trend labour productivity growth beyond 2025 could be lower than assumed. Its October 2026 report says that rising business investment, bolstered by federal tax incentives such as the Productivity Mega Deduction, and increased adoption of artificial intelligence support production and labour productivity, while slow growth of the labour force and the impact of US tariffs on productivity growth constrain production. These statements describe different periods and are not in conflict: the speech concerns a gap that has widened since 2000, the reports the most recent trend and the Bank's outlook.
Evidence: Bank of Canada: Monetary Policy Report, July 2026: Risks; Bank of Canada: Monetary Policy Report, October 2026: Outlook
Real investment in machinery and equipment is up 2.8% since 2014 and in intellectual property products 50.7%, while investment in non-residential structures, which peaked in Q4 2014, is 17.3% lower.
Business investment by asset, indexed
Real gross fixed capital formation, chained 2017 dollars, annual rate; start of the period = 100.
Chart loads when it comes into view.
Latest values: Residential structures 154,600,000,000 (2026 Q2); Non-residential structures 130,700,000,000 (2026 Q2); Machinery and equipment 85,550,000,000 (2026 Q2); Intellectual property products 63,950,000,000 (2026 Q2).
Related relationships: Business investment · Residential construction
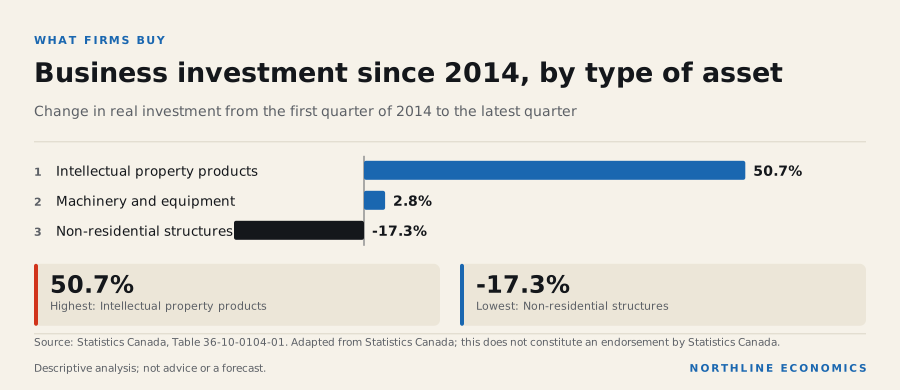
The data behind this graphic
| Item | Value |
|---|---|
| Intellectual property products | 50.7% |
| Machinery and equipment | 2.8% |
| Non-residential structures | -17.3% |
Spending has grown in intellectual property such as software and research and fallen in non-residential structures such as buildings and pipelines. It is a fact about the asset mix, not by itself a cause of weak productivity, and this report does not estimate the link.
What it means for decisions
For an employer. The arithmetic of the unit labour cost chain gives three choices when pay rises faster than output per hour: accept lower margins, raise prices, or raise output per hour. The first two are limited by competition. The third is what investment in machinery, software and training aims to do, which is why the asset mix in the risks section matters to individual firms and not only to the national accounts. Exporters face the sharpest version, because they may not be able to pass costs on to foreign buyers.
For an investor or lender. A sector where unit labour cost has risen faster than prices has less room for further wage increases. This report does not show unit labour cost by sector; the business-sector aggregate here is only the backdrop.
For a policymaker. The Bank of Canada’s rule of thumb, wages rising at about inflation plus productivity growth, means that with productivity close to flat, wage growth above inflation has to come from somewhere else. The Bank also notes that a more productive economy can grow without sparking inflation, which generally reduces the need to raise interest rates. The Budget 2025 and Competition Bureau papers cited above also address productivity.
Evidence: Bank of Canada: Making cents of wages; Bank of Canada: Understanding productivity
For a household. Over long periods, living standards track output per person, which is output per hour multiplied by hours per person. Hours per person are limited by demographics and by choice; output per hour is the one that can keep rising. A decade of low growth in it is a decade in which pay gains above inflation are harder to fund.
What the data cannot say. The report cannot tell how much of the weakness is measurement, how much is the composition of what Canada produces, and how much is investment. The peers chart is a comparison of levels on one definition and is subject to revision. Nothing here is a forecast.
What to watch
The productivity release for the third quarter follows the third-quarter GDP release (see the release calendar). Watch whether hours worked and output keep diverging, whether unit labour cost keeps rising faster than prices, and whether business investment in machinery and equipment turns into faster output per hour.
Prepared with AI assistance.
Follow the relationships
- Labour productivity 0 with evidence · 0 recorded Open in Studio
- Wages 0 with evidence · 0 recorded Open in Studio
- Business investment 0 with evidence · 0 recorded Open in Studio
Upcoming releases
- 2026-12-03 Labour productivity, hourly compensation and unit labour cost Third quarter 2026 · Statistics Canada
Sources for this section (3 datasets, 9 documents)
Data
- Indexes of business sector labour productivity, unit labour cost and related measures, seasonally adjusted (36-10-0206-01; 6 series; latest Q2 2026; retrieved 2026-10-23)
- Gross domestic product, expenditure-based, Canada, quarterly (36-10-0104-01; 3 series; latest Q2 2026; retrieved 2026-10-23)
- GDP per person employed (constant 2021 PPP $) (all economies; World Bank) (WDI SL.GDP.PCAP.EM.KD; series; latest annual; retrieved 2026-10-23)
Documents cited
- Statistics Canada: The Daily: Labour productivity, hourly compensation and unit labour cost, second quarter 2026 (retrieved 2026-10-22)
- Bank of Canada: Understanding productivity (retrieved 2026-10-22)
- Bank of Canada: Making cents of wages (retrieved 2026-10-22)
- Bank of Canada: Toward a virtuous circle for productivity (speech, N. Vincent) (retrieved 2026-10-25)
- Statistics Canada: The role of firm size in the Canada–U.S. labour productivity gap since 2000 (retrieved 2026-10-25)
- Finance Canada: Budget 2025, Chapter 1: Productivity and Competitiveness (retrieved 2026-10-25)
- Competition Bureau Canada: Study finds Canada could unlock major economic gains through stronger competition (retrieved 2026-10-25)
- Bank of Canada: Monetary Policy Report, July 2026: Risks (retrieved 2026-10-25)
- Bank of Canada: Monetary Policy Report, October 2026: Outlook (retrieved 2026-11-07)
Each dataset is used under its licence; attribution and series-level detail are in each chart’s “About this data” panel. Limitations: Productivity here is output per hour in the business sector (Statistics Canada, table 36-10-0206-01), seasonally adjusted. International comparisons use World Bank output per person employed in constant 2021 purchasing-power-parity dollars, a different definition that is not comparable in level with the Statistics Canada index. Hourly compensation includes inflation. The federal regulatory-burden estimate is quoted as Budget 2025 cited it; the productivity measures in Budget 2026, tabled on 5 November 2026, are not assessed.
Is the unemployment rate falling because more people are working, or because fewer are looking?
In October 2026 unemployment was 6.7%, down 0.2 percentage points in a year, but employment had grown only 0.1% and participation had fallen
Graphic: Unemployment: everyone, and the young
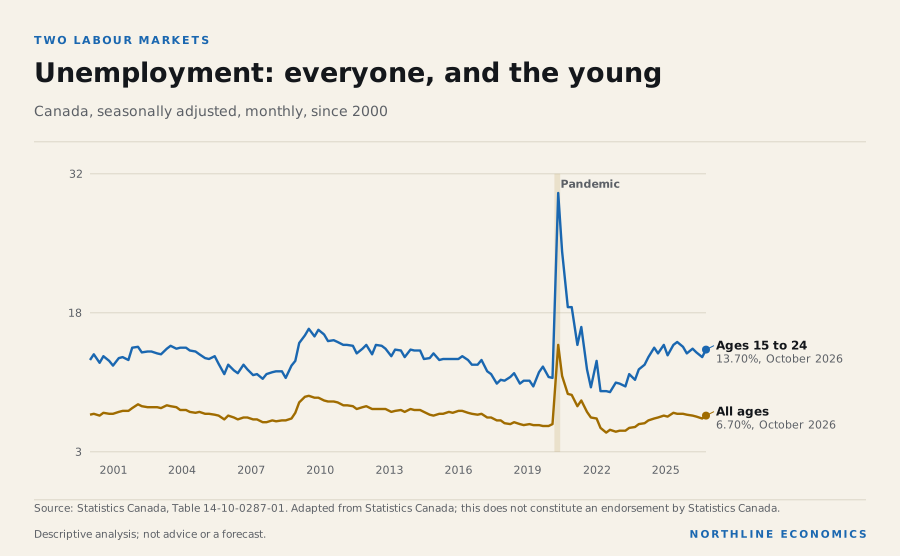
What happened
The unemployment rate was 6.7% in October 2026; it rose by 0.2 percentage points from the previous month and fell by 0.2 percentage points from a year earlier. Employment fell by 4,700 in the month to 21.1 million and is 0.1% higher than a year earlier. The participation rate was 64.8%, which fell by 0.4 percentage points over the year, and the employment rate was 60.5% (-0.3 percentage points over the year).
Unemployment rate
Percent of the labour force, seasonally adjusted.
Chart loads when it comes into view.
Latest values: Canada 6.7 (2026-10).
Related relationships: Canada
Participation and employment rates
Percent of the population aged 15 and over, seasonally adjusted. The participation rate is the share working or looking for work.
Chart loads when it comes into view.
Latest values: Participation rate 64.8 (2026-10); Employment rate 60.5 (2026-10).
Statistics Canada described employment as little changed in October and said the unemployment rate rose as more people searched for work. It reported that employment fell in wholesale and retail trade and rose in construction and educational services, that it decreased in Alberta and Prince Edward Island and increased in British Columbia and Newfoundland and Labrador, and that the youth unemployment rate rose as youth employment edged down and more young people searched for work. In September, when the participation rate was 64.8%, it described the rate as the lowest since December 1997 outside 2020. Public-sector employment fell for four straight months before rising in October, and it was still down from a year earlier.
Evidence: Statistics Canada: Labour Force Survey, October 2026 (The Daily); Statistics Canada: The Daily: Labour Force Survey, September 2026
By industry over the year to October 2026, employment rose 3.9% in health care and social assistance and 1.2% in professional services but fell in educational services (by 3.0%), public administration (1.8%), wholesale and retail trade (3.7%) and forestry, fishing, mining and oil and gas (3.0%).
Employment by industry, indexed
Labour Force Survey, seasonally adjusted; start of the period = 100.
Chart loads when it comes into view.
Latest values: Goods-producing 4,202,000 (2026-10); Services-producing 16,900,000 (2026-10); Forestry, fishing, mining, oil and gas 326,900 (2026-10); Manufacturing 1,838,000 (2026-10); and 5 more in the data table.
Related relationships: Forestry, fishing, mining, quarrying, oil and gas · Manufacturing · Construction · Professional, scientific and technical services
Fewer of us at work
The unemployment rate counts people who are looking for work and cannot find it. It does not count those who are not looking, which is why two other rates matter more for the long run. The participation rate is the share of people aged 15 and over who are working or looking. The employment rate is the share who are working.
Both are lower than they were. The participation rate is 64.8%, down from 65.8% at the end of 2019 and well below the 67.7% of November 2007, its high of the past twenty years. The employment rate is 60.5%, against 62.2% at the end of 2019 and 63.6% in February 2008.
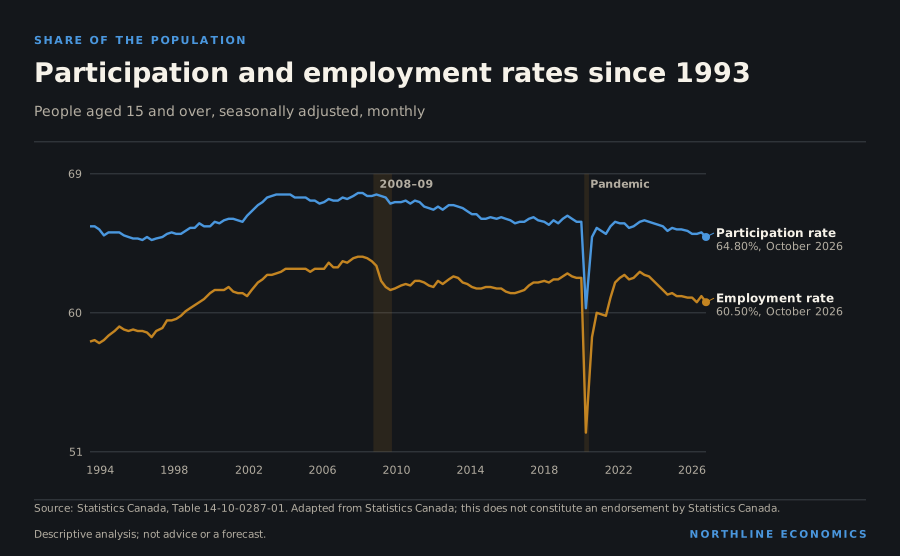
The data behind this graphic
| Series | Latest |
|---|---|
| Participation rate | 64.80%, October 2026 |
| Employment rate | 60.50%, October 2026 |
This is the sense in which the labour market is weaker than the unemployment rate suggests. Total employment is 21.1 million, 10.0% above December 2019, and employment has grown, but the working-age population has grown faster, so a smaller share of the population is employed. The gap between the two rates, 64.8% and 60.5%, is the unemployed. At the end of 2019 the same two rates were 65.8% and 62.2%.
Statistics Canada attributes the lower participation rate in September 2026, relative to a year earlier and to the pre-pandemic period, largely to population aging. Its population estimates separately show the 20-to-29 age group shrinking, consistent with fewer international students. Those are changes in who is in the population, not in how any group behaves, and the series cannot separate them from changes in behaviour.
Evidence: Statistics Canada: The Daily: Labour Force Survey, September 2026; Statistics Canada: The Daily: Canada's population estimates, second quarter 2026
Where the jobs are
Employment growth since 2019 has been concentrated.
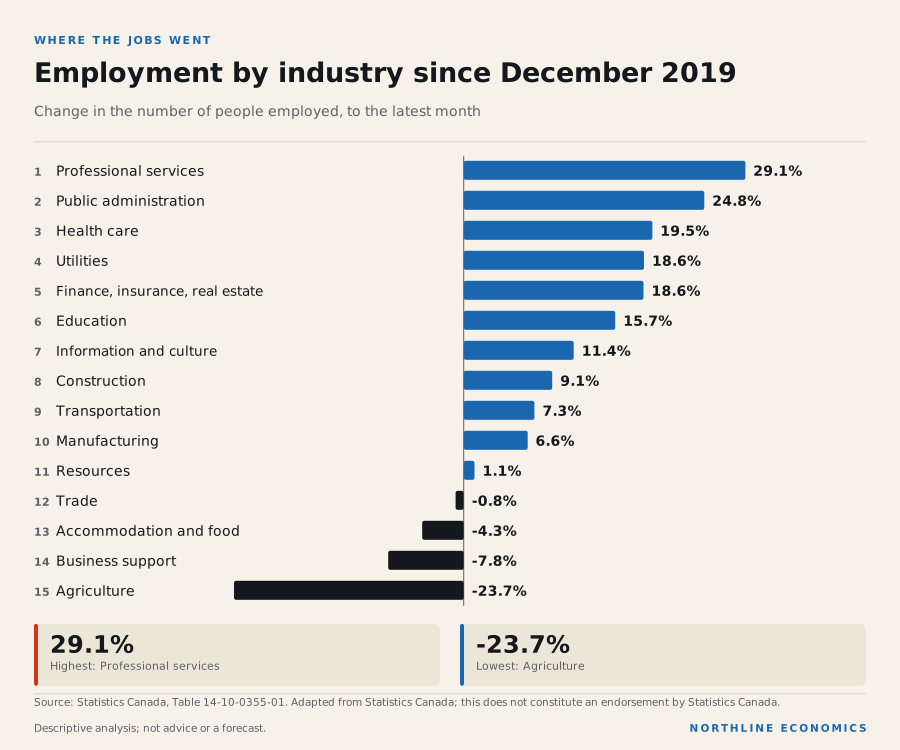
The data behind this graphic
| Item | Value |
|---|---|
| Professional services | 29.1% |
| Public administration | 24.8% |
| Health care | 19.5% |
| Utilities | 18.6% |
| Finance, insurance, real estate | 18.6% |
| Education | 15.7% |
| Information and culture | 11.4% |
| Construction | 9.1% |
| Transportation | 7.3% |
| Manufacturing | 6.6% |
| Resources | 1.1% |
| Trade | -0.8% |
| Accommodation and food | -4.3% |
| Business support | -7.8% |
| Agriculture | -23.7% |
Professional services (29.1%), public administration (24.8%), health care (19.5%) and utilities (18.6%) lead. Employment in wholesale and retail trade is close to its end-2019 level (-0.8%), in accommodation and food it is lower (-4.3%), and in agriculture it is 23.7% lower. Manufacturing employment is 6.6% higher, even though its real output is lower, as the industry section notes.
Public administration is a leader over six years. Public-sector employment, a separate measure by class of worker, has been a source of recent weakness: Statistics Canada reports that it fell for four straight months to September and rose in October, leaving it below its level of a year earlier. Health care and education are sectors to watch in the next release.
Evidence: Statistics Canada: Labour Force Survey, October 2026 (The Daily); Statistics Canada: The Daily: Labour Force Survey, September 2026
Young and prime-age workers
Youth unemployment is 13.7% against 5.6% for those aged 25 to 54. Both are higher than in December 2019 (10.8% and 4.7%), and both are lower than the pandemic peaks. The gap between the two has widened.
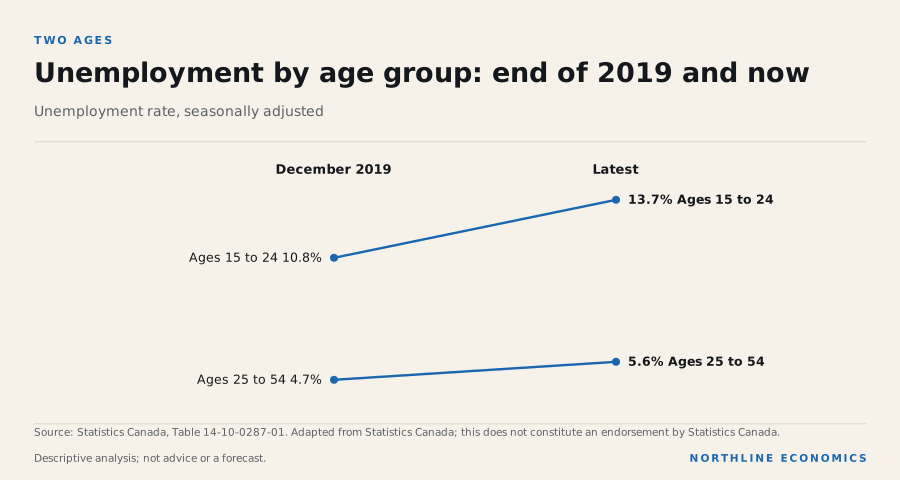
The data behind this graphic
| Item | December 2019 | Latest |
|---|---|---|
| Ages 15 to 24 | 10.8% | 13.7% |
| Ages 25 to 54 | 4.7% | 5.6% |
Youth unemployment is a more cyclical measure than the headline: it rose more than the headline rate in 2008–09, in 2020 and after 2022, and it is lower than the 30.3% of May 2020. Today’s 13.7% is above the rate of 9.0% in July 2022, which suggests that young people have found it harder to find work than at the 2022 low.
Pay
The average hourly wage across all industries is C$37.89 an hour in October 2026, 32.3% above December 2019 (neither wage series is seasonally adjusted, so these comparisons set different months of the year against each other). In constant 2002 dollars it was C$22.14 an hour in September 2026, against C$21.00 an hour in December 2019: after inflation, pay per hour is 5.4% higher. It was C$22.95 an hour in April 2020, a peak reached as employment collapsed in the pandemic; a change in the mix of who is employed can raise an average without any individual’s pay rising.
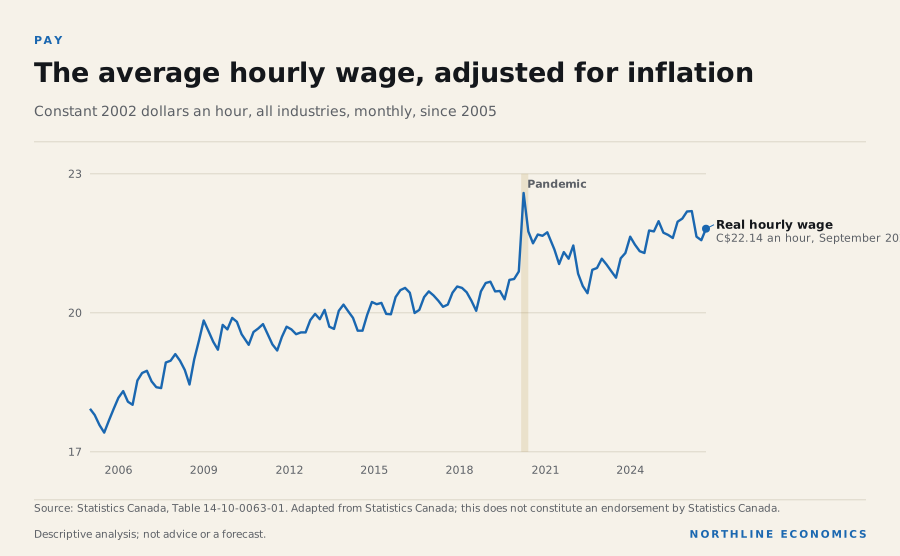
The data behind this graphic
| Series | Latest |
|---|---|
| Real hourly wage | C$22.14 an hour, September 2026 |
The overview shows that the same wage buys about what it bought in early 2021. The two statements are consistent: pay has risen since 2019 in real terms, but has roughly kept pace with prices since early 2021. The productivity section sets pay against output per hour, and the prices section covers inflation.
Why it happened
The unemployment rate fell over the year while employment grew only 0.1% and the employment rate did not rise. Arithmetically, that combination means the labour force shrank while the population grew, so the fall in the unemployment rate coincided with fewer people counted as unemployed rather than with faster job growth. This is a statement about the numbers; the reasons people left or did not enter the labour force are not in these series.
Statistics Canada's releases offer two relevant pieces of context: it attributes the lower participation rate largely to population aging, which resumed in 2025 and 2026 after large increases in immigration offset it in 2023 and 2024, and the 20-to-29 age group shrank, consistent with fewer international students. A population with more older people and fewer people in their twenties has a lower participation rate even without any change in how any group behaves; this report does not measure how much of the fall of 0.4 percentage points is composition and how much is behaviour.
Evidence: Statistics Canada: The Daily: Labour Force Survey, September 2026; Statistics Canada: The Daily: Canada's population estimates, second quarter 2026
Why it matters
Unemployment alone can mislead. Over the long run, the employment rate and the participation rate say more about how much of the population is working. The youth unemployment rate was 13.7% against 5.6% for ages 25 to 54, a gap that shows the headline rate averages very different experiences.
Unemployment rate by age group
Percent of the labour force, seasonally adjusted: all workers, ages 25 to 54 and ages 15 to 24.
Chart loads when it comes into view.
Latest values: All ages (15+) 6.7 (2026-10); Ages 25 to 54 5.6 (2026-10); Ages 15 to 24 13.7 (2026-10).
Related relationships: Canada
Wages grew 2.2% over the year to October 2026, to an average of C$37.89 an hour, down from 3.5% a year earlier, while consumer prices rose 3.1% in the year to September 2026. Average hourly wages are therefore growing more slowly than consumer prices; the figure is for employees and is not adjusted for changes in the mix of jobs, which can move the average even if no individual's pay changes.
Wage growth
Percent change in the average hourly wage from a year earlier (derived).
Chart loads when it comes into view.
Latest values: All industries 2.24 (2026-10); Goods-producing 1.35 (2026-10); Services-producing 2.48 (2026-10).
In its October 2026 Monetary Policy Report the Bank of Canada said the unemployment rate has hovered around 6.5% in recent months, that finding work continues to be challenging and some slack remains in the labour market, and that wage growth has been around 3% across many measures. Its rate announcement the same day said a broad set of indicators continue to point to some excess supply in the economy.
Evidence: Bank of Canada: Monetary Policy Report, October 2026: Current conditions; Bank of Canada: Bank of Canada raises the policy rate by 25 basis points to 2½% (28 October 2026)
History
The unemployment rate peaked at 14.2% in May 2020, touched 4.8% in July 2022 and has averaged 6.6% over ten years, so the current rate is close to its decade average. Participation has fallen from 65.8% at the end of 2019. The job vacancy rate fell from a ten-year high of 6.0% in April 2022 to 2.9% in August 2026 (529 thousand vacancies; the series is not seasonally adjusted), which means far fewer unfilled jobs relative to employment than in 2022.
Job vacancies and the vacancy rate
Job Vacancy and Wage Survey / payroll data, not seasonally adjusted. The chart shows the vacancy rate; the number of vacancies is in the data table.
Chart loads when it comes into view.
Latest values: Job vacancy rate 2.9 (2026-08).
Across geographies
Provincial unemployment rates range from 5.0% in Manitoba to 8.7% in Newfoundland and Labrador; Alberta is at 7.3% and Ontario at 7.3%. Alberta's employment is 1.6% higher than a year ago while Quebec's is 2.3% lower. Average hourly wages are highest in British Columbia at C$39.54 an hour (1st of 10) and lowest in Manitoba at C$32.46 an hour (10th of 10); Alberta is at C$39.00 an hour (2nd of 10) and Ontario at C$38.96 an hour (3rd of 10).
Unemployment rate by province
Percent, seasonally adjusted, monthly. Province series, Labour Force Survey.
Chart loads when it comes into view.
Latest values: Alberta 7.3 (2026-10); British Columbia 6.3 (2026-10); Saskatchewan 5.9 (2026-10); Manitoba 5 (2026-10); and 6 more in the data table.
Related relationships: Alberta · British Columbia · Saskatchewan · Manitoba
Employment by province, indexed
Seasonally adjusted; start of period = 100.
Chart loads when it comes into view.
Latest values: Alberta 2,660,000 (2026-10); British Columbia 2,941,000 (2026-10); Saskatchewan 624,600 (2026-10); Manitoba 752,500 (2026-10); and 6 more in the data table.
Related relationships: Alberta · British Columbia · Saskatchewan · Manitoba · 2 relationships use this data as evidence
Employment rate by province
Percent of population aged 15 and over, seasonally adjusted.
Chart loads when it comes into view.
Latest values: Alberta 63.8 (2026-10); British Columbia 60.7 (2026-10); Saskatchewan 63.1 (2026-10); Manitoba 63.1 (2026-10); and 6 more in the data table.
Metropolitan unemployment rates (three-month averages) are shown separately and must not be read against the provincial monthly rates; see the city reports.
Unemployment rate by metropolitan area
Percent, three-month moving average, seasonally adjusted. Census metropolitan areas only; do not compare with provincial monthly rates (different smoothing).
Chart loads when it comes into view.
Latest values: Calgary 6.6 (2026-10); Edmonton 7.1 (2026-10); Toronto 7.1 (2026-10); Vancouver 6.7 (2026-10); and 2 more in the data table.
Related relationships: Calgary · Edmonton · Toronto · Vancouver
In the latest monthly data the unemployment rate is 6.7% in Canada (October 2026), 4.2% in the United States (September 2026), 6.5% in the euro area (September 2026) and 4.7% in the United Kingdom (July 2026) (national definitions differ; see the Global report).
What it influences
Employment and wages feed household income, spending and tax revenue. Any link from business investment to employment, or from employment to population growth, is a hypothesis: no source measures them here. That wages respond to inflation is also a hypothesis.
Risks
Employment fell by 115 thousand over three months while the unemployment rate stayed near its decade average.
Public-sector job losses earlier in 2026, slowing population growth and uncertainty about trade are mentioned in official commentary; their size is not measured in this report. In October the Bank of Canada said renewed trade uncertainty means businesses may delay expansion and hiring plans, and that owing to new US tariffs growth is expected to slow in the fourth quarter of 2026.
Evidence: Statistics Canada: Labour Force Survey, October 2026 (The Daily); Statistics Canada: The Daily: Canada's population estimates, second quarter 2026; Bank of Canada: Monetary Policy Report, October 2026: Overview; Bank of Canada: Bank of Canada raises the policy rate by 25 basis points to 2½% (28 October 2026)
What it means for decisions
For an employer. The headline unemployment rate near its ten-year average suggests that hiring should not be unusually difficult. The vacancy rate is 2.9%, down from 6.0% at its April 2022 peak, and growth in the average hourly wage is slower than inflation, so pressure on pay is lower than in 2022. The sectors that have added the most workers since 2019 are health care and professional services.
For a worker. Real pay is above its December 2019 level but fell over the year to September 2026. Young workers face a higher unemployment rate than at the 2022 low.
For a policymaker. The employment rate, not unemployment, is the number that shows how many people the economy is using. Statistics Canada attributes the lower participation rate largely to population aging and projects that aging will keep pressing on labour supply, so some of the decline is unlikely to reverse.
Evidence: Statistics Canada: The Daily: Labour Force Survey, September 2026
For a lender or investor. Employment fell over the last three months. The Bank of Canada says economic or geopolitical developments could lead to a downturn and a sharp rise in unemployment, and that households without sufficient savings could fall behind on mortgage and consumer credit payments.
Evidence: Bank of Canada: Financial Stability Report 2026: Households (22 May 2026)
What the data cannot say. The Labour Force Survey is a sample, so monthly changes are noisy, and the series used in this section count people, not hours, and do not show why people leave the labour force.
What to watch
The November Labour Force Survey is due on 4 December 2026 (see the release calendar). Watch the participation rate (does it keep falling?), employment in health care and education, the youth unemployment rate and the wage growth figure relative to inflation.
Prepared with AI assistance.
Follow the relationships
- Employment 0 with evidence · 0 recorded Open in Studio
- Wages 0 with evidence · 0 recorded Open in Studio
- Canada 12 with evidence · 22 recorded Open in Studio
Upcoming releases
- 2026-12-04 Labour Force Survey November 2026 · Statistics Canada
Sources for this section (8 datasets, 7 documents)
Data
- Labour force characteristics, monthly, seasonally adjusted and trend-cycle (14-10-0287-01; 12 series; latest October 2026; retrieved 2026-11-07)
- Employment by industry, monthly, seasonally adjusted and unadjusted, and trend-cycle, last 5 months (14-10-0355-01; 11 series; latest October 2026; retrieved 2026-11-07)
- Employee wages by industry, monthly, unadjusted for seasonality (14-10-0063-01; 7 series; latest October 2026; retrieved 2026-11-07)
- Consumer Price Index, monthly, not seasonally adjusted (18-10-0004-01; 1 series; latest September 2026; retrieved 2026-10-23)
- Job vacancies, payroll employees, and job vacancy rate by provinces and territories, monthly, unadjusted for seasonality (14-10-0371-01; 2 series; latest August 2026; retrieved 2026-11-05)
- US unemployment rate, 16 years and over, seasonally adjusted (BLS LNS14000000; 1 series; latest September 2026; retrieved 2026-11-05)
- Unemployment rate, seasonally adjusted, share of the labour force: Euro area – 21 countries (from 2026) (Eurostat une_rt_m; 1 series; latest September 2026; retrieved 2026-11-05)
- UK unemployment rate, aged 16 and over, seasonally adjusted (ONS LMS / MGSX; 1 series; latest July 2026; retrieved 2026-11-05)
Documents cited
- Statistics Canada: Labour Force Survey, October 2026 (The Daily) (retrieved 2026-11-07)
- Statistics Canada: The Daily: Labour Force Survey, September 2026 (retrieved 2026-10-25)
- Statistics Canada: The Daily: Canada's population estimates, second quarter 2026 (retrieved 2026-11-07)
- Bank of Canada: Monetary Policy Report, October 2026: Current conditions (retrieved 2026-11-07)
- Bank of Canada: Bank of Canada raises the policy rate by 25 basis points to 2½% (28 October 2026) (retrieved 2026-11-07)
- Bank of Canada: Monetary Policy Report, October 2026: Overview (retrieved 2026-11-07)
- Bank of Canada: Financial Stability Report 2026: Households (22 May 2026) (retrieved 2026-10-25)
Each dataset is used under its licence; attribution and series-level detail are in each chart’s “About this data” panel. Limitations: Labour Force Survey estimates are survey-based and carry sampling error, larger for provinces and smaller groups. Wage figures are for employees, not seasonally adjusted. The metropolitan rates used here are three-month moving averages and are not comparable with provincial monthly rates. This section does not break out immigrants, Indigenous people or other groups.
How much of today's inflation is a temporary energy shock, and what is happening to what a wage can buy?
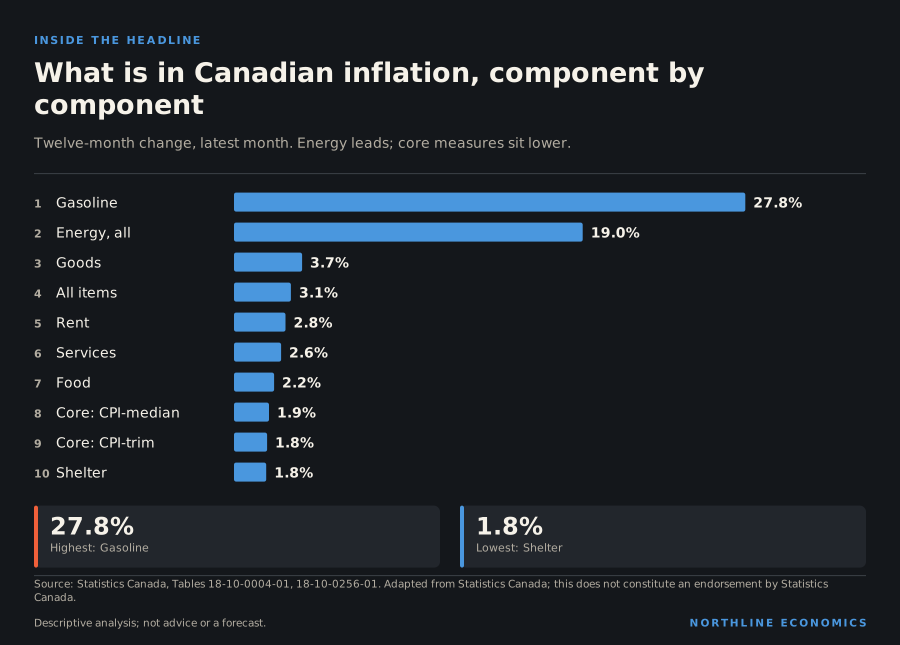
In September 2026 consumer prices were up 3.1% on a year earlier, with gasoline up 27.8%, while core measures sat near the 2% target
Graphic: What is in Canadian inflation, component by component
What happened
Consumer prices were 3.1% higher in September 2026 than a year earlier, after 3.0% in August. The acceleration was in energy prices: gasoline prices were 27.8% higher than a year earlier (up from 22.8% a month before) and the energy group as a whole 19.0%. Food prices rose 2.2%, shelter 1.8% and rent 2.8%, while the mortgage interest cost index changed by -0.2%.
Inflation by major component
Percent change from a year earlier (derived from the CPI indexes).
Chart loads when it comes into view.
Latest values: Food 2.18 (2026-09); Shelter 1.75 (2026-09); Transportation 8.44 (2026-09); Energy 18.95 (2026-09); and 1 more in the data table.
Related relationships: Consumer energy and gasoline prices · 1 relationship use this data as evidence
Measures of core inflation, on Bank of Canada definitions, were below the headline rate: CPI-trim 1.8%, CPI-median 1.9% and CPI-common 2.4%. The all-items index excluding food and energy rose 2.1%. Goods prices rose 3.7% against 2.6% for services, a year earlier the reverse (1.6% and 3.0%).
Headline and core inflation
Percent change from a year earlier. CPI-trim, CPI-median and CPI-common are the Bank of Canada’s preferred core measures; the dotted line marks the 2% target.
Chart loads when it comes into view.
Latest values: Headline CPI 3.09 (2026-09); CPI-trim 1.8 (2026-09); CPI-median 1.9 (2026-09); CPI-common 2.4 (2026-09).
Related relationships: Canada · Consumer price inflation · 1 relationship use this data as evidence
Statistics Canada reported that gasoline and fuel oil drove the acceleration in September, that crude oil prices had reached their highest level since May amid uncertainty about the wars in the Middle East, that the switch to winter-blend gasoline moderated the gasoline increase, and that grocery price growth slowed to its smallest annual increase since May 2024.
Evidence: Statistics Canada: The Daily: Consumer Price Index, September 2026
What it costs to live now
The headline figure measures how fast prices rose in a year. The price level is the cumulative result of many years. The consumer price index is 170.0 (2002 = 100), against 136.4 at the end of 2019 and 93.5 in January 2000. Prices are 24.6% higher than at the end of 2019, 36.8% higher than in January 2015 and 81.8% higher than in January 2000.
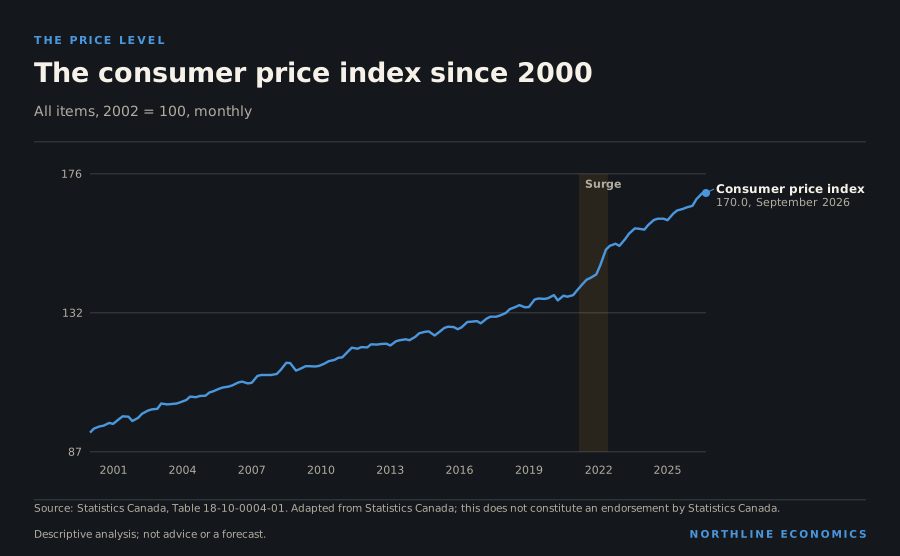
The data behind this graphic
| Series | Latest |
|---|---|
| Consumer price index | 170.0, September 2026 |
The line rose steadily until 2020, rose steeply in 2021 and 2022, when the annual rate peaked at 8.1% in June 2022, and has kept rising more slowly. In the fifteen months from March 2021 to June 2022 the index went from 139.6 to 152.9. Slower inflation lowers the rate at which the price level climbs but not the level itself.
The average household does not buy the average basket. Some components have risen much faster than others.
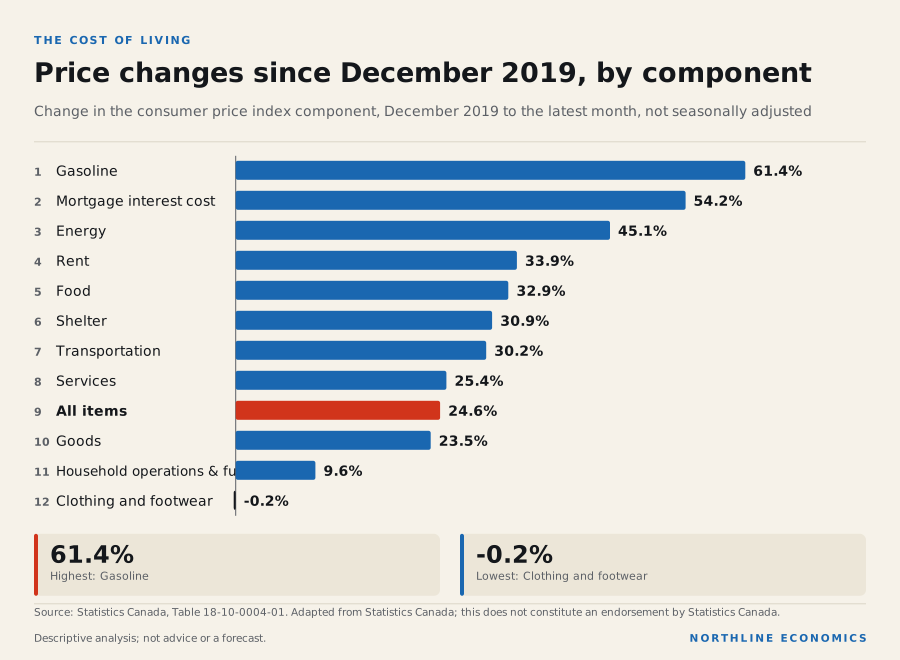
The data behind this graphic
| Item | Value |
|---|---|
| Gasoline | 61.4% |
| Mortgage interest cost | 54.2% |
| Energy | 45.1% |
| Rent | 33.9% |
| Food | 32.9% |
| Shelter | 30.9% |
| Transportation | 30.2% |
| Services | 25.4% |
| All items | 24.6% |
| Goods | 23.5% |
| Household operations and furnishings | 9.6% |
| Clothing and footwear | -0.2% |
Gasoline is up 61.4%, the largest increase of the components shown, followed by mortgage interest cost (54.2%), energy as a whole (45.1%), rent (33.9%) and food (32.9%). At the other end, household operations, furnishings and equipment are up 9.6% and clothing and footwear -0.2%; clothing prices are lower in December than in September, and against the same month seven years earlier they are 3.5% lower. Fuel, housing finance, rent and food are hard to avoid, and they have risen fastest.
For a household that rents, the rent increases since 2019 (33.9%) are a larger burden than the headline; for a homeowner who renewed a mortgage recently, the mortgage interest cost index (54.2%) is. The national average is 24.6% and describes neither. Services are up 25.4% and goods 23.5%: since December 2019 services prices have risen more than goods prices.
Do wages keep up?
Wages are the other side of the cost of living. Over three of the four horizons below, the real hourly wage has risen.
| Since | Average hourly wage | Consumer prices | Real hourly wage |
|---|---|---|---|
| January 2000 | 128.1% | 81.8% | 24.7% |
| January 2015 | 47.7% | 36.8% | 7.3% |
| December 2019 | 32.3% | 24.6% | 5.4% |
| January 2021 | 23.2% | 23.0% | -0.5% |
Percentage change to the latest month of each series. The wage series (October 2026) runs ahead of consumer prices (September 2026); the real hourly wage ends with prices, so it is the like-for-like comparison. Neither series is seasonally adjusted, so a row that starts in a different month of the year from the latest one also picks up seasonal movement.
Over the long term, pay has outpaced prices. Since January 2021 it has roughly kept pace: the real hourly wage has changed by -0.5%.
The comparison cuts two ways. A worker who has stayed in the same job will have seen pay rise more or less than the average, since the average wage is affected by who is employed. And output per hour has risen less than the real wage since 2019 (see the productivity section), so faster production does not account for all of the gain.
Why it happened
Crude oil, as measured by the West Texas Intermediate benchmark, averaged US$97.70 a barrel in October 2026, 62.3% more than a year earlier. Retail gasoline prices follow crude oil with refining margins, taxes and seasonal blends in between; over the whole history in the platform, year-over-year changes in the WTI price and in the gasoline CPI have moved closely together within the same month (correlation 0.87) and hardly at all a year apart (-0.03); the correlation edge in the explorer shows all four lags and is not a causal estimate.
Statistics Canada says gasoline and fuel oil drove the September acceleration. In September the Bank of Canada said the continuing conflict in the Middle East was keeping energy prices high. On 28 October it said inflation has been around 3% since April, which its Monetary Policy Report that day says largely reflects higher gasoline prices, and that inflation in its outlook is higher and more persistent than in the July Report. Taken together, and with the core measures above lower than the headline rate, these point to energy as the main source of the recent change in headline inflation. That is this report's reading of separate statements: neither institution says energy explains all of inflation, and neither gives a duration for the energy move.
Evidence: relationship: Middle East conflict and disrupted energy shipping (2026) and World oil price (WTI); relationship: World oil price (WTI) and Consumer energy and gasoline prices; relationship: Consumer energy and gasoline prices and Consumer price inflation; Bank of Canada: Monetary Policy Report, October 2026: Current conditions; Bank of Canada: Bank of Canada raises the policy rate by 25 basis points to 2½% (28 October 2026); Bank of Canada: Bank of Canada maintains the policy rate (2 September 2026); Statistics Canada: The Daily: Consumer Price Index, September 2026
Goods and services inflation
Percent change from a year earlier (derived).
Chart loads when it comes into view.
Latest values: Goods 3.7 (2026-09); Services 2.56 (2026-09).
Why it matters
Inflation changes what a given income can buy and what borrowers pay. The average hourly wage is up 32.3% since December 2019 (to October 2026) while consumer prices are up 24.6% (to September 2026). Deflating the average wage by the CPI gives a real hourly wage of C$22.14 an hour in September 2026 (in 2002 dollars): its change is 5.4% since December 2019, -0.7% over the past year and -0.5% since January 2021. Put plainly, the purchasing power of the average hourly wage is about where it was in early 2021. The real wage peaked over this decade at C$22.95 an hour in April 2020, coinciding with the pandemic lockdowns. Because the average wage is not adjusted for the mix of jobs, a change in who was employed can move it without any change in anyone's pay; this report does not test that explanation.
Average hourly wage, selected industries
Current dollars per hour, employees aged 15 and over, not seasonally adjusted (Labour Force Survey).
Chart loads when it comes into view.
Latest values: All industries 37.89 (2026-10); Goods-producing 39.17 (2026-10); Services-producing 37.57 (2026-10); Forestry, fishing, mining, oil and gas 52.5 (2026-10); and 3 more in the data table.
Related relationships: Wages
Inflation is the target of monetary policy, which affects the cost of borrowing (see the next section). Shelter inflation of 1.8% combines a mortgage interest cost index changing by -0.2% with rents rising 2.8%: renters and homeowners with mortgages are experiencing different inflation.
Shelter costs: rent and mortgage interest
Percent change from a year earlier (derived). Mortgage interest cost responds to the policy rate with a lag set by mortgage renewal timing.
Chart loads when it comes into view.
Latest values: Rent 2.8 (2026-09); Mortgage interest cost -0.16 (2026-09); Shelter (all) 1.75 (2026-09).
Related relationships: 2 relationships use this data as evidence
History
Over the past ten years inflation reached a maximum of 8.1% in June 2022, a minimum of -0.4% in May 2020 and averaged 2.7%. The mortgage interest cost index rose 60.8% between January 2021 and now and its annual growth peaked at 30.9% in August 2023. Prices overall are 24.6% higher than at the end of 2019, and slower inflation does not lower the price level, it only slows its rise.
Across geographies
Year-over-year inflation was highest of the ten provinces in Prince Edward Island (5.7%; 1st of 10 provinces) and Nova Scotia (5.6%) and lowest in Ontario (2.5%; 10th of 10); Alberta was at 3.6% and Quebec at 3.1%. Among the six largest metropolitan areas the range runs from 2.1% in Toronto to 3.5% in Edmonton (3.4% in Calgary, 3.0% in Vancouver and 3.0% in Montréal; the Ottawa–Gatineau series covers the Ontario part only, at 3.0%).
Consumer price inflation by province
12-month change in the all-items CPI (derived by this project from the index).
Chart loads when it comes into view.
Latest values: Alberta 3.6 (2026-09); British Columbia 2.96 (2026-09); Saskatchewan 3.3 (2026-09); Manitoba 4.36 (2026-09); and 6 more in the data table.
Related relationships: Alberta · British Columbia · Saskatchewan · Manitoba
Consumer price inflation by city
12-month change in the all-items CPI (derived). Ottawa–Gatineau is the Ontario part only.
Chart loads when it comes into view.
Latest values: Calgary 3.36 (2026-09); Edmonton 3.52 (2026-09); Toronto 2.08 (2026-09); Vancouver 3.03 (2026-09); and 2 more in the data table.
Related relationships: Calgary · Edmonton · Toronto · Vancouver
Statistics Canada noted that five provinces saw faster increases than in August, mainly because of gasoline and fuel oil, that the fuel oil increase had a greater impact in Atlantic Canada, where fuel oil is more widely used, and that, excluding energy, inflation was highest in Nova Scotia.
Evidence: Statistics Canada: The Daily: Consumer Price Index, September 2026
Inflation has risen in the other large advanced economies too: 3.7% in the United States, 4.0% in the euro area (October 2026) and 3.5% in the United Kingdom, against 3.1% in Canada, all September 2026 except the euro area. In the United States, the euro area and Canada the rise began in March, when the Brent crude price went from US$71.10 in February to US$103.70; the United Kingdom's rate was 3.0% in February and 2.6% in June before rising again (see the Global report). The definitions of the indexes differ, so compare direction and timing rather than decimals.
What it influences
Inflation is one input to the policy rate decisions described in the next section. The Bank of Canada describes the policy rate as its main tool for returning inflation to target. That tariffs could pass through to consumer prices and that wages respond to inflation with a lag are hypotheses; neither is measured in these data.
Risks
In September the Bank of Canada said the upside risks to its inflation forecast had increased, that there had been little progress reopening the Strait of Hormuz, and that tariffs would raise costs for some businesses and could pass through to consumer prices over time. On 28 October it said CPI inflation is expected to rise to about 3½% by the end of the year. A reversal of energy prices would lower headline inflation mechanically; the opposite would raise it. This report does not forecast energy prices.
Evidence: Bank of Canada: Bank of Canada raises the policy rate by 25 basis points to 2½% (28 October 2026); Bank of Canada: Bank of Canada maintains the policy rate (2 September 2026)
What it means for decisions
For a household. The cost of living is a collection of different price increases. Fuel, rent, mortgage interest and food have risen the fastest, and they are the ones with the least room for substitution. Those who rent or who have recently renewed a mortgage have seen more inflation than the national figure.
For a business that sets prices. Wage growth (2.2% in October 2026) is below inflation (3.1% in September 2026), which reduces cost pressure from labour, but unit labour costs are 26.2% higher than at the end of 2019. Energy is the main source of the latest rise in headline inflation, and costs that depend on fuel are the exposed ones.
For a lender or a policymaker. The core measures, at 1.8% and 1.9%, are near the target while headline inflation is 3.1%. On 28 October the Bank of Canada raised its rate to reduce the risk that continuing high energy prices spread broadly to other prices. The watch list is core inflation and services prices.
Evidence: Bank of Canada: Bank of Canada raises the policy rate by 25 basis points to 2½% (28 October 2026)
For an investor. The distinction between a price level and an inflation rate matters for anything with a fixed nominal income. A bond coupon or a lease with a fixed rent buys about a fifth less than it did at the end of 2019, even if inflation stopped today.
What the data cannot say. The CPI measures a fixed basket of goods and services bought by an average household. It does not include home purchase prices, only the cost of owning a home through mortgage interest and similar costs. Nothing here is a forecast.
What to watch
The next consumer price release is for October, on 16 November 2026 (see the release calendar), followed by the Bank of Canada's next policy announcement on 9 December 2026. Watch whether gasoline inflation eases with the winter-blend switch, whether the core measures stay close to the target, and whether services inflation continues to run below goods inflation.
Prepared with AI assistance.
Follow the relationships
- Consumer price inflation 1 with evidence · 1 recorded Open in Studio
- Consumer energy and gasoline prices 3 with evidence · 3 recorded Open in Studio
- World oil price (WTI) 16 with evidence · 16 recorded Open in Studio
- Middle East conflict and disrupted energy shipping (2026) 1 with evidence · 1 recorded Open in Studio
Upcoming releases
- 2026-11-16 Consumer Price Index October 2026 · Statistics Canada
Sources for this section (8 datasets, 5 documents)
Data
- Consumer Price Index, monthly, not seasonally adjusted (18-10-0004-01; 30 series; latest September 2026; retrieved 2026-10-23)
- Consumer Price Index (CPI) statistics, measures of core inflation and other related statistics - Bank of Canada definitions (18-10-0256-01; 3 series; latest September 2026; retrieved 2026-10-23)
- Employee wages by industry, monthly, unadjusted for seasonality (14-10-0063-01; 3 series; latest October 2026; retrieved 2026-11-07)
- Crude oil, WTI, monthly average price (Pink Sheet (monthly prices); 2 series; latest October 2026; retrieved 2026-11-05)
- US CPI-U, 12-month change (BLS CUUR0000SA0; 1 series; latest September 2026; retrieved 2026-11-05)
- Consumer prices, harmonised index (HICP), annual rate of change: Euro area (EA11-1999, EA12-2001, EA13-2007, EA15-2008, EA16-2009, EA17-2011, EA18-2014, EA19-2015, EA20-2023, EA21-2026) (Eurostat prc_hicp_minr; 1 series; latest October 2026; retrieved 2026-11-05)
- UK CPI, 12-month rate (ONS MM23 / D7G7; 1 series; latest September 2026; retrieved 2026-11-05)
- Indexes of business sector labour productivity, unit labour cost and related measures, seasonally adjusted (36-10-0206-01; 1 series; latest Q2 2026; retrieved 2026-10-23)
Documents cited
- Statistics Canada: The Daily: Consumer Price Index, September 2026 (retrieved 2026-11-07)
- Bank of Canada: Monetary Policy Report, October 2026: Current conditions (retrieved 2026-11-07)
- Bank of Canada: Bank of Canada raises the policy rate by 25 basis points to 2½% (28 October 2026) (retrieved 2026-11-07)
- Bank of Canada: Bank of Canada maintains the policy rate (2 September 2026) (retrieved 2026-10-22)
- Bank of Canada: Tiff Macklem, Governor: Monetary policy at work, remarks to CFA Québec (7 February 2023) (retrieved 2026-11-07)
Each dataset is used under its licence; attribution and series-level detail are in each chart’s “About this data” panel. Limitations: CPI measures price change for a fixed basket; an individual household's inflation differs with its spending. Core measures are statistical indicators of underlying inflation, not a separate price index. Provincial and city CPI are indexes with different local baskets. The real wage uses the national CPI and the Labour Force Survey average wage, which is affected by changes in the mix of jobs. The consumer price index, its components and the average wage are not seasonally adjusted, so a change measured from December 2019 or January 2021 to the latest month also picks up seasonal movement: little for the all-items index, more for components such as clothing, whose prices are lower in December than in September.
How are interest rates reaching households and the budget, and where in the economy are they felt first?
The Bank of Canada raised its policy rate to 2.50% on 28 October, its first increase since July 2023, while the ten-year yield rose 0.52 percentage points over the past year
Graphic: From the overnight target to the posted mortgage rate
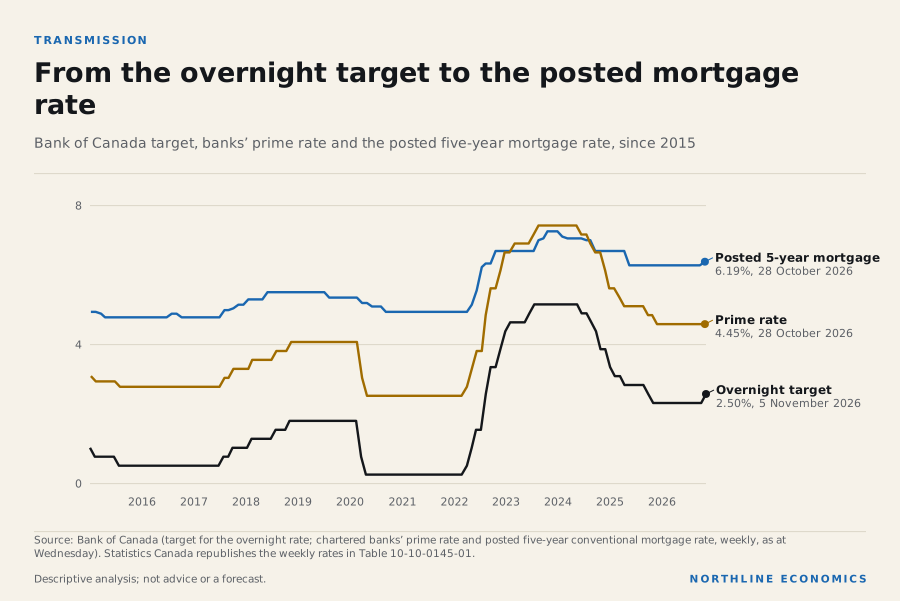
What happened
The Bank of Canada's target for the overnight rate was 2.50% on 5 November 2026, after the Bank raised it on 28 October by 25 basis points; the net change over the past 250 business days is 0.25 percentage points, and the rate had not changed from the last cut, effective 30 October 2025, until that increase. Government of Canada benchmark yields are higher at longer maturities: 3.17% at two years, 3.39% at five, 3.67% at ten and 4.02% for the long bond. Over the past year the two-year yield rose 0.74 percentage points and the ten-year yield rose 0.52 percentage points, while the policy rate moved only at the end of the period.
Government of Canada benchmark bond yields
Percent, daily (Bank of Canada).
Chart loads when it comes into view.
Latest values: 2-year 3.17 (2026-11-05); 5-year 3.39 (2026-11-05); 10-year 3.67 (2026-11-05); Long-term 4.02 (2026-11-05).
Related relationships: Government of Canada bond yields · 5 relationships use this data as evidence
At its 28 October announcement the Bank increased the policy rate by 25 basis points. It said that in its outlook inflation is higher and more persistent than in the July Report, that CPI inflation has been around 3% since April and is expected to rise to about 3½% by the end of the year, and that it decided to increase the policy rate to reduce the risk that continuing high energy prices spread broadly to the prices of other goods and services. It added that there could be a need to increase the policy rate further but that Governing Council agreed to proceed carefully. The next announcement is scheduled for 9 December 2026.
Evidence: Bank of Canada: Bank of Canada raises the policy rate by 25 basis points to 2½% (28 October 2026)
The slope of the yield curve (ten-year minus two-year) is 0.5 percentage points, a normal upward slope. It reached -1.3 percentage points on 30 June 2023, when short rates were above long rates.
Slope of the yield curve
Ten-year minus two-year benchmark yield, percentage points (derived). Below zero is an inverted curve.
Chart loads when it comes into view.
Latest values: 10-year minus 2-year 0.5 (2026-11-05).
Where the rate cycle left borrowing costs
A rate cycle is easiest to see in a table of dates. The table gives the policy rate, the prime rate that banks charge their best customers, the five-year posted mortgage rate and the two government bond yields at five dates and at the latest reading. Each dated row is the first reading of that month.
| Date | Policy rate | Prime | Five-year posted mortgage | Two-year yield | Ten-year yield |
|---|---|---|---|---|---|
| January 2020 | 1.75% | 3.95% | 5.19% | 1.66% | 1.62% |
| December 2021 | 0.25% | 2.45% | 4.79% | 0.95% | 1.50% |
| July 2023 | 4.75% | 6.95% | 6.49% | 4.63% | 3.32% |
| January 2025 | 3.25% | 5.45% | 6.49% | 2.93% | 3.22% |
| December 2025 | 2.25% | 4.45% | 6.09% | 2.48% | 3.24% |
| Latest (prime and mortgage: 28 October 2026) | 2.50% | 4.45% | 6.19% | 3.17% | 3.67% |
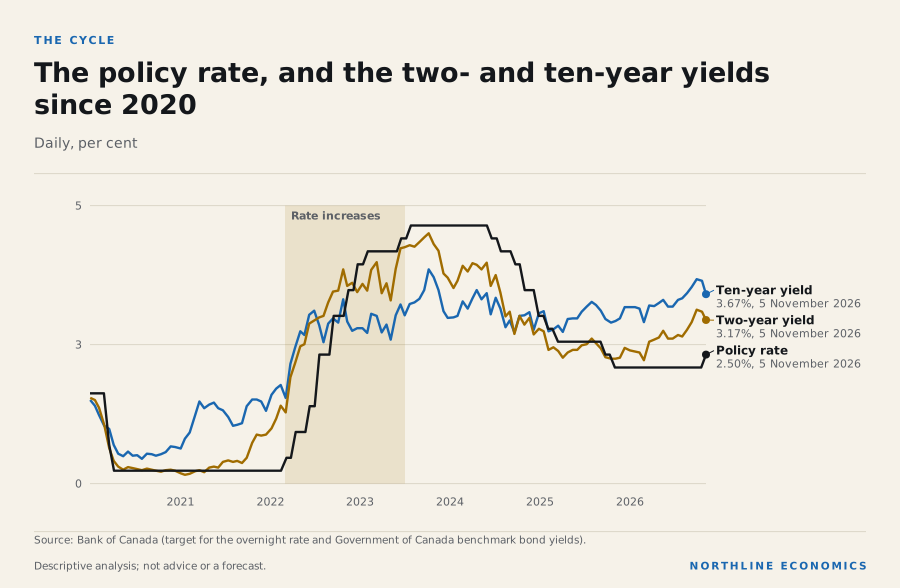
The data behind this graphic
| Series | Latest |
|---|---|
| Ten-year yield | 3.67%, 5 November 2026 |
| Two-year yield | 3.17%, 5 November 2026 |
| Policy rate | 2.50%, 5 November 2026 |
Three things follow from the table. First, the policy rate rose from 0.25% to 5.00% and was cut back and then raised by a quarter point on 28 October, and is now 2.50%, which is above where it began. Second, the five-year posted mortgage rate moved far less than the policy rate on the way down: it is 6.19%, against a peak of 7.04%, although the policy rate is half its peak. Third, the ten-year yield is 3.67%, higher than the 3.24% of 1 December 2025, so the market rates that fixed mortgages follow rose for most of the past year while the overnight rate stayed where it was. The weekly prime and posted-mortgage series end on 28 October 2026, while the policy rate and the yields run to 5 November 2026.
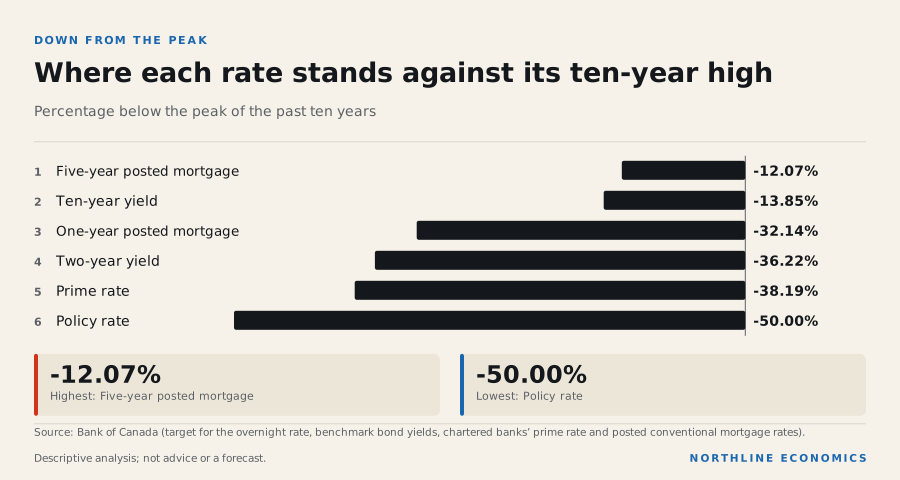
The data behind this graphic
| Item | Value |
|---|---|
| Five-year posted mortgage | -12.07% |
| Ten-year yield | -13.85% |
| One-year posted mortgage | -32.14% |
| Two-year yield | -36.22% |
| Prime rate | -38.19% |
| Policy rate | -50.00% |
The chart shows the same point as a distance from each rate’s ten-year high. The policy rate is furthest below its high. The prime rate, the two-year yield and the one-year mortgage rate come next, because they follow or anticipate the Bank’s decisions most closely; the prime rate shown is the weekly reading of 28 October 2026. The ten-year yield and the five-year mortgage rate are much closer to theirs. A household with a variable-rate mortgage tied to prime has seen relief. A household with a fixed-rate mortgage renewing now faces the five-year rate, and that has come down only a little.
The comparison with other central banks
Canada’s policy rate is below the US rate and level with the ECB’s deposit rate.
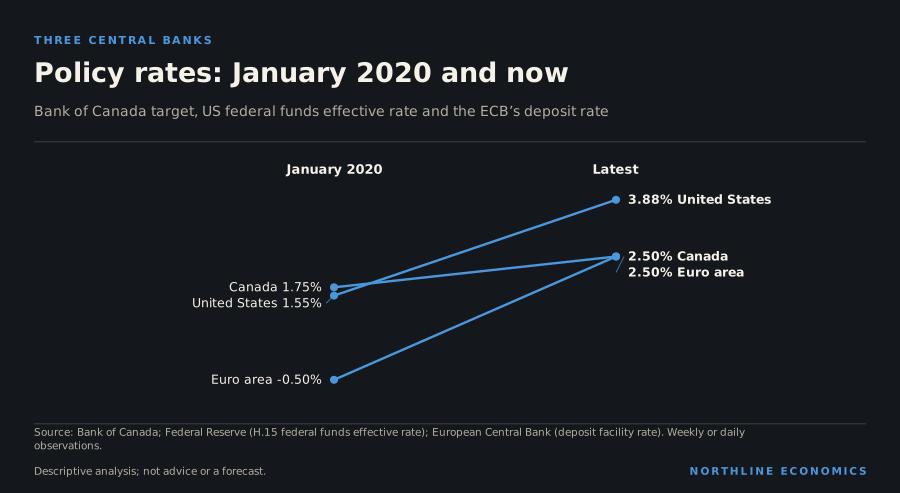
The data behind this graphic
| Item | January 2020 | Latest |
|---|---|---|
| Canada | 1.75% | 2.50% |
| United States | 1.55% | 3.88% |
| Euro area | -0.50% | 2.50% |
Canada’s overnight rate is 2.50% against 1.75% in January 2020, while the US federal funds rate is 3.88% (from 1.55%) and the ECB’s deposit rate 2.50% (from -0.50%). All three central banks raised rates sharply in 2022 and 2023 and have since cut them, and all three have raised them again in 2026, the Bank of Canada last, on 28 October. The US rate is the highest; Canada’s and the ECB’s are level. The gap between the US and Canadian rates was small at the peak (5.33% against 5.00%) and has widened since, because the Bank of Canada has cut by more.
Why it happened
The Bank sets only the overnight rate. Longer yields are determined in bond markets rather than by the Bank, so they can move without any change in the policy rate (in standard terms they reflect expected future policy rates, inflation expectations and risk premiums, which this report does not measure). That was the pattern for most of the past year, until the Bank raised the overnight rate on 28 October.
The Bank's October report says global financial conditions have tightened since the July Report and that sovereign bond yields have risen across advanced economies, reflecting higher expected policy interest rates and higher term premiums. It says yields in Canada have also increased but by less than in the United States. This report does not measure those parts.
Evidence: Bank of Canada: Monetary Policy Report, October 2026: Current conditions
On 28 October 2026, before any response to the increase, posted conventional mortgage rates were 5.49% for one year and 6.19% for five years, against a prime rate of 4.45%. The five-year posted rate changed by -0.85 percentage points over three years and remains well above its ten-year low of 4.64%.
The policy rate, prime and posted mortgage rates
Percent. Posted conventional mortgage rates are not the rates most borrowers pay after negotiation; they track the direction of borrowing costs.
Chart loads when it comes into view.
Latest values: Policy rate 2.5 (2026-11-05); Prime rate 4.45 (2026-10-28); 1-year mortgage (posted) 5.49 (2026-10-28); 5-year mortgage (posted) 6.19 (2026-10-28).
Related relationships: Bank of Canada policy rate · Prime and posted mortgage rates · 10 relationships use this data as evidence
Why it matters
The Bank of Canada describes how a rate change reaches households: banks reprice loans and deposits, higher interest costs discourage borrowing, rate-sensitive sectors such as housing often slow first, and the full effects on spending and inflation take up to about two years. A Bank staff note identifies mortgage payments as a channel for household spending. The effect on any household depends on whether its mortgage is variable or fixed and when it renews.
Evidence: relationship: Bank of Canada policy rate and Prime and posted mortgage rates; relationship: Bank of Canada policy rate and Household mortgage debt-servicing costs; relationship: Household mortgage debt-servicing costs and Housing demand; Bank of Canada: Tiff Macklem, Governor: Monetary policy at work, remarks to CFA Québec (7 February 2023); Bank of Canada: Bounajm and McWhirter, Modelling Canadian mortgage debt and payments in a semi-structural model (Staff Analytical Note 2024-1)
The data are consistent with that chain in the aggregate. The mortgage interest cost component of the CPI has risen 60.8% since January 2021 (the Bank describes renewals at higher rates as one way increases reach households), and is now changing by -0.2% a year, having peaked at 30.9% in August 2023. Household credit market debt stands at 176.4% of disposable income, down 1.0 percentage points from a year ago and below the 188.2% reached in Q3 2022; the narrower mortgage and consumer-credit measure is 168.0%.
Household debt relative to income
Percent of household disposable income, quarterly. “Mortgage and consumer credit” is the narrower measure.
Chart loads when it comes into view.
Latest values: All credit market debt 176.4 (2026 Q2); Mortgage and consumer credit 168 (2026 Q2).
Related relationships: Household mortgage debt-servicing costs · 1 relationship use this data as evidence
Statistics Canada reported that the ratio fell in the second quarter because income grew at over twice the pace of debt, that the household debt service ratio declined to 14.52% from a peak of 15.16% in the first quarter of 2023, and that mortgage borrowing fell for a second consecutive quarter to its slowest pace since early 2024.
The federal government pays too: federal interest expense is C$13.9 billion a quarter, up from C$5.5 billion in the first quarter of 2021.
Federal interest expense (4-quarter total)
C$ billions: what the federal government pays to carry its debt.
Chart loads when it comes into view.
Latest values: Federal interest expense 52.18 (2026 Q2).
Related relationships: Government finances · 1 relationship use this data as evidence
History
The policy rate rose from 0.25% at the start of 2022 to a peak of 5.00% on 13 July 2023 and has since been lowered and, on 28 October 2026, raised again to 2.50%. The ten-year yield peaked at 4.26% on 3 October 2023 and is now 3.67%.
In the explorer, 12-month changes in the policy rate and in the posted five-year mortgage rate are correlated at lag zero (r = 0.86), with the association fading at a 12-month lag (r = 0.22), which is what posted rates following the policy rate quickly would look like. The association with the CPI mortgage interest cost grows with the lag (r = 0.46 at lag zero and 0.76 at twelve months), which is what slow pass-through through mortgage renewals would look like. The Bank of Canada staff note cited models Canada's mortgage debt structure and said in 2024 that the impact of the tightening that began in early 2022 would continue to materialize gradually. These are descriptive associations of overlapping 12-month changes, not estimates of causal effects.
Evidence: relationship: Bank of Canada policy rate and Prime and posted mortgage rates; relationship: Bank of Canada policy rate and Household mortgage debt-servicing costs; Bank of Canada: Bounajm and McWhirter, Modelling Canadian mortgage debt and payments in a semi-structural model (Staff Analytical Note 2024-1)
Across geographies
Interest rates are national, but their effects are local. Provincial and city housing, construction and household-debt data are not published on a basis that lets this report compare the rate sensitivity of regions; the housing section shows construction and prices by city. Not assessed: regional differences in mortgage structure, renewal timing and debt-service burdens, which require data (such as Bank of Canada or CMHC regional mortgage data) that this report does not hold.
Since January 2026 the US federal funds effective rate has gone from 3.64% to 3.88% (average of the latest week) and the ECB's deposit rate from 2.00% to 2.50%, while Canada's overnight rate went from 2.25% to 2.50%. The US ten-year Treasury yield, 4.84%, is 1.17 percentage points above Canada's; twelve-month changes in the two yields have a correlation of 0.94 (a statistical association, not a causal estimate). The Global report sets out the central banks and the bond markets.
What it influences
Interest rates reach housing demand and construction, household spending, business investment, the exchange rate and the federal interest bill. The Bank of Canada's own descriptions link the policy rate to mortgage rates, mortgage costs, household spending and inflation. The explorer records weaker links (rates to residential investment, rates to new housing prices) as observed correlations: -0.30 between rate changes and housing-start growth at a three-month lag, -0.47 with residential building investment at six months and -0.34 with new housing prices at twelve months. All four lags are shown on each edge and none of these is an estimated effect.
Investment in new building construction
Value of new residential and non-residential construction put in place, current dollars, not seasonally adjusted: 12-month change (derived).
Chart loads when it comes into view.
Latest values: Residential -1.09 (2026-08); Non-residential 10.26 (2026-08); Total 2.22 (2026-08).
Related relationships: 1 relationship use this data as evidence
Risks
The Bank said that, owing to new US tariffs, growth is expected to slow in the fourth quarter of 2026, before picking up again in 2027, and that there could be a need to increase the policy rate further, but given uncertainties, Governing Council agreed to proceed carefully. In this report's reading (not a statement of the Bank's), the risks it lists could argue for tighter policy if inflation proves persistent and for looser policy if growth weakens. This report makes no forecast of the policy rate.
Evidence: Bank of Canada: Bank of Canada raises the policy rate by 25 basis points to 2½% (28 October 2026)
What it means for decisions
For a homeowner with a mortgage. The relevant rate is the one at renewal, not the policy rate. The five-year posted rate is 6.19%, against 4.79% at the end of 2021. A borrower who locked in in 2020 or 2021 will renew at a higher rate; the Bank of Canada’s estimate of the payment increase is in the financial-vulnerability section. A borrower with a variable-rate mortgage has seen interest costs fall as the policy rate came down, and may see them rise again with the 28 October increase.
For a business that borrows. Prime was 4.45% on 28 October 2026, before any response to the increase, down from 7.20% at the peak. Longer-term borrowing, which follows bond yields, has not eased by as much. A firm financing long-lived assets faces a ten-year yield of 3.67%.
For a saver or an investor. The yield curve slopes upward again (ten-year yield above two-year), which is the normal shape. Returns on short-term deposits and cash follow the policy rate, which the Bank raised on 28 October.
For a policymaker. The Department of Finance attributes the rise in public debt charges in April to August 2026, against the same months of 2025, mainly to an increased stock of marketable bonds with higher average effective interest rates, partly tempered by lower short-term interest rates on treasury bills. This report reads that as the federal interest bill following yields on the debt issued more than it follows the policy rate. A bond yield that rises, or a policy rate that is raised, makes the bill harder to bring down.
Evidence: relationship: Government of Canada bond yields and Government finances; Department of Finance Canada: The Fiscal Monitor, August 2026
What the data cannot say. Posted rates are published rates, not the discounted rates most borrowers obtain. The series show market rates and not the distribution of mortgage rates across all outstanding loans, which depends on when each was written. Nothing here is a forecast of rates.
What to watch
The Bank of Canada's next announcement on 9 December 2026, the weekly prime and mortgage-rate postings (do they follow the 28 October increase?), the ten-year yield (how does it move after the increase?), the household debt service ratio for the third quarter, and mortgage-renewal commentary in the Bank's reports.
Prepared with AI assistance.
Follow the relationships
- Bank of Canada policy rate 8 with evidence · 8 recorded Open in Studio
- Government of Canada bond yields 5 with evidence · 5 recorded Open in Studio
- Prime and posted mortgage rates 4 with evidence · 4 recorded Open in Studio
- Household mortgage debt-servicing costs 4 with evidence · 4 recorded Open in Studio
- Household spending 1 with evidence · 1 recorded Open in Studio
Upcoming releases
- 2026-12-09 Bank of Canada interest rate announcement · Bank of Canada
- 2027-01-27 Bank of Canada interest rate announcement and Monetary Policy Report · Bank of Canada
Sources for this section (13 datasets, 6 documents)
Data
- Bank of Canada target for the overnight rate (business daily) (V39079; 1 series; latest 5 November 2026; retrieved 2026-11-07)
- Government of Canada benchmark bond yield, 2-year (BD.CDN.2YR.DQ.YLD; 1 series; latest 5 November 2026; retrieved 2026-11-07)
- Government of Canada benchmark bond yield, 5-year (BD.CDN.5YR.DQ.YLD; 1 series; latest 5 November 2026; retrieved 2026-11-07)
- Government of Canada benchmark bond yield, 10-year (BD.CDN.10YR.DQ.YLD; 2 series; latest 5 November 2026; retrieved 2026-11-07)
- Government of Canada benchmark bond yield, long-term (BD.CDN.LONG.DQ.YLD; 1 series; latest 5 November 2026; retrieved 2026-11-07)
- Chartered banks prime business rate (V80691311; 1 series; latest 28 October 2026; retrieved 2026-11-03)
- Conventional 5-year mortgage rate (posted) (V80691335; 1 series; latest 28 October 2026; retrieved 2026-11-03)
- US federal funds effective rate, weekly average (Federal Reserve statistical release H.15; 3 series; latest 4 November 2026; retrieved 2026-11-07)
- ECB deposit facility rate (ECB FM; 1 series; latest 7 November 2026; retrieved 2026-11-07)
- Conventional 1-year mortgage rate (posted) (V80691333; 1 series; latest 28 October 2026; retrieved 2026-11-03)
- Consumer Price Index, monthly, not seasonally adjusted (18-10-0004-01; 2 series; latest September 2026; retrieved 2026-10-23)
- Household sector credit market summary table, seasonally adjusted estimates (38-10-0238-01; 2 series; latest Q2 2026; retrieved 2026-10-23)
- Statement of government operations and balance sheet, government finance statistics, quarterly (10-10-0015-01; 1 series; latest Q2 2026; retrieved 2026-10-23)
Documents cited
- Bank of Canada: Bank of Canada raises the policy rate by 25 basis points to 2½% (28 October 2026) (retrieved 2026-11-07)
- Bank of Canada: Monetary Policy Report, October 2026: Current conditions (retrieved 2026-11-07)
- Bank of Canada: Tiff Macklem, Governor: Monetary policy at work, remarks to CFA Québec (7 February 2023) (retrieved 2026-11-07)
- Bank of Canada: Bounajm and McWhirter, Modelling Canadian mortgage debt and payments in a semi-structural model (Staff Analytical Note 2024-1) (retrieved 2026-11-07)
- Statistics Canada: The Daily: National balance sheet and financial flow accounts, second quarter 2026 (retrieved 2026-10-22)
- Department of Finance Canada: The Fiscal Monitor, August 2026 (retrieved 2026-11-07)
Each dataset is used under its licence; attribution and series-level detail are in each chart’s “About this data” panel. Limitations: Posted conventional mortgage rates are published rates, not the discounted rates most borrowers obtain, and they move less often than market rates. The correlations quoted are descriptive associations of 12-month changes at fixed lags and are not causal estimates. Yields are end-of-day benchmarks. Household debt ratios are quarterly and revised.
Are Canadian households still spending, and does it differ across provinces?
Real household spending in Q2 2026 was up 1.9% on a year earlier, and in the year to August 2026 retail sales rose in all ten provinces but at very different rates
Graphic: Spending outgrew the population; output per person did not
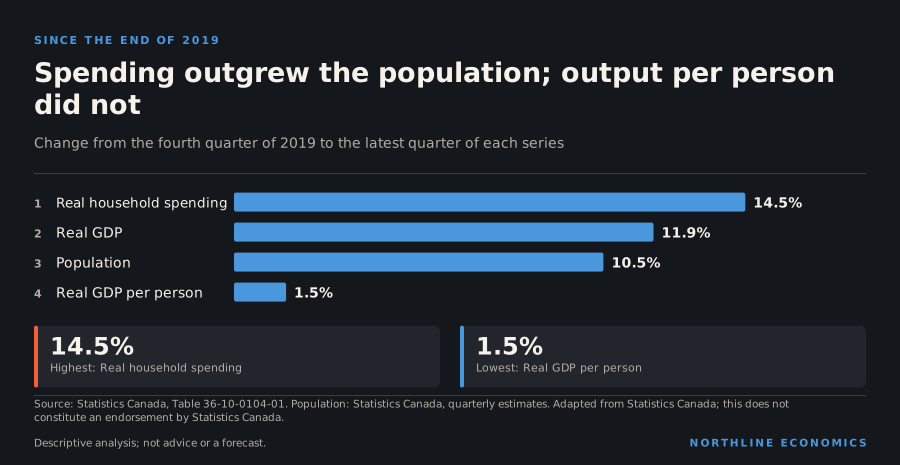
What happened
Real household final consumption expenditure was C$1.45 trillion at an annual rate in Q2 2026, 1.9% higher than a year earlier. Total final domestic demand, which adds business and government spending, was C$2.58 trillion at an annual rate.
Real household spending and real GDP, 12-month change
Percent change from the same quarter a year earlier, chained 2017 dollars (derived by this project from the quarterly levels).
Chart loads when it comes into view.
Latest values: Household consumption 1.94 (2026 Q2); Real GDP 1.13 (2026 Q2).
Related relationships: 1 relationship use this data as evidence
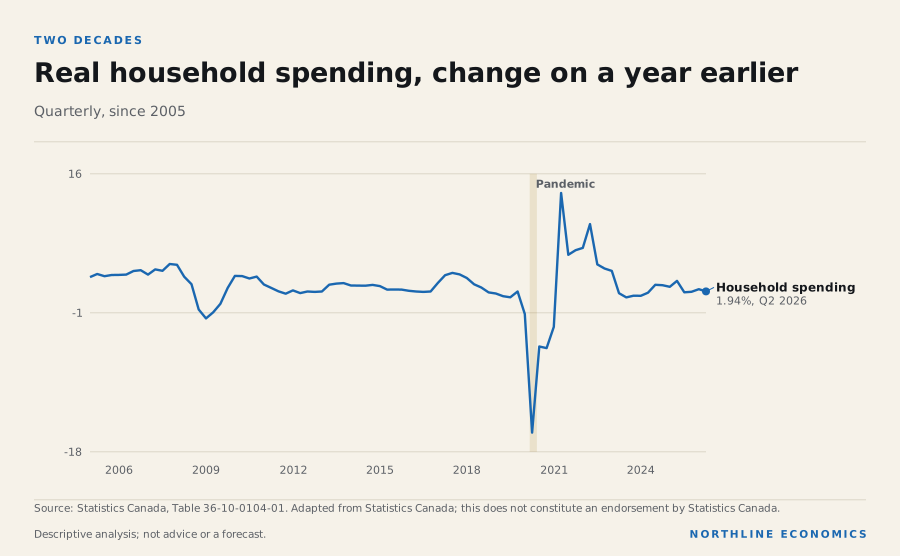
The data behind this graphic
| Series | Latest |
|---|---|
| Household spending | 1.94%, Q2 2026 |
The long run puts the latest figure in context. Real household spending has grown 2.3% a year on average over the past ten years. In the latest quarter the pace was 1.9%, below that average but not far from it. The extremes of the series show how unusual the pandemic was: spending fell 15.2% in the year to Q2 2020 and rose 13.9% in the year to Q2 2021.
Retail sales are published monthly by province. In August 2026 they changed from a year earlier by 7.6% in Alberta, 6.4% in Ontario, 2.2% in Quebec and 3.7% in British Columbia. By monthly sales, counting the three territories, Alberta ranks 4th of 13 and British Columbia 3rd of 13. These are current-dollar sales, so part of every figure is price change.
Retail sales by province, indexed
Seasonally adjusted; start of period = 100.
Chart loads when it comes into view.
Latest values: Alberta 9,649,000,000 (2026-08); British Columbia 9,970,000,000 (2026-08); Saskatchewan 2,315,000,000 (2026-08); Manitoba 2,530,000,000 (2026-08); and 6 more in the data table.
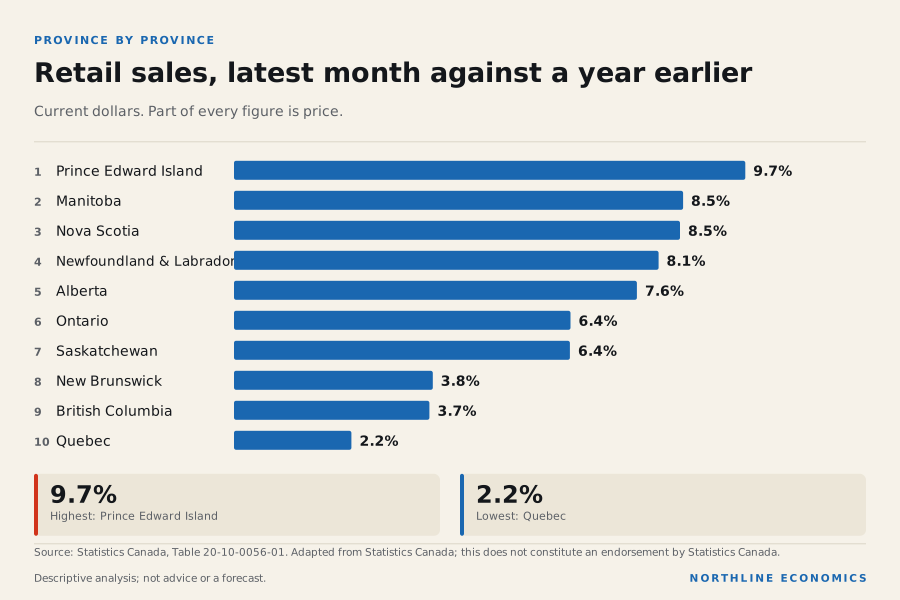
The data behind this graphic
| Item | Value |
|---|---|
| Prince Edward Island | 9.7% |
| Manitoba | 8.5% |
| Nova Scotia | 8.5% |
| Newfoundland & Labrador | 8.1% |
| Alberta | 7.6% |
| Ontario | 6.4% |
| Saskatchewan | 6.4% |
| New Brunswick | 3.8% |
| British Columbia | 3.7% |
| Quebec | 2.2% |
In the latest month retail sales were higher than a year earlier in all ten provinces. The fastest growth was in Prince Edward Island (9.7%), Manitoba (8.5%) and Nova Scotia (8.5%); the slowest in Quebec (2.2%), British Columbia (3.7%) and New Brunswick (3.8%). Prince Edward Island is a small market where a few large stores or one price change can move the figure.
A single month against its year-earlier month can mislead, so it helps to take the longer view.
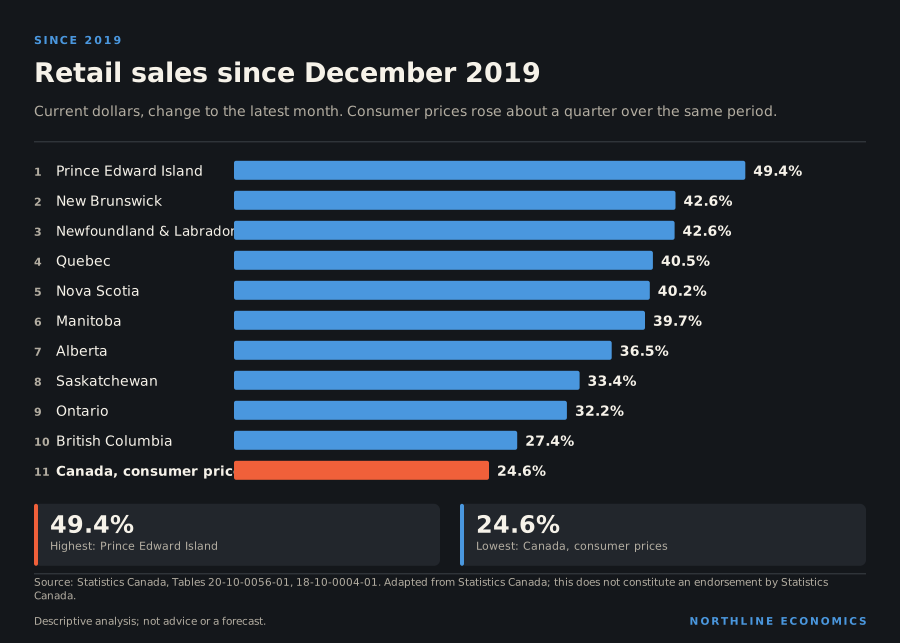
The data behind this graphic
| Item | Value |
|---|---|
| Prince Edward Island | 49.4% |
| New Brunswick | 42.6% |
| Newfoundland & Labrador | 42.6% |
| Quebec | 40.5% |
| Nova Scotia | 40.2% |
| Manitoba | 39.7% |
| Alberta | 36.5% |
| Saskatchewan | 33.4% |
| Ontario | 32.2% |
| British Columbia | 27.4% |
| Canada, consumer prices | 24.6% |
From December 2019 to August 2026, retail sales in current dollars are up 49.4% in Prince Edward Island and 42.6% in New Brunswick, and up 27.4% in British Columbia, the lowest of the ten. Consumer prices rose 24.6% from December 2019 to September 2026. Every province’s sales are above that, but British Columbia’s only just: after allowing roughly for prices, British Columbia’s retail sales have grown the least. That is a statement about current-dollar sales and the national price index. Provincial price indexes differ and are not used here, and the data cannot separate more shoppers, higher prices and changed buying habits such as online purchasing.
Average weekly earnings were C$1,355 a week in August 2026, 3.8% higher than a year earlier; consumer prices in the same month were 3.0% higher than a year earlier. Earnings and the CPI are different surveys with different coverage, so the gap between them is a rough guide and not a measure of purchasing power.
Over the longer term, average weekly earnings, which are not seasonally adjusted, are up 31.8% on the same month seven years earlier, from C$1,028 a week to C$1,355 a week. The CPI rose 24.8% in the seven years to September 2026, so nominal pay has risen faster than prices over the period. Earnings include the effect of changes in the mix of jobs and hours, so they are not a measure of the pay of a typical worker.
Spending, people and output
The headline spending figures do not say who is doing the spending, and one of the largest changes in the past six years is how many people there are. Since the end of 2019 the population is up 10.5% to 41.8 million on 1 July 2026. Real household spending is up 14.5% to Q2 2026, so it has grown faster than the population, but not by much. Real GDP is up 11.9%, which is only just above population growth. Real GDP per person is therefore up 1.5% over six and a half years.
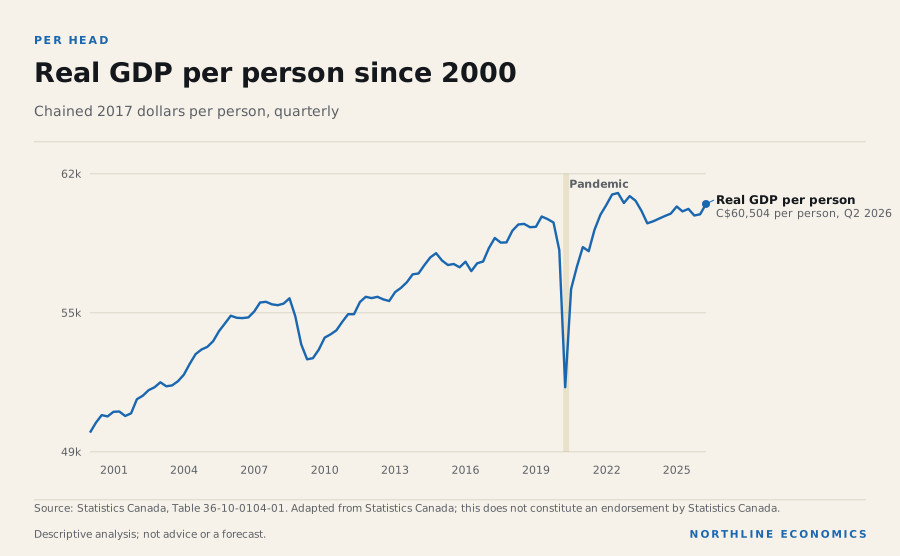
The data behind this graphic
| Series | Latest |
|---|---|
| Real GDP per person | C$60,504 per person, Q2 2026 |
The per-person line shows less growth than the totals do. Real GDP per person was C$61,027 per person in Q3 2022; it is C$60,504 per person now, a little lower than that peak. Since the first quarter of 2022 it has changed by 0.1% while the population grew 8.4% (to 1 July 2026) and real household spending 11.8%. Over that stretch the economy grew mainly by adding people, not by producing more per person. The population section covers where those people came from and the productivity section what that means for output per hour.
Real household spending has grown faster than real GDP. This report does not show how spending was financed: household debt is 176.4% of disposable income, down from 182.9% at the end of 2019 and a peak of 188.2% in Q3 2022, while credit card balances at chartered banks are C$115.5 billion, up 35.4% on the same month seven years earlier (the series is not seasonally adjusted).
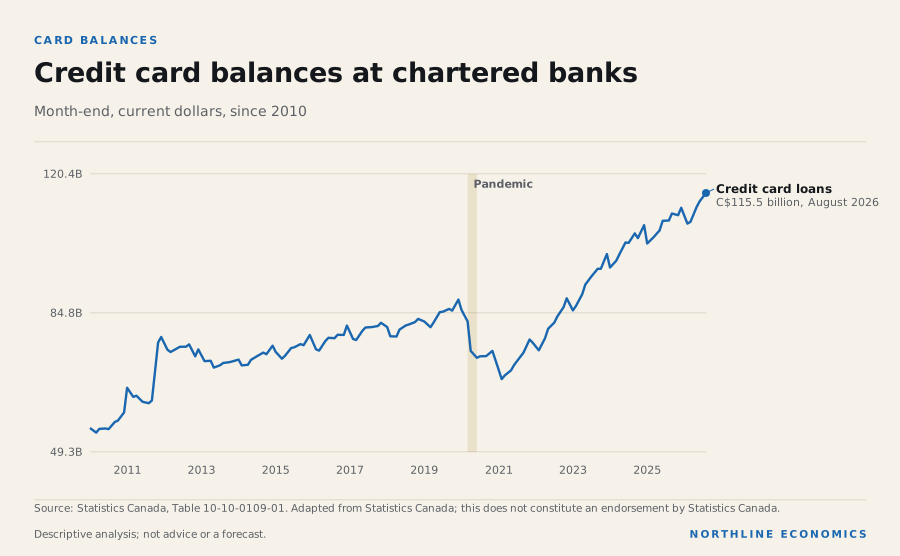
The data behind this graphic
| Series | Latest |
|---|---|
| Credit card loans | C$115.5 billion, August 2026 |
Card balances fell to C$67.9 billion in February 2021 in the pandemic and have since risen above the earlier level. They are current-dollar balances, so part of the rise is prices, and they show borrowing, not delinquency; the financial-vulnerability section covers arrears.
Why it happened
Statistics Canada reported that real GDP rose in the second quarter, led by exports, household spending and business capital investment. The data here cannot say which households or which goods account for the spending, because spending by category and by income group is not held here.
Evidence: Statistics Canada: The Daily: Gross domestic product, income and expenditure, second quarter 2026
Statistics Canada reported that grocery prices rose less than before, with the smallest yearly increase since May 2024, and that gasoline prices led the acceleration of the headline rate in September. Both bear on what a household can buy with a given income, but the national disposable-income figures in the household-finances section are in current dollars and are not a price-adjusted measure, so this report does not show whether purchasing power rose or fell.
Evidence: Statistics Canada: The Daily: Consumer Price Index, September 2026
Why it matters
Household consumption is one of the main components of spending in the economy (see the growth section), so its pace shapes how much a slowdown in exports or investment is felt. Spending depends on income, borrowing costs and confidence; the interest-rates section shows the debt side, where household debt is 176.4% of disposable income.
History
Real household consumption has changed 14.5% since the last quarter of 2019. The series is quarterly and is revised.
Across geographies
The provincial spread in retail sales growth is wide: Prince Edward Island's rate is 9.7% and the Northwest Territories' 1.4%. Those two are small economies where a few stores or a price change can move the figure, and the data cannot say whether the spread reflects population change, prices, or tourism. No city retail series is held, so none of these figures describes a city.
What it influences
The Bank of Canada describes higher interest costs as discouraging borrowing and spending, with rate-sensitive sectors such as housing often slowing first; whether that is visible in the spending figures above is not tested here.
Evidence: relationship: Household mortgage debt-servicing costs and Household spending; Bank of Canada: Tiff Macklem, Governor: Monetary policy at work, remarks to CFA Québec (7 February 2023); Bank of Canada: Bounajm and McWhirter, Modelling Canadian mortgage debt and payments in a semi-structural model (Staff Analytical Note 2024-1)
Risks
Not assessed: how much of monthly retail growth is price rather than volume by province, because monthly retail volumes are not held here.
What it means for decisions
For a retailer or consumer business. Demand is growing, but the growth is thinner than it looks per person. Real spending has outpaced the population only modestly since 2019, and real GDP per person is close to flat. Where population growth slows, as the population section describes, volume growth from a growing customer base slows with it.
For a lender. This report does not show how spending was financed. Credit card balances and household debt service are the indicators to follow, and the household-finances and financial-vulnerability sections follow them.
For a regional business. Retail growth differs widely by province; the data here do not show why. The provincial comparison is a guide to where nominal demand is growing, not to profitability.
For a household. Per-person output is the number behind incomes in the long run. When it is flat, real income growth for the average household has to come from somewhere else (for example a shift of income from capital to labour, or lower taxes), and none of those is in this section’s data.
What the data cannot say. Spending by category and by income group is not held here, so it is not possible to say who is spending more or on what.
What to watch
Statistics Canada's monthly retail trade and Labour Force Survey releases, the quarterly national accounts and the Bank of Canada's next announcement on 9 December 2026 (release calendar).
Prepared with AI assistance.
Follow the relationships
- Household spending 1 with evidence · 1 recorded Open in Studio
- Consumer price inflation 1 with evidence · 1 recorded Open in Studio
- Household mortgage debt-servicing costs 4 with evidence · 4 recorded Open in Studio
- Wages 0 with evidence · 0 recorded Open in Studio
Upcoming releases
- 2026-11-20 Retail trade September 2026 · Statistics Canada
- 2026-11-30 Gross domestic product, income and expenditure Third quarter 2026 · Statistics Canada
Sources for this section (7 datasets, 4 documents)
Data
- Gross domestic product, expenditure-based, Canada, quarterly (36-10-0104-01; 5 series; latest Q2 2026; retrieved 2026-10-23)
- Monthly retail trade sales by province and territory (20-10-0056-01; 9 series; latest August 2026; retrieved 2026-11-05)
- Consumer Price Index, monthly, not seasonally adjusted (18-10-0004-01; 2 series; latest September 2026; retrieved 2026-10-23)
- Average weekly earnings by industry, monthly, unadjusted for seasonality (14-10-0203-01; 1 series; latest August 2026; retrieved 2026-11-05)
- Population estimates, quarterly (17-10-0009-01; 1 series; latest 1 July 2026; retrieved 2026-10-23)
- Household sector credit market summary table, seasonally adjusted estimates (38-10-0238-01; 1 series; latest Q2 2026; retrieved 2026-10-23)
- Chartered banks, assets and liabilities, month-end, Bank of Canada (10-10-0109-01; 1 series; latest August 2026; retrieved 2026-10-25)
Documents cited
- Statistics Canada: The Daily: Gross domestic product, income and expenditure, second quarter 2026 (retrieved 2026-10-22)
- Statistics Canada: The Daily: Consumer Price Index, September 2026 (retrieved 2026-11-07)
- Bank of Canada: Tiff Macklem, Governor: Monetary policy at work, remarks to CFA Québec (7 February 2023) (retrieved 2026-11-07)
- Bank of Canada: Bounajm and McWhirter, Modelling Canadian mortgage debt and payments in a semi-structural model (Staff Analytical Note 2024-1) (retrieved 2026-11-07)
Each dataset is used under its licence; attribution and series-level detail are in each chart’s “About this data” panel. Limitations: Household spending is measured in the national accounts for Canada only; provincial household consumption by category is not held here. Retail sales are in current dollars, so they include price changes, and cover retail trade only (not services, housing costs or travel). City-level spending data are not held, so no city figure is implied. National household income and saving by income fifth are in the household-finances section; provincial household income and saving are not held here.
How strong are Canadian household balance sheets, and how is income divided across households?
Households owned 1,021.9% of their annual disposable income in net worth in Q2 2026, and the top fifth of households received 42.0% of disposable income in 2025, up from 40.4% in 2019
Graphic: Net saving per household, by fifth of disposable income
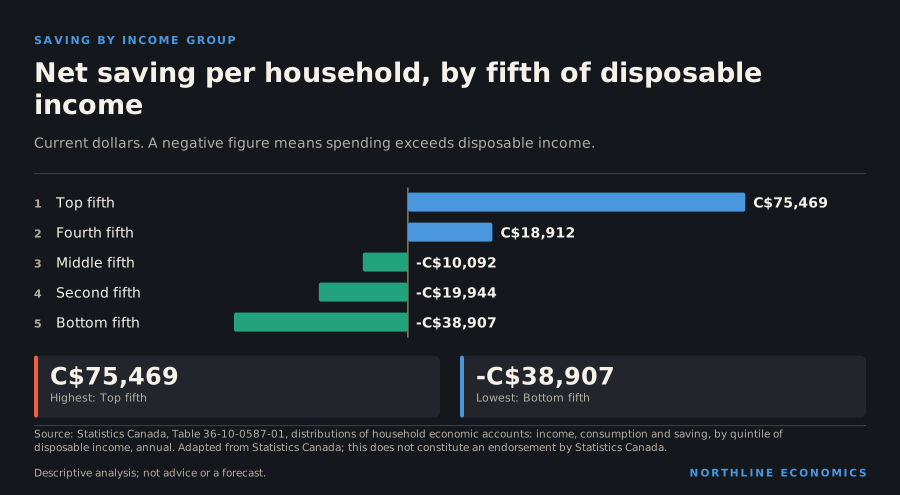
What happened
Household net worth, which is assets minus debt, was 1,021.9% of disposable income in Q2 2026. Its highest reading was 1,131.8% in Q1 2022. Real estate alone was worth 478.1% of disposable income, against a peak of 630.3% in Q1 2022.
Household net worth and real estate relative to income
Percent of household disposable income, quarterly (national balance sheet accounts).
Chart loads when it comes into view.
Latest values: Net worth 1,022 (2026 Q2); Real estate 478.1 (2026 Q2).
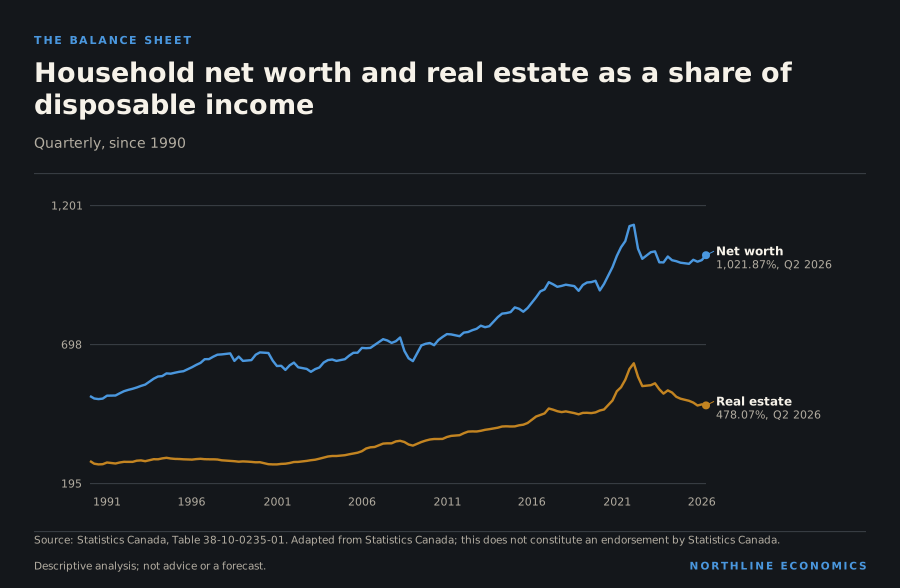
The data behind this graphic
| Series | Latest |
|---|---|
| Net worth | 1,021.87%, Q2 2026 |
| Real estate | 478.07%, Q2 2026 |
Debt was 14.8% of total assets, and homeowners' equity was 72.7% of the value of real estate. The effective interest cost on mortgage loans was 1.0% in the quarter, a quarterly rate, against 0.6% in early 2022; on non-mortgage loans it was 2.1% against 1.5%.
Household debt to assets and homeowners' equity
Percent, quarterly. Owners' equity is the share of real estate value that is not owed.
Chart loads when it comes into view.
Latest values: Debt as a share of total assets 14.79 (2026 Q2); Owners' equity as a share of real estate 72.7 (2026 Q2).
Effective interest cost on household loans
Interest paid as a share of loans outstanding, a quarterly rate (the cost in one quarter, not per year), unadjusted.
Chart loads when it comes into view.
Latest values: Mortgage loans 1.03 (2026 Q2); Non-mortgage loans 2.1 (2026 Q2).
The distribution accounts divide households into fifths by disposable income. In 2025 the top fifth received 42.0% of all disposable income and the bottom fifth 6.3%. In 2020 the shares were 37.6% and 7.5%; in 1999 they were 40.1% and 6.3%.
Share of household disposable income by income quintile
Percent of the national total, annual; households are ranked by disposable income and divided into fifths.
Chart loads when it comes into view.
Latest values: Bottom fifth 6.3 (2025); Second fifth 12 (2025); Middle fifth 16.8 (2025); Fourth fifth 23 (2025); and 1 more in the data table.
Disposable income per household was C$32,802 in the bottom fifth and C$219,061 in the top fifth in 2025. Net saving per household was C$75,469 in the top fifth and -C$38,907 in the bottom fifth.
Disposable income per household by income quintile
Current dollars per household, annual (not adjusted for inflation).
Chart loads when it comes into view.
Latest values: Bottom fifth 32,800 (2025); Second fifth 62,400 (2025); Middle fifth 87,710 (2025); Fourth fifth 120,200 (2025); and 1 more in the data table.
Net saving per household by income quintile
Current dollars per household, annual. Household net saving as defined in the national accounts table; negative means saving was below zero for that group in that year.
Chart loads when it comes into view.
Latest values: Bottom fifth -38,910 (2025); Second fifth -19,940 (2025); Middle fifth -10,090 (2025); Fourth fifth 18,910 (2025); and 1 more in the data table.
Five kinds of household
The distribution accounts divide households into five equal groups by disposable income. The average hides large differences. In the latest year, disposable income per household ranges from C$32,802 in the bottom fifth to C$219,061 in the top fifth, more than six and a half times as much.
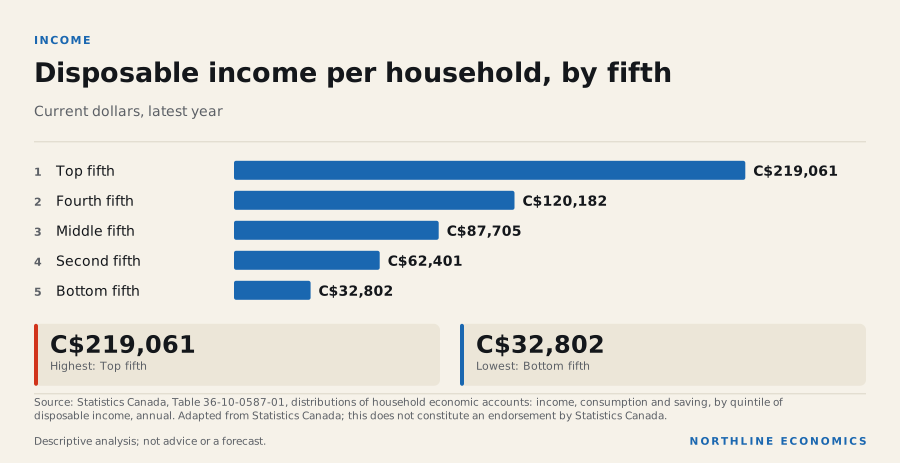
The data behind this graphic
| Item | Value |
|---|---|
| Top fifth | C$219,061 |
| Fourth fifth | C$120,182 |
| Middle fifth | C$87,705 |
| Second fifth | C$62,401 |
| Bottom fifth | C$32,802 |
The shares tell the same story as a proportion of the total. The top fifth of households receives 42.0% of all disposable income, the fourth 23.0%, the middle 16.8%, the second 12.0% and the bottom 6.3%. In 1999 the top fifth’s share was 40.1% and the bottom fifth’s 6.3%. The top share has risen by 1.9 percentage points since then, and the three middle fifths have each lost a little.
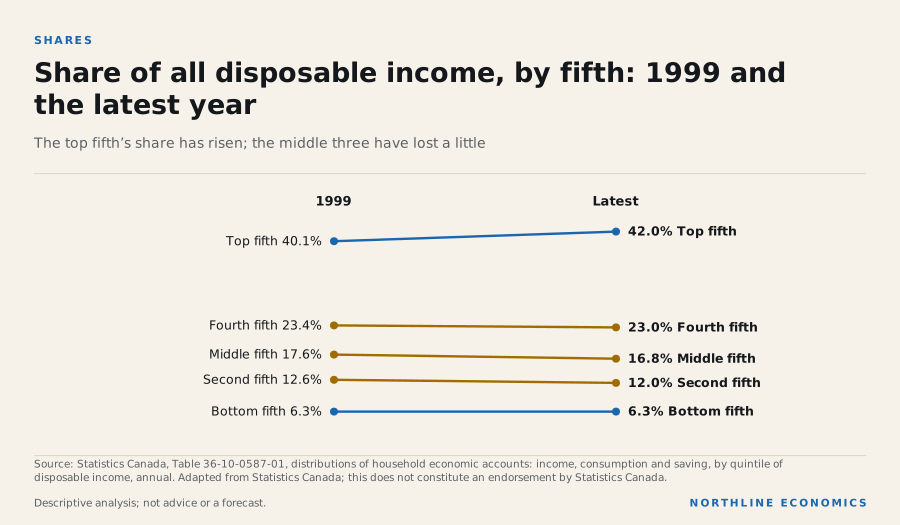
The data behind this graphic
| Item | 1999 | Latest |
|---|---|---|
| Bottom fifth | 6.3% | 6.3% |
| Second fifth | 12.6% | 12.0% |
| Middle fifth | 17.6% | 16.8% |
| Fourth fifth | 23.4% | 23.0% |
| Top fifth | 40.1% | 42.0% |
The year 2020 is the exception. In that year the top fifth’s share was 37.6% and the bottom fifth’s 7.5%, a narrower distribution than in 2019 (40.4% and 6.3%) or in the latest year. The data do not say why, and no source cited here explains it. The distribution has since returned to its earlier pattern.
Saving
The saving numbers are the most unequal. Net saving per household, which is disposable income less consumption, is C$75,469 in the top fifth and C$18,912 in the fourth. In the middle fifth it is -C$10,092, in the second -C$19,944 and in the bottom fifth -C$38,907. The bottom three fifths, on average, spend more than they receive in disposable income.
That is not a statement about debt. Net saving in the national accounts is income less consumption, and it can be negative for households that draw on assets, for retirees who spend from savings, or for households that borrow. The tables do not separate these. They do show that the national saving rate is the product of a small group, and that an aggregate figure for household saving says little about the households in the lower fifths. The financial-vulnerability section describes the balance sheet from the lender’s side.
Who gained since 2019
Over the latest six years the top fifth gained most and the bottom fifth second most. Disposable income per household rose 32.8% in the top fifth and 28.4% in the bottom fifth, with 20.4%, 23.5% and 26.3% in between. Consumer prices rose by about a fifth from 2019 to 2025, slightly more than the second fifth's income, so the second fifth fell slightly behind prices and the others outpaced them. The comparison is in current dollars and does not adjust for each group’s own price index; the prices section shows that necessities have risen more than the average, which could affect lower-income households more.
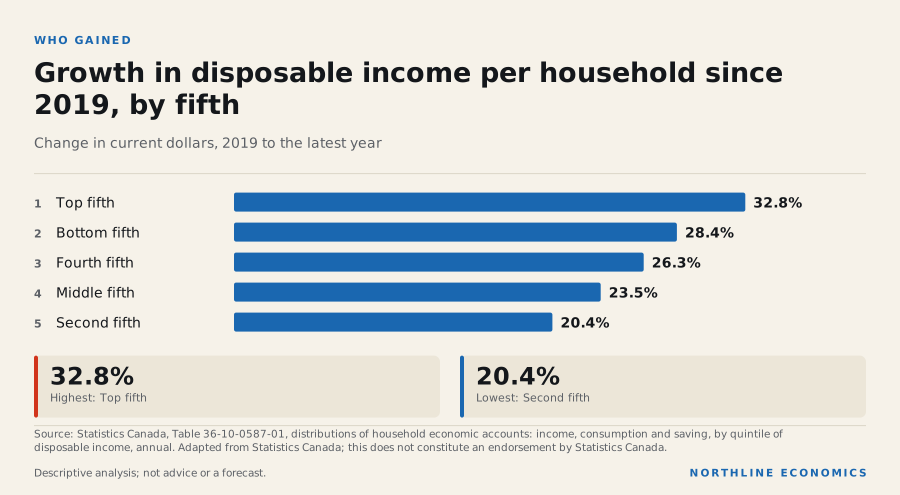
The data behind this graphic
| Item | Value |
|---|---|
| Top fifth | 32.8% |
| Bottom fifth | 28.4% |
| Fourth fifth | 26.3% |
| Middle fifth | 23.5% |
| Second fifth | 20.4% |
Over the full twenty-six years from 1999 the differences are smaller in annual terms. Income per household is up 136.8% in the top fifth and 125.4% in the bottom fifth, both in current dollars. The top and bottom have grown at similar rates over the long run, which is why the shares have barely changed. What has changed in the last six years is that the three middle fifths have fallen behind both the top and bottom.
Why it happened
Not assessed. These tables show levels and shares; they do not separate the effects of asset prices, wages, government transfers, taxes, interest rates and household composition, and no source explaining the movements is cited here. The top fifth's share was 37.6% in 2020 and is 42.0% now; the data record both but do not say what drove the difference.
Why it matters
The balance-sheet ratios show how large household assets are relative to income and how exposed households are as a group to borrowing costs, which is the channel the interest-rates section describes. The distribution tables show that average figures hide very different circumstances: when the lowest fifth's net saving is -C$38,907 per household, an aggregate saving rate says little about it. A higher share of income at the top also matters for spending patterns, because the tables show households in different fifths saving very different amounts.
History
Net worth relative to income was 669.7% in 2000 and 1,021.9% now. Real estate relative to income was 272.6% in 2000. The top fifth's disposable income per household rose 136.8% between 1999 and 2025; the bottom fifth's rose 125.4%. These are current-dollar changes and include twenty-six years of price increases.
Across geographies
Not assessed. These tables are national; no provincial household balance sheet or income distribution is held here, so nothing here says how Alberta, Ontario or any city compares. The provincial and city sections cover earnings and employment, which are different measures.
What it influences
The Bank of Canada describes higher interest costs as discouraging borrowing and spending; the balance-sheet figures above show the debt and interest side of that channel but this section does not test whether spending responded.
Evidence: relationship: Household mortgage debt-servicing costs and Household spending; Bank of Canada: Tiff Macklem, Governor: Monetary policy at work, remarks to CFA Québec (7 February 2023)
Risks
An aggregate balance sheet can look strong while particular households are exposed; these totals cannot show how assets and debts are spread. Real estate is worth 478.1% of disposable income, and a measure based on property values moves when prices move. Nothing here is a forecast.
What it means for decisions
For a business selling to consumers. Spending power is concentrated. The top fifth receives 42.0% of disposable income and saves most of what is saved. A product aimed at the top fifth faces a different market from one aimed at the bottom three, where spending exceeds income on average.
For a lender. The aggregate balance sheet is strong. Net worth is 1,021.9% of disposable income and real estate 478.1%. But the lower fifths’ negative net saving means that borrowing, or drawing on assets, is how consumption is financed there. The financial-vulnerability section follows the debt.
For a policymaker. Transfers and taxes shape disposable income, and the tables are after both. The 2020 pattern shows how large a change in the distribution is possible in a single year, though the data do not say what caused it.
For a household. The average fifth describes no one. A household’s position depends on its income group, its age, whether it owns a home and when it bought it, and none of these are in the tables.
What the data cannot say. The tables are national and annual. They are in current dollars, do not adjust for household size or age, and do not identify causes. Nothing here is a forecast.
What to watch
Statistics Canada's quarterly national balance sheet accounts and its annual distributions of household economic accounts (release calendar), and the Bank of Canada's household debt commentary.
Prepared with AI assistance.
Follow the relationships
- Household spending 1 with evidence · 1 recorded Open in Studio
- Household mortgage debt-servicing costs 4 with evidence · 4 recorded Open in Studio
- Wages 0 with evidence · 0 recorded Open in Studio
Sources for this section (2 datasets, 1 documents)
Data
- Financial indicators of households and non-profit institutions serving households, national balance sheet accounts (38-10-0235-01; 6 series; latest Q2 2026; retrieved 2026-10-25)
- Distributions of household economic accounts, income, consumption and saving, by characteristic, annual (36-10-0587-01; 15 series; latest 2025; retrieved 2026-10-25)
Documents cited
- Bank of Canada: Tiff Macklem, Governor: Monetary policy at work, remarks to CFA Québec (7 February 2023) (retrieved 2026-11-07)
Each dataset is used under its licence; attribution and series-level detail are in each chart’s “About this data” panel. Limitations: National figures only: no provincial or city household balance sheets or income distributions are held. The balance-sheet ratios are aggregates for all households and say nothing about how debt and assets are spread between them. The distribution tables rank households by disposable income in each year, so a household can move between fifths, and the lowest fifth includes households with temporarily low income. The distribution accounts are annual, published well after the year and revised; levels are in current dollars and are not adjusted for inflation. Interest cost is a quarterly rate on loans outstanding and is not the rate on new loans. No source explaining the changes is cited here.
How financially stretched are Canadian households and businesses, and where is the stress concentrated?
Canadian consumer insolvencies in the second quarter of 2026 were 6.9 per cent higher than a year earlier and the rise is concentrated in Ontario and British Columbia; in May the Bank of Canada said household stress had plateaued
Graphic: Wealthy on paper, stretched on cash flow
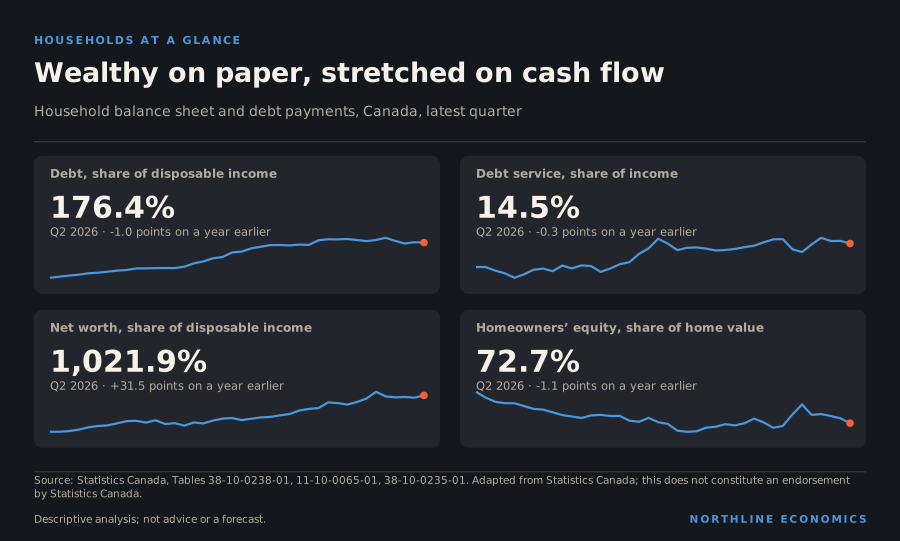
What happened
Household credit market debt was 176.4% of disposable income in Q2 2026, and household net worth was 1,021.9% of disposable income.
Statistics Canada reports that the household debt service ratio declined in the second quarter of 2026, to 14.52%, after peaking at 15.16% in the first quarter of 2023.
The Office of the Superintendent of Bankruptcy reports 37,523 consumer insolvencies filed in Canada in the second quarter of 2026, 6.9 per cent more than in the second quarter of 2025, and 1,281 business insolvencies, a change of 0.2 per cent on the year.
A balance sheet in three parts
Household finances are easiest to understand as three separate things that are often run together: what households own, what they owe, and what they pay each period to service what they owe.
What they own. Household net worth is 1,021.9% of disposable income. That is above its level at the end of 2019 (929.1%) and well above the 638.4% of the first quarter of 2009, its low in the financial crisis, but below the 1,131.8% reached in Q1 2022. Housing accounts for the fall since that peak. Real estate holdings were 630.3% of income at the peak and are 478.1% now.
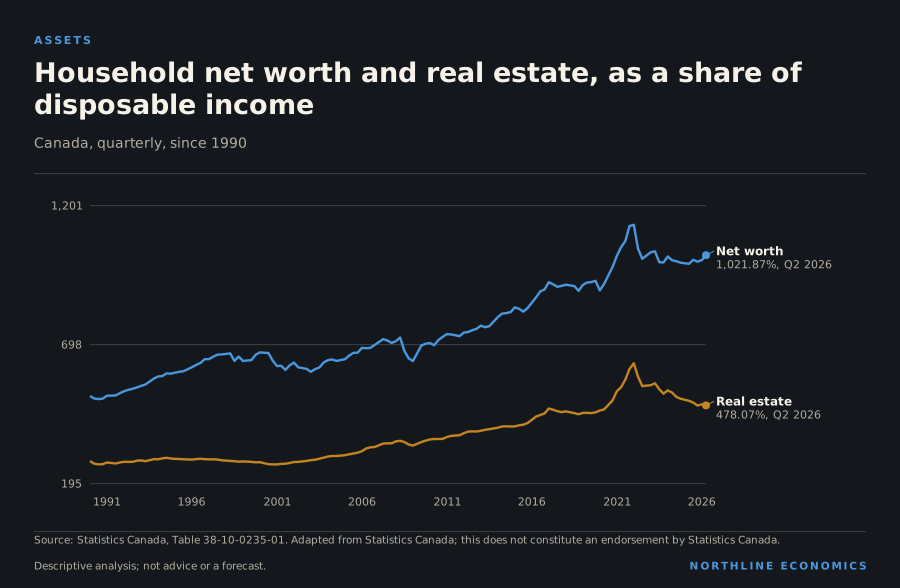
The data behind this graphic
| Series | Latest |
|---|---|
| Net worth | 1,021.87%, Q2 2026 |
| Real estate | 478.07%, Q2 2026 |
What they owe. Household credit market debt is 176.4% of disposable income, down from 188.2% in Q3 2022. The reduction is real, but the level is high by any longer comparison: it was 161.9% in the first quarter of 2010 and 114.0% in the first quarter of 2000. Debt is a smaller share of assets than in 2010 (14.8% against 18.6%), as asset values rose, and homeowners’ equity is 72.7% of home value.
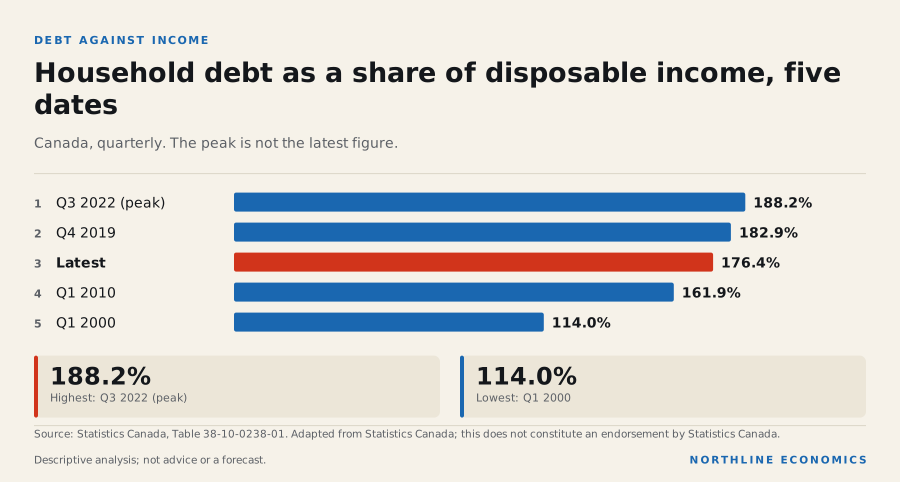
The data behind this graphic
| Item | Value |
|---|---|
| Q3 2022 (peak) | 188.2% |
| Q4 2019 | 182.9% |
| Latest | 176.4% |
| Q1 2010 | 161.9% |
| Q1 2000 | 114.0% |
What they pay. The debt service ratio, which measures principal and interest payments as a share of disposable income, is 14.5%. That is below its 15.2% peak in Q1 2023 and above its pandemic low of 12.6%. The two components moved differently. The mortgage ratio is 7.7%, against 7.2% at the end of 2019. The non-mortgage ratio is 6.8%, lower than the 7.8% of 2019: households pay a larger share of income towards their mortgages than before the pandemic and a smaller share towards cards, car loans and lines of credit.
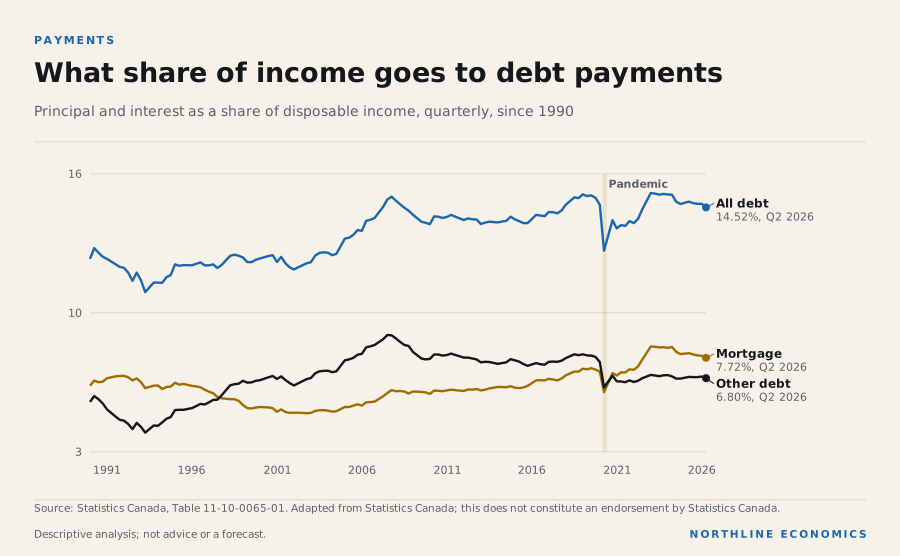
The data behind this graphic
| Series | Latest |
|---|---|
| All debt | 14.52%, Q2 2026 |
| Mortgage | 7.72%, Q2 2026 |
| Other debt | 6.80%, Q2 2026 |
The effective interest cost on household mortgage loans shows why payments are higher while debt is lower relative to income: it is 1.0% a quarter now, against 0.6% at its low in Q1 2022 and 1.1% at its high in Q2 2024. The cost of non-mortgage borrowing is 2.1%.
Why it happened
The Bank of Canada's 2026 Financial Stability Report, published in May, says Canadian households continue to carry high levels of debt relative to their income, that the ratio of household debt to disposable income has increased slightly over the past 12 months but remains below its 2022 peak, and that mortgage arrears remain low overall but have risen more among borrowers with large mortgage balances relative to their income. It adds that stress is most acute among Toronto-area borrowers who took out a mortgage in 2022-23. Statistics Canada's figures for the second quarter of 2026, published after the report, show the debt ratio fell 1.0 percentage points from a year earlier.
Evidence: Bank of Canada: Financial Stability Report 2026: Households (22 May 2026)
On the cause of stress the Bank says the main risk is that economic or geopolitical developments lead to a downturn and a sharp rise in unemployment, that households would be affected largely through the labour market, and that households without sufficient savings could fall behind on mortgage and consumer credit payments; it notes that the unemployment rate has stayed in a range of about 6½% to 7% over the past 12 months.
Evidence: Bank of Canada: Financial Stability Report 2026: Households (22 May 2026)
Why it matters
The Bank concludes that indicators of both household and business financial stress have plateaued over the past 12 months, that household indebtedness remains high but below recent peaks, that businesses have maintained healthy balance sheets, and that the large banks have grown more resilient because of higher profitability, a stabilization in loan performance and more funds set aside for credit losses.
Evidence: Bank of Canada: Financial Stability Report 2026: Overall assessment (22 May 2026)
It also warns that vulnerabilities have increased in some parts of the system and that valuations of many financial assets have continued to rise, increasing the risk of a sudden correction.
Evidence: Bank of Canada: Financial Stability Report 2026: Overall assessment (22 May 2026)
Read with the insolvency counts above, the evidence points to stress that is rising in absolute filings while the Bank's broad indicators have levelled off; the filings are counts, not rates, so they do not show whether a larger share of households is failing, and the Bank's report predates the second-quarter data.
History
Consumer insolvencies in the 12 months to June 30, 2026 numbered 145,762, 5.9 per cent more than the previous 12 months, while business insolvencies over the same period changed by -9.7 per cent.
In May 2026 the Bank said the share of borrowers falling behind on debt payments had stabilized over the past 12 months after increasing over the previous four years.
Evidence: Bank of Canada: Financial Stability Report 2026: Households (22 May 2026)
Across geographies
The Office of the Superintendent of Bankruptcy's provincial tables show consumer insolvencies in the second quarter changing by 10.2 per cent in Ontario, 10.9 per cent in British Columbia, 3.9 per cent in Quebec and 1.4 per cent in Alberta, against 6.9 per cent nationally. In May 2026 the Bank of Canada said the typical home price had fallen by about 5% in the previous 12 months and that only a small share of borrowers would not be able to refinance at renewal. These are regional differences in filings; the sources do not say why they differ.
Evidence: Office of the Superintendent of Bankruptcy Canada: Insolvency Statistics in Canada: second quarter of 2026; Bank of Canada: Financial Stability Report 2026: Households (22 May 2026)
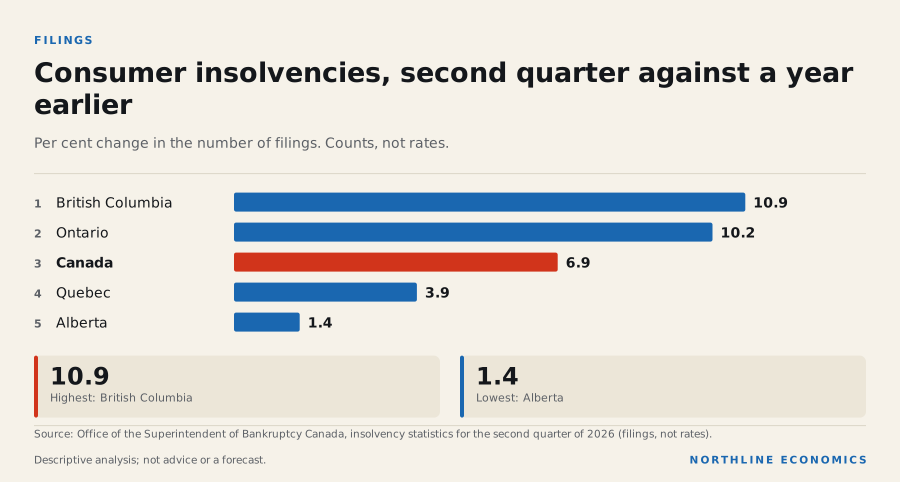
The data behind this graphic
| Item | Value |
|---|---|
| British Columbia | 10.9 |
| Ontario | 10.2 |
| Canada | 6.9 |
| Quebec | 3.9 |
| Alberta | 1.4 |
The chart shows two provinces, British Columbia and Ontario, with filings rising faster than the national rate, and two, Quebec and Alberta, where they rose less. Ontario and British Columbia also account for most of the national increase in the number of filings. Among the smaller provinces, filings rose faster than the national rate in Prince Edward Island (14.7 per cent), Saskatchewan (11.1 per cent) and New Brunswick (8.8 per cent), on much smaller numbers. The Bank of Canada’s statement that stress is most acute among Toronto-area borrowers who took out a mortgage in 2022–23 is consistent with Ontario’s figure, but the filings are counts of insolvency proceedings, which depend on a province’s population and on how people choose to deal with debt, and they cannot be read as default rates.
What it influences
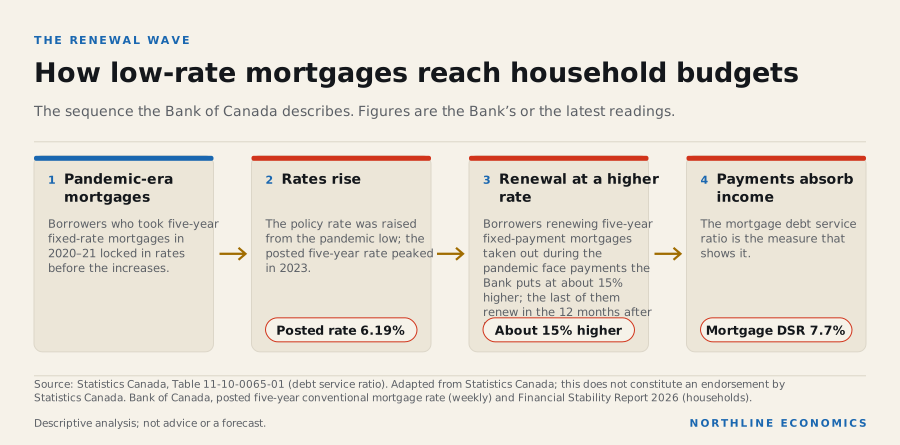
The data behind this graphic
| Step | What happens |
|---|---|
| Pandemic-era mortgages | Borrowers who took five-year fixed-rate mortgages in 2020–21 locked in rates before the increases. |
| Rates rise | The policy rate was raised from the pandemic low; the posted five-year rate peaked in 2023. |
| Renewal at a higher rate | Borrowers renewing five-year fixed-payment mortgages taken out during the pandemic face payments the Bank puts at about 15% higher; the last of them renew in the 12 months after May 2026. |
| Payments absorb income | The mortgage debt service ratio is the measure that shows it. |
In May 2026 the Bank said the last of the five-year fixed-payment mortgages taken out during the pandemic would renew over the following 12 months, with those borrowers seeing payments rise by about 15%, and that by the second half of 2027 nearly all mortgage holders facing large payment increases will have renewed. This links household finances to the interest-rates and housing sections: the Bank of Canada describes a link between mortgage costs and spending, which this section does not test.
Evidence: Bank of Canada: Financial Stability Report 2026: Households (22 May 2026)
Risks
In May the Bank listed US tariffs on a broader set of goods and the effective closure of the Strait of Hormuz, which it said was disrupting supply chains and putting downward pressure on global growth and upward pressure on inflation, among the risks to financial stability, and said that most Canadian trade with the United States remained tariff-free though sectoral tariffs had hurt activity in affected industries. After the report, new US tariffs on a range of Canadian products took effect at the end of August 2026, Statistics Canada noted.
Evidence: Bank of Canada: Financial Stability Report 2026: Overall assessment (22 May 2026); Statistics Canada: The Daily: Canadian international merchandise trade, August 2026
What it means for decisions
For a lender. The balance-sheet figures argue against alarm, and the payment figures argue against complacency. Households have large assets relative to income, and the mortgage debt service ratio, at 7.7%, is below its 8.2% peak. But the Bank of Canada’s own assessment is that stress has plateaued, not fallen, and that it is concentrated among households with large mortgages relative to income. The renewal wave is the main test. The relevant data are arrears, not insolvencies, and delinquency series are not held here.
For a household. The figures describe the average. A household with a recent mortgage, a high loan-to-income ratio and little savings is in a different position from one with a paid-off home. The Bank notes that households without sufficient savings are the ones that could fall behind if unemployment rises sharply.
For a policymaker. Wealth in housing is not liquid, and it does not pay a mortgage. The household-finances section shows that the bottom fifth of households spend more than they receive; the balance-sheet figures above are national averages and do not speak to them.
For a business. Consumer-facing sectors are exposed to the same budgets: the consumers section shows that real household spending has grown faster than real GDP since 2019 while output per person has barely moved, and that card balances are higher than before the pandemic.
What the data cannot say. Arrears, loan-to-income distributions by borrower and the renewal schedule are in the Bank’s reports but not in the series this report holds. The insolvency figures are counts, and the second-quarter figures postdate the Bank’s May 2026 report; they are not rates and are not seasonally adjusted. Nothing here is a forecast.
What to watch
The Office of the Superintendent of Bankruptcy's monthly and quarterly insolvency statistics, the Bank of Canada's next Financial Stability Report and Statistics Canada's quarterly national balance sheet accounts (release calendar) show whether the plateau in stress persists. Delinquency series are not held here (bank lending is in the credit-and-banks section), and no source cited here gives a forecast of insolvencies.
Prepared with AI assistance.
Follow the relationships
- Household mortgage debt-servicing costs 4 with evidence · 4 recorded Open in Studio
- Household spending 1 with evidence · 1 recorded Open in Studio
Upcoming releases
- 2026-12-11 National balance sheet and financial flow accounts Third quarter 2026 · Statistics Canada
Sources for this section (3 datasets, 5 documents)
Data
- Household sector credit market summary table, seasonally adjusted estimates (38-10-0238-01; 1 series; latest Q2 2026; retrieved 2026-10-23)
- Financial indicators of households and non-profit institutions serving households, national balance sheet accounts (38-10-0235-01; 6 series; latest Q2 2026; retrieved 2026-10-25)
- Debt service indicators of households, national balance sheet accounts (11-10-0065-01; 3 series; latest Q2 2026; retrieved 2026-10-25)
Documents cited
- Statistics Canada: The Daily: National balance sheet and financial flow accounts, second quarter 2026 (retrieved 2026-10-22)
- Office of the Superintendent of Bankruptcy Canada: Insolvency Statistics in Canada: second quarter of 2026 (retrieved 2026-10-25)
- Bank of Canada: Financial Stability Report 2026: Households (22 May 2026) (retrieved 2026-10-25)
- Bank of Canada: Financial Stability Report 2026: Overall assessment (22 May 2026) (retrieved 2026-10-25)
- Statistics Canada: The Daily: Canadian international merchandise trade, August 2026 (retrieved 2026-10-22)
Each dataset is used under its licence; attribution and series-level detail are in each chart’s “About this data” panel. Limitations: Statements are the named organisations' own. Insolvency counts are filings under the Bankruptcy and Insolvency Act by quarter and are not rates: they are not adjusted for population or for the number of households, and consumer insolvencies are filings by individuals whose liabilities are mainly consumer-related. Bank lending volumes and debt service ratios are in the credit-and-banks section; delinquency series are not held here, so arrears are told only through the Bank of Canada's statements. The Bank's report was published in May 2026 and does not reflect later months.
How much do Canadian banks lend, to whom, and how heavy are the payments on household debt?
Chartered-bank residential mortgages stood at C$1.74 trillion in August 2026, business loans at C$1.07 trillion, and households spent 14.5% of disposable income on debt payments in Q2 2026
Graphic: Chartered-bank loans since December 2019, by type
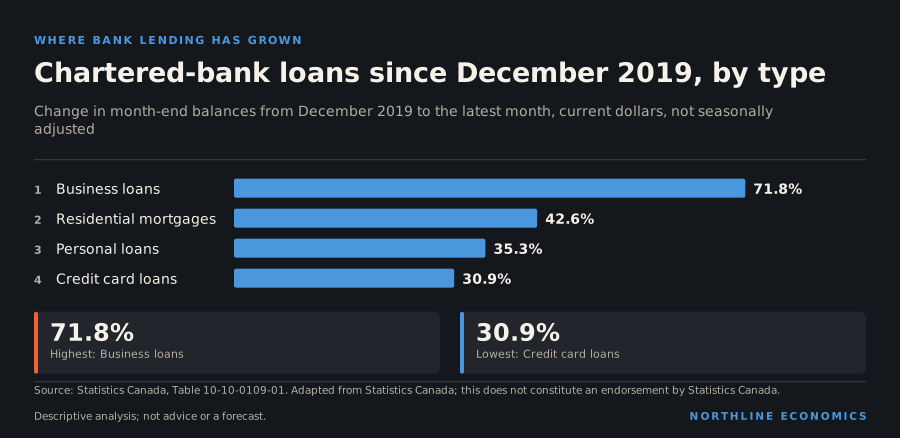
What happened
Chartered banks held C$1.74 trillion of residential mortgages at the end of August 2026, C$1.07 trillion of business loans and C$723.3 billion of personal loans, a category that includes C$115.5 billion of credit card loans.
Chartered-bank loans by type
C$ billions, month-end balances, unadjusted (Bank of Canada series distributed by Statistics Canada). Chartered banks only; personal loans include credit card loans, so the credit card line is a part of the personal loans line.
Chart loads when it comes into view.
Latest values: Residential mortgages 1,741 (2026-08); Business loans 1,067 (2026-08); Personal loans (all kinds) 723.3 (2026-08); Credit card loans (part of personal) 115.5 (2026-08).
Over the year to August 2026 mortgage balances changed by 1.7%, business loans by 8.4%, personal loans by 9.9% and credit card loans by 6.5%.
Households' debt payments, principal and interest together, took 14.5% of their disposable income in Q2 2026; 7.7% of income went on mortgage debt and 6.8% on other debt. A year earlier the total was 14.8%.
Household debt service ratios
Principal and interest payments as a percent of household disposable income, quarterly, seasonally adjusted at annual rates (national balance sheet accounts).
Chart loads when it comes into view.
Latest values: All debt 14.52 (2026 Q2); Mortgage debt 7.72 (2026 Q2); Non-mortgage debt 6.8 (2026 Q2).
Banks and other depository institutions earned a quarterly return on equity of 0.032 in Q2 2026, against 0.021 a year before and 0.008 in the first quarter of 2023, the weakest reading in the series that began in 2020.
Return on equity, banks and other depository institutions
Ratio as published, quarterly, unadjusted (0.03 is 3 percent of equity in the quarter); the table does not say whether it is annualised. Series begins in 2020.
Chart loads when it comes into view.
Latest values: Return on equity 0.032 (2026 Q2).
Where the lending went
The balance sheets of the chartered banks hold three big categories. Residential mortgages are the largest, at C$1.74 trillion. Business loans are second at C$1.07 trillion and personal loans, which include C$115.5 billion of credit card balances, are C$723.3 billion.
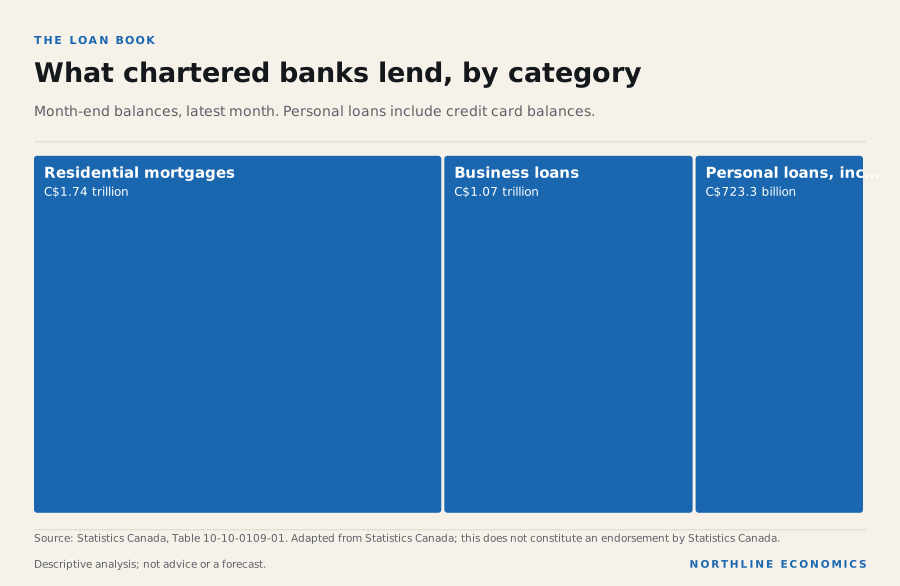
The data behind this graphic
| Item | Value |
|---|---|
| Residential mortgages | C$1.74 trillion |
| Business loans | C$1.07 trillion |
| Personal loans, including cards | C$723.3 billion |
Their growth has been very different. Since December 2019 business loans are up 71.8%, mortgages 42.6%, personal loans 35.3% and credit cards 30.9%. The balances are not seasonally adjusted, and business and card balances are usually higher in December than in the months around it, so those two figures understate the rise: against the same month seven years earlier, business loans are up 81.8% and card loans 35.4%. Business borrowing has grown much faster than the mortgage book. Over a longer period the gap is wider still: since August 2015 business loans have grown 155.1% and mortgages 76.4%.
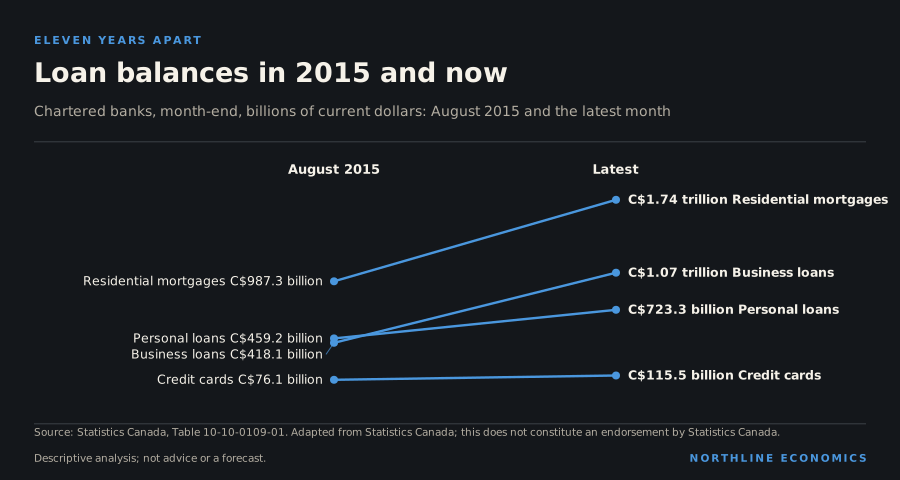
The data behind this graphic
| Item | August 2015 | Latest |
|---|---|---|
| Residential mortgages | C$987.3 billion | C$1.74 trillion |
| Business loans | C$418.1 billion | C$1.07 trillion |
| Personal loans | C$459.2 billion | C$723.3 billion |
| Credit cards | C$76.1 billion | C$115.5 billion |
The most recent year looks different. Mortgage balances rose only 1.7% over the latest twelve months, while business loans rose 8.4% and personal loans 9.9%.
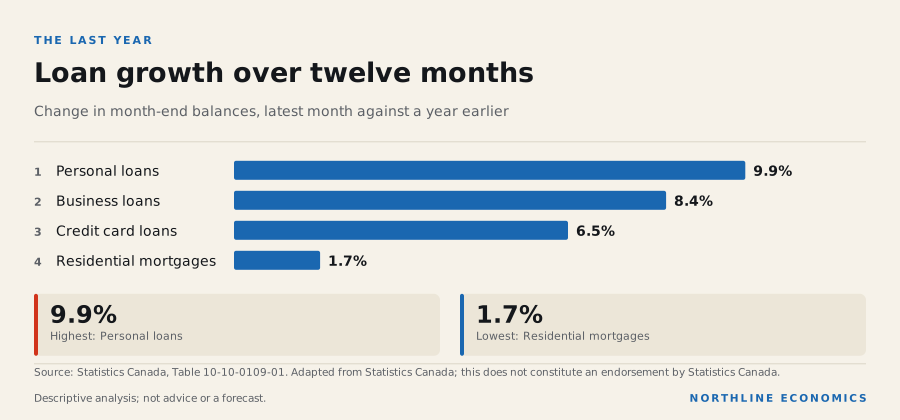
The data behind this graphic
| Item | Value |
|---|---|
| Personal loans | 9.9% |
| Business loans | 8.4% |
| Credit card loans | 6.5% |
| Residential mortgages | 1.7% |
The mortgage book is nearly flat in a period when the Bank of Canada says the typical home price has fallen, and the housing section covers that background. A flat balance means that new lending is about equal to repayment; the series cannot say whether borrowers are paying down balances, whether sales are subdued or whether mortgages are moving to other lenders.
Evidence: Bank of Canada: Financial Stability Report 2026: Households (22 May 2026)
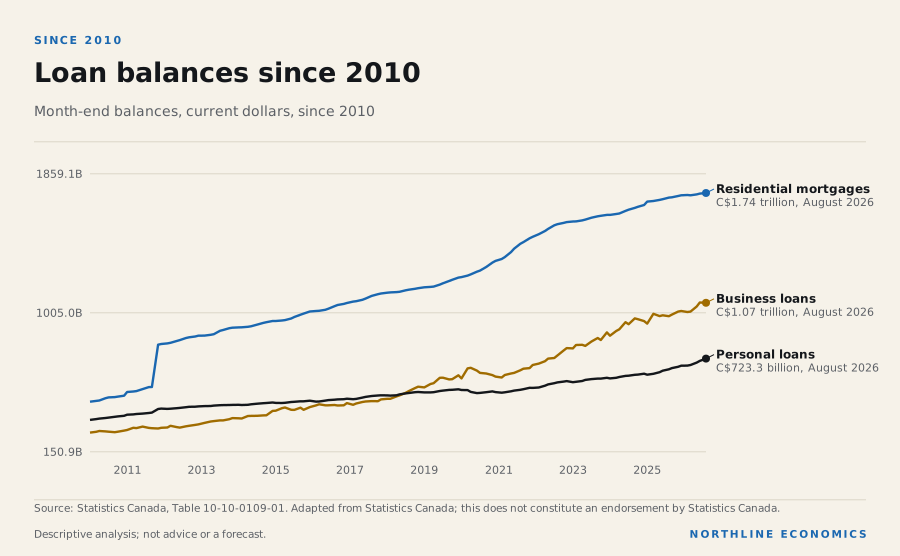
The data behind this graphic
| Series | Latest |
|---|---|
| Residential mortgages | C$1.74 trillion, August 2026 |
| Business loans | C$1.07 trillion, August 2026 |
| Personal loans | C$723.3 billion, August 2026 |
What households pay
On the household side the burden of payments matters more than the balance. The debt service ratio, principal plus interest as a share of disposable income, is 14.5%: 7.7% on mortgages and 6.8% on other debt. It was 12.6% in the pandemic quarter, 12.2% in the first quarter of 2000 and 15.2% at its peak in Q1 2023. The financial-vulnerability section describes the components, the renewal of low-rate mortgages and the insolvency figures.
Bank earnings
Banks and other depository institutions earned a quarterly return on equity of 0.032 in the latest quarter, from 0.008 in the first quarter of 2023, the weakest reading in the series, which begins in 2020. The table does not say whether the quarterly ratio is annualised.
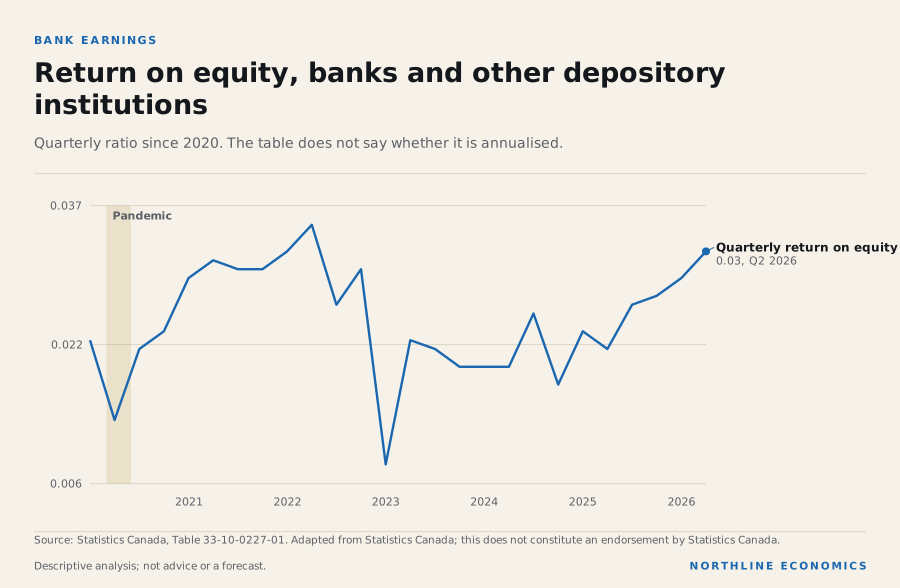
The data behind this graphic
| Series | Latest |
|---|---|
| Quarterly return on equity | 0.03, Q2 2026 |
The Bank of Canada, in the sources quoted below, links the improvement to higher revenue from capital-markets activity and stable loan performance. It also says the banks have set aside additional funds for credit losses and hold capital well above regulatory minimums. The data here show the earnings; the Bank’s statements supply the explanation and are cited as the Bank’s.
Evidence: Bank of Canada: Financial Stability Report 2026: Banks
Why it happened
The Bank of Canada says the financial health of Canada's large banks has improved over the past 12 months, that profitability has increased, supported by higher revenues from capital market activities, and that the deterioration in credit performance noted in its previous report has stabilized, particularly for corporate lending.
Evidence: Bank of Canada: Financial Stability Report 2026: Banks
On lending to firms the Bank says that large firms have issued bonds in recent years to take advantage of low borrowing costs, that this is a key reason for the rise in business debt, and that small and medium-sized businesses, which are generally not able to issue bonds, rely primarily on banks and credit unions for financing.
Evidence: Bank of Canada: Financial Stability Report 2026: Non-financial businesses
This is the desk's reading, not a source claim, and the mechanisms it names are hypotheses that the data cannot test. The data here do not separate demand from supply: a rise in a bank loan balance can come from new borrowing, from rising house prices or business costs, from mortgages moving onto bank balance sheets, or from slower repayment. None of the three tables records which of these applies, and no source cited here attributes the movement in any loan category to a cause.
Why it matters
The Bank says that banks have set aside additional funds to cover potential loan losses, that the accumulated stock of loan loss provisions as a share of total lending is now about 30% larger than it was three years ago, and that the large banks' common equity Tier 1 capital ratio averaged 13.7% in the first quarter of 2026, which it describes as well above regulatory minimums.
Evidence: Bank of Canada: Financial Stability Report 2026: Banks
On loan performance the Bank reports that the share of business loans that are past due stabilized in the second half of 2025 after increasing over the previous three years and remains low compared with previous periods of significant stress such as the 2008-09 global financial crisis, and that impairments on loans to small businesses have continued to increase in recent months while they have decreased for loans to large businesses.
Evidence: Bank of Canada: Financial Stability Report 2026: Non-financial businesses
The household debt service ratio is the series here closest to a measure of strain, because it relates payments to income; it was below its first-quarter 2023 peak in the latest quarter and below its level a year earlier, but it is an aggregate for all households and cannot show whether payments are concentrated among a minority, and the Bank's statements in the financial-vulnerability section describe stress as most acute among one group, Toronto-area borrowers who took out a mortgage in 2022-23.
History
Residential mortgages held by chartered banks were C$987.3 billion in August 2015 and C$1.27 trillion in August 2020; business loans were C$418.1 billion and C$642.3 billion on the same dates, and credit card loans C$76.1 billion and C$73.5 billion. These are current-dollar balances and include inflation.
The debt service ratio was 12.2% in the first quarter of 2000 and 12.6% in the second quarter of 2020, and its highest reading since 1990 was 15.2% in Q1 2023. The mortgage ratio was 6.2% in the second quarter of 2020 and is 7.7% now.
Across geographies
Not assessed. All three tables are national. Chartered-bank lending by province exists in a Statistics Canada table that is not held here, and no provincial debt service ratio is held, so nothing here says where borrowing or payment burdens are highest. The Office of the Superintendent of Bankruptcy's provincial insolvency counts in the financial-vulnerability section are the only regional evidence of stress in this report.
What it influences
The Bank says credit losses could exceed banks' current expectations if an escalation in US trade frictions or the war in the Middle East significantly weakens employment and economic activity, and that trade tensions could create targeted pressures, especially for small and medium-sized banks and credit unions that are highly exposed to regions or industries affected by increased tariffs.
Evidence: Bank of Canada: Financial Stability Report 2026: Banks
This links lending to the interest-rates and household-finances sections: payments on debt reach consumer spending through the share of income left after debt service, a mechanism the Bank of Canada describes for mortgage costs and that these tables do not test.
Risks
The Bank notes that the large banks rely not only on deposits but also on funding from wholesale markets and that a severe and prolonged disruption in funding markets would be challenging for them, given their reliance on wholesale funding and the growing contribution of capital market activities to revenues in recent years.
Evidence: Bank of Canada: Financial Stability Report 2026: Banks
What it means for decisions
For a small or medium-sized business. Business loans at chartered banks have grown fastest since 2019, but the Bank of Canada notes that impairments on loans to small businesses have continued to increase in recent months while they have decreased for loans to large businesses. Small firms rely mainly on banks and credit unions for finance, so they are more exposed if credit tightens.
For a household. Mortgage balances at chartered banks are almost flat. This does not mean any single household’s payments are flat: the renewal wave described in the financial-vulnerability section changes payments for those whose mortgages renew, whatever the system-wide balance.
For an investor in financial institutions. Earnings have recovered and the large banks hold capital well above minimums, according to the Bank of Canada. The Bank also says that small and medium-sized banks and credit unions with concentrated exposure to regions or industries affected by tariffs are more vulnerable. The tables here are national aggregates and do not distinguish between institutions.
For a policymaker. In percentage terms, credit growth since 2015 has been led by business loans, not mortgages. The Bank of Canada describes rate-sensitive sectors such as housing as often the first to slow when rates rise, so the mortgage book may be where an interest-rate effect shows first.
What the data cannot say. The three tables are national and in current dollars. There is no information on delinquency, loan-to-income distribution or lending by province, and the series are for chartered banks, not credit unions or non-bank lenders. Nothing here is a forecast.
What to watch
Statistics Canada's monthly release of the Bank of Canada chartered-bank series, its quarterly national balance sheet accounts and its quarterly financial statistics show whether balances, payment burdens and bank earnings are changing; the Bank of Canada's next Financial Stability Report states whether arrears and past-due loans have moved. No open table of arrears or delinquency rates is held here, and no source cited here gives a forecast of loan growth or bank earnings.
Prepared with AI assistance.
Follow the relationships
- Household mortgage debt-servicing costs 4 with evidence · 4 recorded Open in Studio
- Household spending 1 with evidence · 1 recorded Open in Studio
Sources for this section (3 datasets, 4 documents)
Data
- Chartered banks, assets and liabilities, month-end, Bank of Canada (10-10-0109-01; 4 series; latest August 2026; retrieved 2026-10-25)
- Debt service indicators of households, national balance sheet accounts (11-10-0065-01; 3 series; latest Q2 2026; retrieved 2026-10-25)
- Quarterly balance sheet, income statement and selected financial ratios, by financial industries, non seasonally adjusted (33-10-0227-01; 1 series; latest Q2 2026; retrieved 2026-10-25)
Documents cited
- Bank of Canada: Financial Stability Report 2026: Households (22 May 2026) (retrieved 2026-10-25)
- Bank of Canada: Financial Stability Report 2026: Banks (retrieved 2026-10-25)
- Bank of Canada: Financial Stability Report 2026: Non-financial businesses (retrieved 2026-10-25)
- Bank of Canada: Tiff Macklem, Governor: Monetary policy at work, remarks to CFA Québec (7 February 2023) (retrieved 2026-11-07)
Each dataset is used under its licence; attribution and series-level detail are in each chart’s “About this data” panel. Limitations: The loan series are month-end balances of chartered banks only: they leave out credit unions, caisses populaires, trust and mortgage companies, non-bank lenders and, depending on how the series is compiled, mortgages that banks have sold or securitised (the table's metadata does not say), so they are not total credit in the economy (the household credit-market-debt ratio in the financial-vulnerability section covers all lenders). Balances are levels in current dollars and are not seasonally adjusted, nor adjusted for inflation, house prices or population. 'Personal loans' as published includes credit card loans, personal lines of credit and other personal loans, so it must not be added to the credit card series. The debt service ratio is a national aggregate: it is total principal and interest payments divided by disposable income and says nothing about which households pay most. The bank return-on-equity series covers banking and other depository credit intermediation as one industry group from 2020 only, is unadjusted, and is published as a ratio without a statement in the table metadata of whether it is annualised. No open table of delinquency or arrears rates is held here: the Bank of Canada's statements about arrears and past-due loans are quoted, not charted, and bank capital ratios are known here only from the Bank's report, not from a series. Branch- and province-level lending is not held here.
Is Canada building enough homes, and what is happening to what they cost?
In September 2026 housing starts ran at an annual rate of 248,896 units; over the year new-home prices changed -2.0% and rents rose 2.8%
Graphic: Prices, starts, borrowing cost and rent
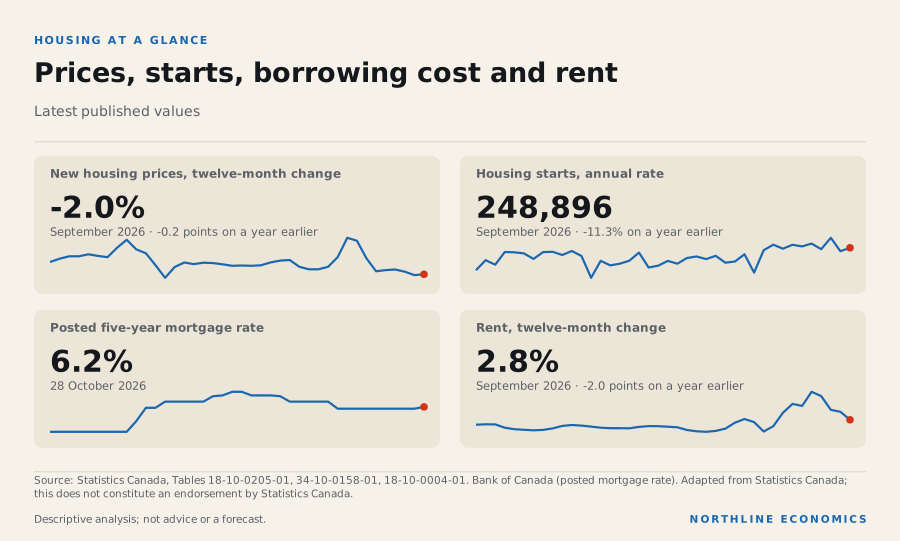
What happened
Housing starts were 248,896 at a seasonally adjusted annual rate in September 2026, a pace that fell 11.3% from a year earlier and is close to the ten-year average of 237,592 (the latest month is a single monthly reading). The peak of the decade was 319,843 in March 2021. Real residential investment is 22.9% below its Q1 2021 peak and the value of new residential building construction in August 2026 changed -1.1% from a year earlier. The New Housing Price Index changed -2.0% over the year, is -2.4% compared with February 2022 and peaked in August 2022. The CPI rent index rose 2.8%.
Housing starts, seasonally adjusted annual rate
Units per year, Canada, all areas.
Chart loads when it comes into view.
Latest values: Canada 248,900 (2026-09).
Related relationships: Residential construction · 2 relationships use this data as evidence
New Housing Price Index, Canada
December 2016 = 100 (index) and 12-month change (derived).
Chart loads when it comes into view.
Latest values: New housing prices, 12-month change -2.04 (2026-09).
Related relationships: 2 relationships use this data as evidence
CMHC reported that the six-month trend of housing starts was virtually flat in September, and its deputy chief economist said a key risk for Canada is not building enough during this period of softening housing markets across the country.
Evidence: Canada Mortgage and Housing Corporation: Housing starts and construction data, September 2026
How much is being built, per person
National starts hide large differences in what each province is doing relative to its size. Dividing each province’s average annual starts over the last twelve months by its population shows how much it is building per resident.
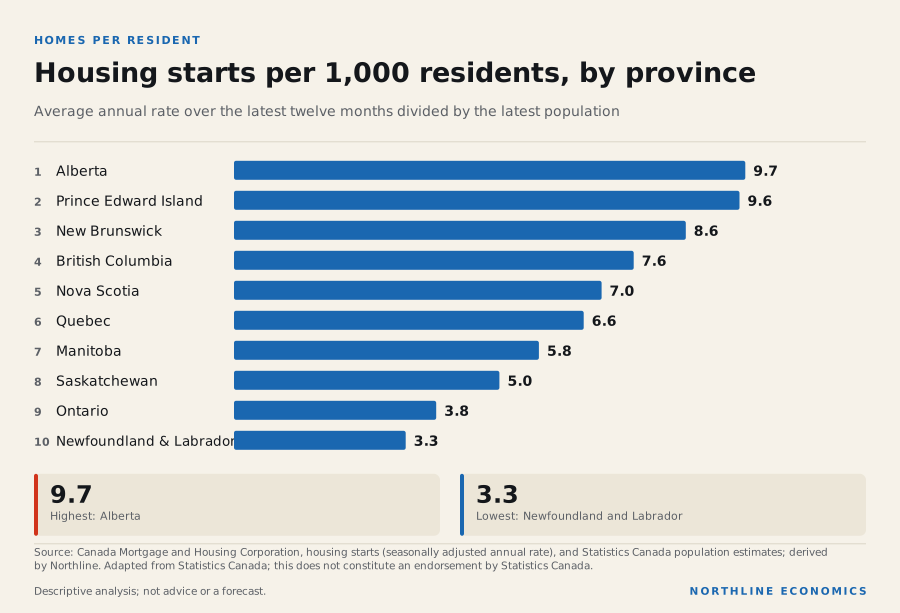
The data behind this graphic
| Item | Value |
|---|---|
| Alberta | 9.7 |
| Prince Edward Island | 9.6 |
| New Brunswick | 8.6 |
| British Columbia | 7.6 |
| Nova Scotia | 7.0 |
| Quebec | 6.6 |
| Manitoba | 5.8 |
| Saskatchewan | 5.0 |
| Ontario | 3.8 |
| Newfoundland and Labrador | 3.3 |
Alberta is building 9.7 homes a year for every 1,000 residents, the most of any province, followed by Prince Edward Island (9.6) and New Brunswick (8.6). British Columbia is at 7.6, Quebec at 6.6 and Ontario at 3.8, lower than all but Newfoundland and Labrador (3.3). Ontario has 16.3 million people, the largest population, and builds at less than half of Alberta’s rate.
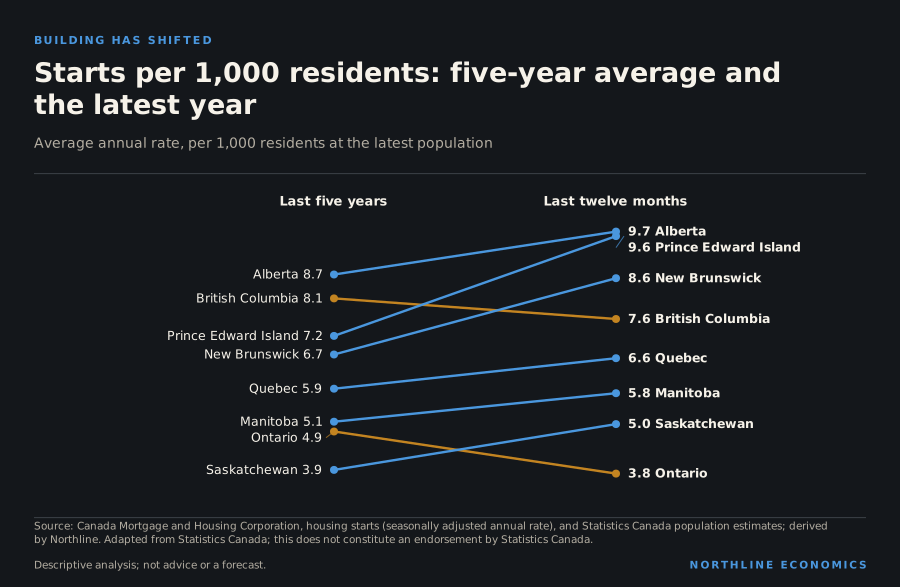
The data behind this graphic
| Item | Last five years | Last twelve months |
|---|---|---|
| Alberta | 8.7 | 9.7 |
| British Columbia | 8.1 | 7.6 |
| Quebec | 5.9 | 6.6 |
| Ontario | 4.9 | 3.8 |
| Saskatchewan | 3.9 | 5.0 |
| Manitoba | 5.1 | 5.8 |
| Prince Edward Island | 7.2 | 9.6 |
| New Brunswick | 6.7 | 8.6 |
The comparison with the last five years shows who has changed. The ratio rose in eight provinces and fell in Ontario and British Columbia. Ontario’s rate per resident was 4.9 over five years and is 3.8 over the last twelve months. British Columbia’s is down too (8.1 to 7.6). Alberta’s has risen, from 8.7 to 9.7, and so have Prince Edward Island’s and New Brunswick’s. Alberta’s rise coincides with the fastest population growth among the provinces, as the regions section shows; Ontario’s decline comes as its population growth has slowed sharply, to 0.3% in the four quarters to 1 July 2026. The ratio uses the latest population for both periods, so it is a comparison of building, not of building per resident at the time.
Starts are units begun. CMHC's Fall 2026 Housing Supply Report says that rental construction is carrying supply while condominium and ground-oriented construction has weakened sharply in major cities including Toronto, Vancouver, Ottawa and Montréal. The series here cannot show the split by tenure, so it cannot say whether that explains the falls in Ontario and British Columbia.
Evidence: Canada Mortgage and Housing Corporation: Fall 2026 Housing Supply Report
Prices, rents and pay
The three measures of housing cost have moved differently since 2019. The New Housing Price Index measures what builders charge for new homes and does not include resale prices, which are not in this report’s series. It is 16.2% above December 2019. Rents, by contrast, are up 33.9%, and the mortgage interest cost index, which reflects the interest that owners pay, is up 54.2%. Average hourly wages are up 32.3% (to October 2026, a month later than the price series).
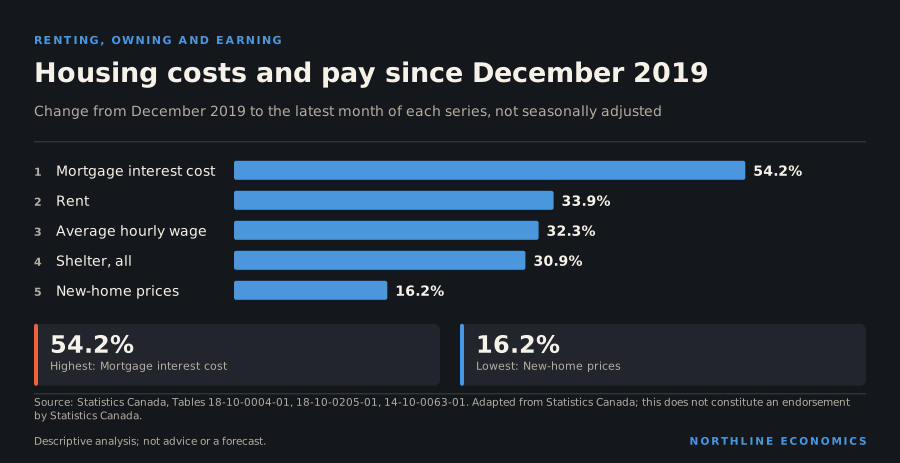
The data behind this graphic
| Item | Value |
|---|---|
| Mortgage interest cost | 54.2% |
| Rent | 33.9% |
| Average hourly wage | 32.3% |
| Shelter, all | 30.9% |
| New-home prices | 16.2% |
Put against pay, a renter’s housing cost has risen a little faster than the average wage (33.9% against 32.3%), and the mortgage interest cost index, which reflects the interest that owners with a mortgage pay, has risen by far more. Of the three measures, the price of a new home is the one that has risen by less than pay. That fact is less reassuring than it looks. The index has fallen from its high (4.7% below the August 2022 peak), but financing a purchase costs more than in 2021: the posted five-year mortgage rate was 6.19% on 28 October 2026, against 4.79% at the end of 2021. Affordability depends on the price, the interest rate and income together, and the three series here do not combine them.
City by city
New-home prices have moved in two directions since February 2022.
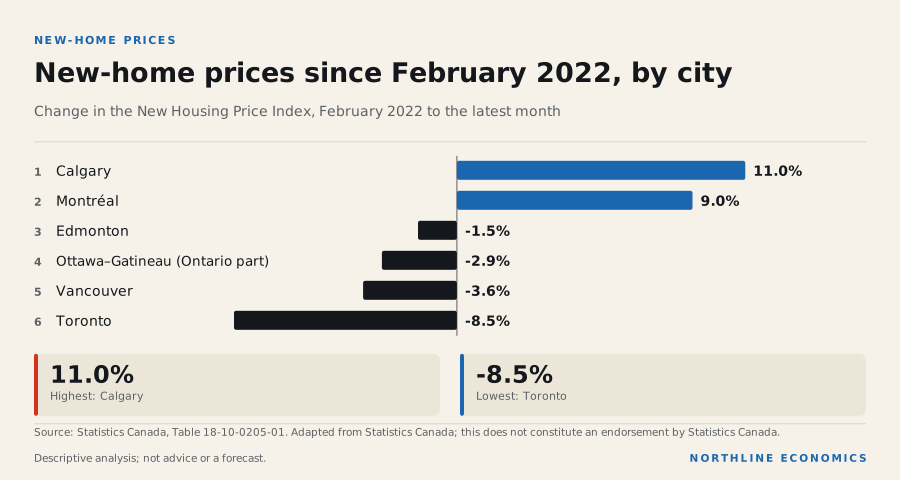
The data behind this graphic
| Item | Value |
|---|---|
| Calgary | 11.0% |
| Montréal | 9.0% |
| Edmonton | -1.5% |
| Ottawa–Gatineau (Ontario part) | -2.9% |
| Vancouver | -3.6% |
| Toronto | -8.5% |
Prices are higher in Calgary (11.0%) and Montréal (9.0%) and lower in Toronto (-8.5%), Vancouver (-3.6%), the Ontario part of Ottawa–Gatineau (-2.9%) and Edmonton (-1.5%). Montréal’s index is at its highest of the decade now, while Toronto’s is 9.2% below its March 2022 peak. Since the end of 2019, though, prices are up in every city shown: 42.9% in Montréal, 33.4% in Calgary, 16.2% in Vancouver and 2.4% in Toronto.
CMHC’s city estimates differ a great deal. Its summary table puts the additional homes needed each year to restore affordability at 42,000 to 56,000 in Montréal, 22,000 to 27,000 in Ottawa, 20,000 to 26,000 in Toronto, 5,000 to 7,000 in Vancouver and 4,000 to 5,000 in Calgary, with no measurable housing supply gap in Edmonton. These are CMHC’s model-based estimates and depend on its affordability target.
Evidence: Canada Mortgage and Housing Corporation: Fall 2026 Housing Supply Report
Why it happened
Starts reflect developers' decisions, which depend on financing costs, construction costs, approvals and expected sales or rents. None of these is decomposed here. One observation from the data stands out: over the twelve months to September 2026 the number of units under construction changed by 9.2% in Montréal, 4.1% in Ottawa–Gatineau, 4.0% in Edmonton, 2.1% in Calgary, -2.3% in Vancouver and -4.2% in Toronto.
The Bank of Canada says rate-sensitive sectors such as housing often slow first when borrowing costs rise, and CMHC says rental construction is carrying supply while ownership construction (condominiums and ground-oriented homes) has weakened sharply in major cities including Toronto, Vancouver, Ottawa and Montréal. Together, that suggests the composition of building, not only its pace, has shifted toward rentals; this report cannot show the split because it does not hold starts by tenure.
Evidence: relationship: Household mortgage debt-servicing costs and Housing demand; Canada Mortgage and Housing Corporation: Housing starts and construction data, September 2026; Canada Mortgage and Housing Corporation: Fall 2026 Housing Supply Report; Bank of Canada: Tiff Macklem, Governor: Monetary policy at work, remarks to CFA Québec (7 February 2023)
Investment in new building construction, by type
C$ billions per month, current dollars, not seasonally adjusted.
Chart loads when it comes into view.
Latest values: Residential 8.579 (2026-08); Industrial 1.024 (2026-08); Commercial 1.547 (2026-08); Institutional and governmental 1.363 (2026-08).
Related relationships: Residential construction
Why it matters
Housing is a major household asset and expense (the shelter price and household debt series in this report show the scale), and it connects population, borrowing and the construction industry. CMHC defines its supply gap as the difference between the homes needed each year to restore pre-pandemic affordability by 2036 (about 417,000 to 469,000 nationally) and the roughly 231,000 it expects under current trends, a gap it puts at 187,000 to 238,000 homes a year over the next decade. The latest monthly pace of 248,896 (a seasonally adjusted annual rate) compares with those two annual figures. CMHC's numbers are model-based estimates that depend on its affordability target and population projections, and are not forecasts of what will be built.
Evidence: Canada Mortgage and Housing Corporation: Fall 2026 Housing Supply Report
Over the same period since February 2022, new-home prices for the country as a whole changed by -2.4% and the rent index by 27.5%; since the end of 2019 the rent index has risen 33.9%. The mortgage interest cost component of the CPI, which captures the cost of owning with a mortgage, is changing -0.2% a year, so renters and owners face different inflation (see the prices section).
History
Starts surged to 319,843 in March 2021 and have since settled near the decade average. New-home prices peaked in August 2022 and are lower now; the rent index's annual growth peaked at 8.9% in May 2024 and has slowed to 2.8%. Policy-rate changes and housing indicators are associated in the data, as the explorer shows (for example, a correlation of -0.30 between 12-month changes in the policy rate and in starts at a three-month lag). That is an association between overlapping 12-month changes, not an estimated effect.
Across geographies
New-home prices over the year changed -4.9% in Toronto, -2.1% in Vancouver, 0.0% in Calgary, -0.8% in Edmonton, 1.2% in Montréal and 1.0% in the Ontario part of Ottawa–Gatineau. Since February 2022 they changed 11.0% in Calgary and 9.0% in Montréal but -8.5% in Toronto and -3.6% in Vancouver. Starts by province (12-month averages) show Ontario at 62,390 units a year, Quebec at 60,190, Alberta at 49,529 and British Columbia at 43,325.
New housing price index by city, indexed
Total (house and land); start of period = 100. Ottawa–Gatineau is the Ontario part only.
Chart loads when it comes into view.
Latest values: Calgary 129.7 (2026-09); Edmonton 105.7 (2026-09); Toronto 105 (2026-09); Vancouver 123.4 (2026-09); and 2 more in the data table.
Related relationships: Calgary · Edmonton · Toronto · Vancouver
Housing starts by metropolitan area (12-month total)
Total units started over the previous 12 months; CMHC data distributed by Statistics Canada.
Chart loads when it comes into view.
Latest values: Calgary 24,400 (2026-09); Edmonton 19,060 (2026-09); Toronto 23,360 (2026-09); Vancouver 26,600 (2026-09); and 2 more in the data table.
Related relationships: Calgary · Edmonton · Toronto · Vancouver
Housing under construction by metropolitan area
Units under construction at month end, total units; CMHC data distributed by Statistics Canada.
Chart loads when it comes into view.
Latest values: Calgary 26,250 (2026-09); Edmonton 18,490 (2026-09); Toronto 88,110 (2026-09); Vancouver 61,680 (2026-09); and 2 more in the data table.
Related relationships: Calgary · Edmonton · Toronto · Vancouver
Housing starts by province (12-month average)
Seasonally adjusted annual rate, averaged over 12 months (smoothed); units per year. CMHC data distributed by Statistics Canada.
Chart loads when it comes into view.
Latest values: Alberta 49,530 (2026-09); British Columbia 43,320 (2026-09); Saskatchewan 6,443 (2026-09); Manitoba 8,790 (2026-09); and 6 more in the data table.
Related relationships: Alberta · British Columbia · Saskatchewan · Manitoba
CMHC's city estimates differ sharply: it reports in its summary table that Calgary needs 4,000 to 5,000 additional units a year to restore affordability, Toronto 20,000 to 26,000, Vancouver 5,000 to 7,000, Montréal 42,000 to 56,000 and Ottawa 22,000 to 27,000, and that Edmonton has no measurable housing supply gap. It says Montréal's cost-to-income ratio rose from 34% to 48% since 2019. These are CMHC's model-based estimates, reproduced from its report.
Evidence: Canada Mortgage and Housing Corporation: Fall 2026 Housing Supply Report
Housing completions by metropolitan area (12-month total)
Units completed over the previous 12 months, total units; CMHC data distributed by Statistics Canada.
Chart loads when it comes into view.
Latest values: Calgary 23,830 (2026-09); Edmonton 18,250 (2026-09); Toronto 26,690 (2026-09); Vancouver 27,830 (2026-09); and 2 more in the data table.
Related relationships: Calgary · Edmonton · Toronto · Vancouver
What it influences
Residential construction supports employment in construction and related trades and feeds household spending through the wealth and moving effects that this report does not measure. Any link from housing costs to business investment and population growth is only a hypothesis (no source measures them here). The relationships that carry evidence are the policy-rate and mortgage-rate links (Bank of Canada) and the supply-affordability link (CMHC).
Risks
CMHC's deputy chief economist said that affordability gains since 2023 will be difficult to sustain unless construction rises.
Evidence: Canada Mortgage and Housing Corporation: Housing starts and construction data, September 2026
The slowdown in population growth (see the population section) could reduce demand in the cities that host the most international students and temporary workers, though no source here measures that effect.
Evidence: Statistics Canada: The Daily: Canada's population estimates, second quarter 2026
What it means for decisions
For a developer or lender. Building per resident is highest in Alberta, where population is growing fastest among the provinces. The ratio rose in eight provinces and fell in Ontario and British Columbia. New-home price changes do not line up with population growth across these cities.
For a renter. Rents are up by about as much as average pay since 2019 and rose 2.8% over the last year, after a peak of 8.9% in May 2024. That is a slowing rise, not a fall.
For a buyer. The price of a new home is lower than at its peak in most cities. The cost of financing it is higher than in 2021, and the interest-rates section shows by how much.
For a policymaker. The supply gap is a national total, and CMHC says the national estimate masks important differences across markets. The data here show how much provinces differ in what they build per resident, and CMHC’s city estimates show how much the need differs. The national total hides how well the two fit.
Evidence: Canada Mortgage and Housing Corporation: Fall 2026 Housing Supply Report
What the data cannot say. The per-resident starts ratio uses the latest population for both periods. Starts are units begun, not completed, and are not split by tenure. The New Housing Price Index does not cover resale prices. Nothing here is a forecast.
What to watch
The monthly CMHC housing starts release (mid-month), Statistics Canada's New Housing Price Index and investment in building construction (see the release calendar), the Bank of Canada's next announcement on 9 December 2026, and CMHC's next housing supply report.
Prepared with AI assistance.
Follow the relationships
- Residential construction 2 with evidence · 2 recorded Open in Studio
- Housing costs (prices and rents) 1 with evidence · 1 recorded Open in Studio
- Housing demand 2 with evidence · 2 recorded Open in Studio
- Prime and posted mortgage rates 4 with evidence · 4 recorded Open in Studio
Upcoming releases
- 2026-11-19 Investment in building construction September 2026 · Statistics Canada
Sources for this section (9 datasets, 3 documents)
Data
- Canada Mortgage and Housing Corporation, housing starts, all areas, Canada and provinces, seasonally adjusted at annual rates, monthly (34-10-0158-01; 5 series; latest September 2026; retrieved 2026-10-23)
- Gross domestic product, expenditure-based, Canada, quarterly (36-10-0104-01; 1 series; latest Q2 2026; retrieved 2026-10-23)
- Investment in Building Construction (34-10-0293-01; 1 series; latest August 2026; retrieved 2026-10-23)
- New housing price index, monthly (18-10-0205-01; 8 series; latest September 2026; retrieved 2026-10-23)
- Consumer Price Index, monthly, not seasonally adjusted (18-10-0004-01; 4 series; latest September 2026; retrieved 2026-10-23)
- Population estimates, quarterly (17-10-0009-01; 1 series; latest 1 July 2026; retrieved 2026-10-23)
- Employee wages by industry, monthly, unadjusted for seasonality (14-10-0063-01; 1 series; latest October 2026; retrieved 2026-11-07)
- Conventional 5-year mortgage rate (posted) (V80691335; 1 series; latest 28 October 2026; retrieved 2026-11-03)
- Canada Mortgage and Housing Corporation, housing starts, under construction and completions in selected census metropolitan areas, monthly (34-10-0154-01; 6 series; latest September 2026; retrieved 2026-10-23)
Documents cited
- Canada Mortgage and Housing Corporation: Housing starts and construction data, September 2026 (retrieved 2026-10-22)
- Canada Mortgage and Housing Corporation: Fall 2026 Housing Supply Report (retrieved 2026-11-07)
- Bank of Canada: Tiff Macklem, Governor: Monetary policy at work, remarks to CFA Québec (7 February 2023) (retrieved 2026-11-07)
Each dataset is used under its licence; attribution and series-level detail are in each chart’s “About this data” panel. Limitations: Starts, under construction and completions are CMHC counts distributed by Statistics Canada (centres of 10,000 and over for the city series). The New Housing Price Index measures new homes, not resale prices; resale prices and rents beyond the CPI rent index are not shown because they are licensed or not held here. City series are census metropolitan areas; Ottawa–Gatineau price data cover the Ontario part only. National completions and affordability measures are not published here. The price indexes and the wage series are not seasonally adjusted, so changes measured from December 2019 include a small seasonal difference between December and the latest month.
How fast is Canada's population growing, where is the growth coming from, and which provinces and cities are feeling the change?
Population grew 0.5% in the year to 1 July 2026, as the number of non-permanent residents fell by 155 thousand
Graphic: Temporary residents: arrivals and departures
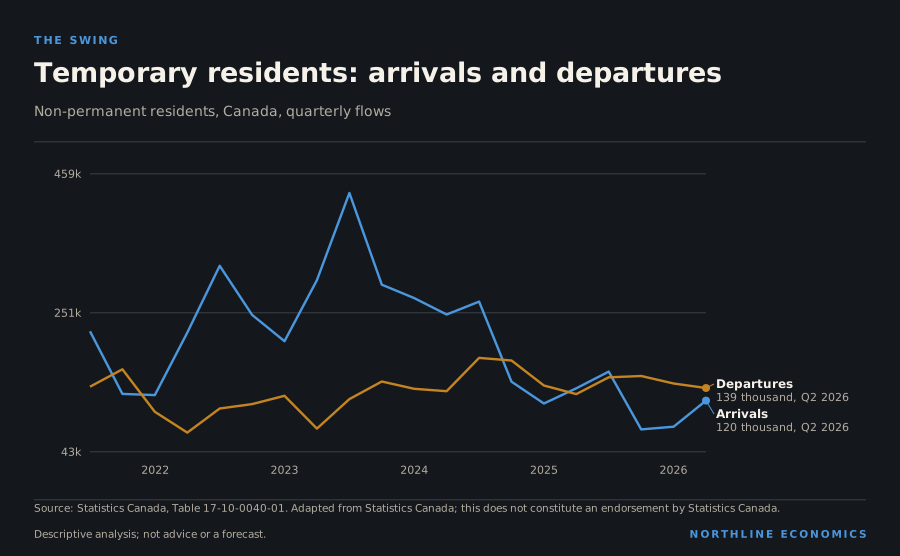
What happened
Canada's population was 41.8 million on 1 July 2026, 0.5% more than a year earlier and 0.2% more than at the start of the previous quarter. Over the last four quarters Canada received 368 thousand immigrants (new permanent residents). The number of non-permanent residents (temporary workers, international students and asylum claimants) changed by -155 thousand over the same four quarters, to 2.8 million, or 6.7% of the population. The peak was 3.0 million in Q4 2024. Net emigration was 62 thousand.
Immigrants and the net change in non-permanent residents
Persons per quarter. The non-permanent resident line is net inflows minus outflows.
Chart loads when it comes into view.
Latest values: Immigrants (new permanent residents) 99,150 (2026 Q2); Net change in non-permanent residents -18,880 (2026 Q2); Net emigration 12,890 (2026 Q2).
Related relationships: Population growth
Non-permanent residents in Canada
Persons at the start of each quarter, by permit type; the series begins in 2021 on current definitions.
Chart loads when it comes into view.
Latest values: All non-permanent residents 2.78 (2026 Q3); Work permit holders only 1.496 (2026 Q3); Study permit holders only 0.399 (2026 Q3).
Related relationships: Population growth
Statistics Canada reported that population growth continues to slow, that growth in the year to July was the lowest since the mid-1940s, that the number of non-permanent residents fell by the largest annual amount since comparable records began in the early 1970s (study-permit holders accounting for most of the decline), and that estimates of non-permanent residents were revised back to 2021 by more than usual.
Evidence: Statistics Canada: The Daily: Canada's population estimates, second quarter 2026
The arithmetic of a slowdown
The population changes by four things. People are born and die; permanent residents arrive; temporary residents come and go; and some residents emigrate. In the last four quarters, the population grew by 189 thousand, to 41.8 million.
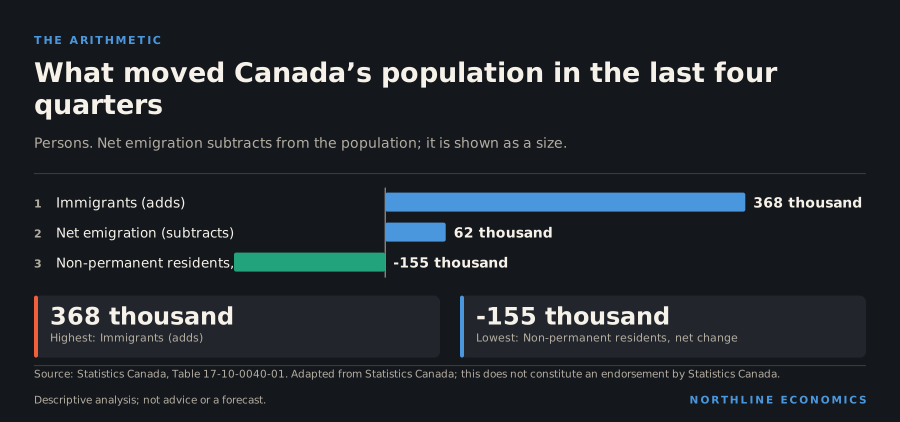
The data behind this graphic
| Item | Value |
|---|---|
| Immigrants (adds) | 368 thousand |
| Net emigration (subtracts) | 62 thousand |
| Non-permanent residents, net change | -155 thousand |
Immigrants added 368 thousand. Net emigration took away 62 thousand. The net change in non-permanent residents, who are temporary workers, students and asylum claimants, was -155 thousand. Natural increase (births less deaths) is not in these series; it makes up the difference between the sum of the three and the total change. The point is that the temporary-resident number moved from adding to subtracting. At its peak the net change was 308 thousand in a single quarter, in Q3 2023; its lowest was -80 thousand in Q4 2025.
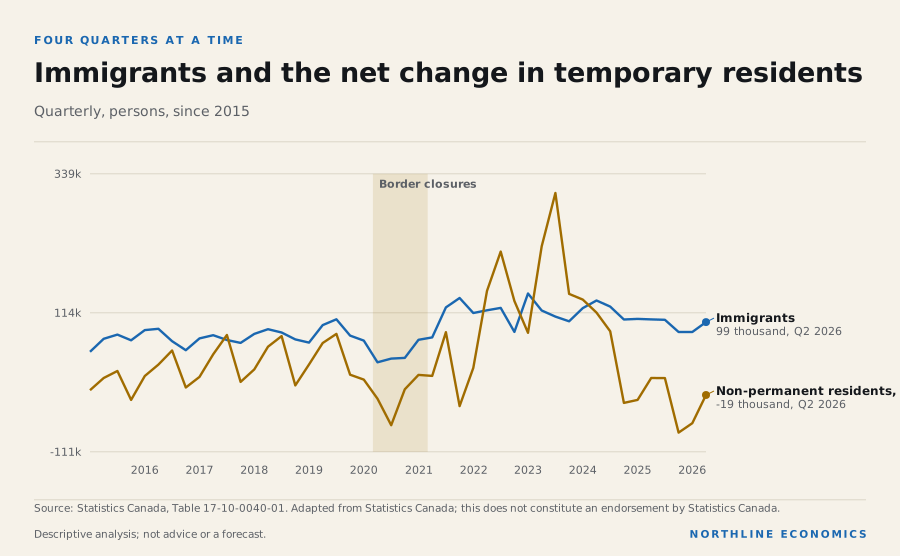
The data behind this graphic
| Series | Latest |
|---|---|
| Immigrants | 99 thousand, Q2 2026 |
| Non-permanent residents, net change | -19 thousand, Q2 2026 |
Temporary residents: in, then out
The stock of non-permanent residents, 2.8 million now, was 3.0 million at its peak in Q4 2024 and 1.3 million when the series begins in 2021. The fall has not been even. Study-permit holders have gone from 670 thousand in Q1 2024 to 399 thousand, a change of -40.5%. Work-permit holders peaked later, at 1.6 million in Q4 2025, and are 1.5 million now.
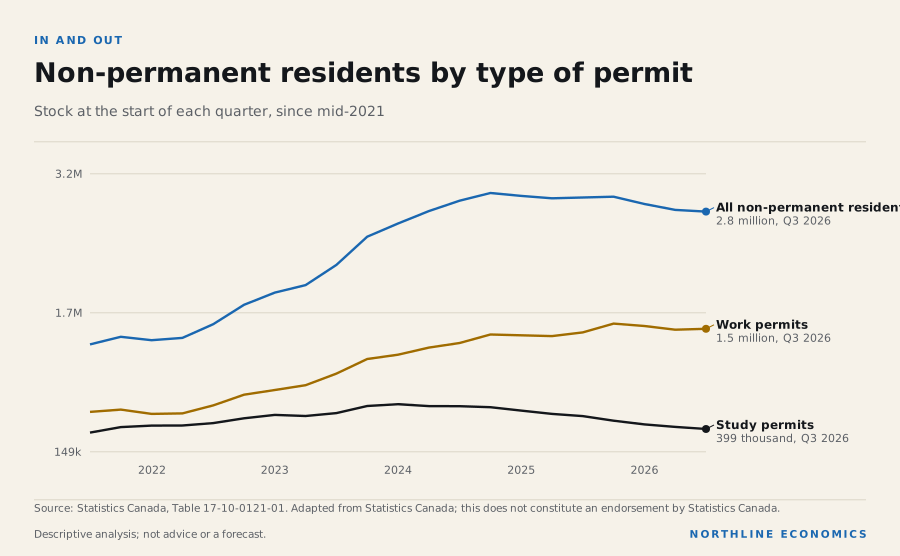
The data behind this graphic
| Series | Latest |
|---|---|
| All non-permanent residents | 2.8 million, Q3 2026 |
| Work permits | 1.5 million, Q3 2026 |
| Study permits | 399 thousand, Q3 2026 |
The two groups are different populations with different consequences. Work-permit holders are permitted to work, so a fall in their number can reduce labour supply as well as the number of households. The labour section shows that employment is only 0.1% higher than a year ago.
Who absorbed the change
The change was not spread evenly. Over four quarters the net change in non-permanent residents was -86 thousand in Ontario, -32 thousand in British Columbia and -22 thousand in Quebec, together about nine tenths of the national -155 thousand. Alberta’s was -7,957 and Manitoba’s -6,814; in New Brunswick it was 1,521.
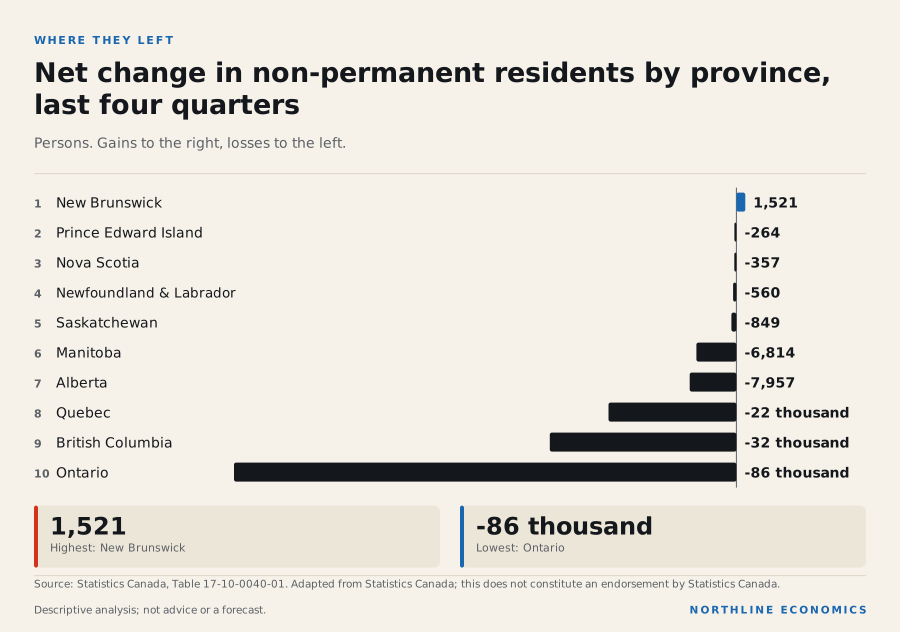
The data behind this graphic
| Item | Value |
|---|---|
| New Brunswick | 1,521 |
| Prince Edward Island | -264 |
| Nova Scotia | -357 |
| Newfoundland and Labrador | -560 |
| Saskatchewan | -849 |
| Manitoba | -6,814 |
| Alberta | -7,957 |
| Quebec | -22 thousand |
| British Columbia | -32 thousand |
| Ontario | -86 thousand |
That distribution matches the pattern of population growth in the regions section: the three provinces that lost the most temporary residents are the three whose population grew least (0.3% in Ontario, 0.2% in Quebec and 0.1% in British Columbia). Alberta’s population grew 1.5% while it lost 7,957 temporary residents, and interprovincial migration added 22 thousand people. The research note on population flows by province covers all four flows, and the one on six cities covers the cities.
The long view
Population has grown in each decade, but the path is not uniform.
| Quarter | Population |
|---|---|
| 1990 Q1 | 27.5 million |
| 2000 Q1 | 30.5 million |
| 2010 Q1 | 33.8 million |
| 2019 Q4 | 37.8 million |
| 2022 Q1 | 38.6 million |
| 2024 Q1 | 40.7 million |
| Latest | 41.8 million |
Since 1990 the population is up 52.2%, since 2000 36.9% and since 2010 23.6%. The recent years are a large part of those totals. Since the start of 2022 the population is up 8.4%, and since the start of 2024 only 2.8%: a surge, and then a slowdown to the pace Statistics Canada describes as the lowest since the mid-1940s.
Why it happened
The population changes by natural increase, immigration, the net movement of non-permanent residents and emigration. In the last four quarters, immigrants added 368 thousand, the net change in non-permanent residents subtracted 155 thousand and net emigration subtracted 62 thousand. The remaining difference is natural increase (births minus deaths) and statistical adjustments, which are not held here. The fall in study-permit holders is the largest piece of the non-permanent resident decline: over the year they changed by -26.1%, while work-permit holders changed by 2.7%.
Federal immigration levels set the number of new permanent residents and, through permit policy, the number of temporary residents. Immigration, Refugees and Citizenship Canada's 2026–2028 plan holds permanent resident admissions at 380,000 a year and sets new temporary resident arrivals at 385,000 for 2026. The 2027–2029 plan, released on 5 November 2026, keeps permanent resident admissions at 380,000 a year and sets new temporary resident arrivals at 370,000 a year. The sharp fall in non-permanent residents is consistent with that policy shift, though other factors may also matter and this report cannot separate them.
Evidence: YYC Economy, Calgary Economic Outlook 2027, sections 2 and 4; Statistics Canada: The Daily: Canada's population estimates, second quarter 2026; Immigration, Refugees and Citizenship Canada: Supplementary Information for the 2026-2028 Immigration Levels Plan; Immigration, Refugees and Citizenship Canada: Supplementary Information for the 2027-2029 Immigration Levels Plan
Why it matters
Population growth adds workers, consumers and households. When it slows sharply, so does the growth of the labour force, the demand for housing and the base for sales, tax revenue and public services.
Statistics Canada notes that population aging has resumed its trend after high immigration offset it in 2023 and 2024. An older population implies a lower participation rate, and a slower-growing one slower total (but not necessarily per-person) output growth, both visible in the labour and growth sections of this report.
Evidence: Statistics Canada: The Daily: Labour Force Survey, September 2026; Statistics Canada: The Daily: Canada's population estimates, second quarter 2026
For housing, fewer temporary residents could mean different demand in cities with large student populations. Whether they lower rent growth is a hypothesis. Rent inflation has fallen from its peak of 8.9% in May 2024 to 2.8% in September 2026, but this report does not attribute the decline to population.
Evidence: Statistics Canada: The Daily: Canada's population estimates, second quarter 2026
History
The population has risen 10.5% since the fourth quarter of 2019, most of it before the past year. The number of immigrants peaked at 145 thousand in Q1 2023 and the net inflow of non-permanent residents peaked at 308 thousand in Q3 2023 before turning negative, reaching -80 thousand in Q4 2025.
Across geographies
Growth over the past year was 1.5% in Alberta, 1.0% in Saskatchewan and 1.0% in New Brunswick but only 0.3% in Ontario, 0.2% in Quebec and 0.1% in British Columbia.
Statistics Canada notes that Ontario, Quebec and British Columbia receive the largest shares of international migrants and are therefore more affected by changes in international migration, and that Alberta grew fastest.
Evidence: Statistics Canada: The Daily: Canada's population estimates, second quarter 2026
Interprovincial migration is part of the Alberta story: net interprovincial migration added 22 thousand to Alberta's population over four quarters (1st of 10 among provinces) and removed 18 thousand from Ontario (10th of 10). The net change in non-permanent residents over four quarters was -86 thousand in Ontario, -32 thousand in British Columbia, -22 thousand in Quebec and -7,957 in Alberta.
Population by province, indexed
Quarterly estimates; start of period = 100.
Chart loads when it comes into view.
Latest values: Alberta 5,101,000 (2026 Q3); British Columbia 5,711,000 (2026 Q3); Saskatchewan 1,278,000 (2026 Q3); Manitoba 1,517,000 (2026 Q3); and 6 more in the data table.
Related relationships: Alberta · British Columbia · Saskatchewan · Manitoba
Immigrants by province (4-quarter total)
New permanent residents arriving over the previous four quarters.
Chart loads when it comes into view.
Latest values: Alberta 50,160 (2026 Q2); British Columbia 45,800 (2026 Q2); Saskatchewan 14,390 (2026 Q2); Manitoba 19,350 (2026 Q2); and 6 more in the data table.
Net change in non-permanent residents by province (4-quarter total)
Net inflows over the previous four quarters; negative = net outflow.
Chart loads when it comes into view.
Latest values: Alberta -7,957 (2026 Q2); British Columbia -31,810 (2026 Q2); Saskatchewan -849 (2026 Q2); Manitoba -6,814 (2026 Q2); and 6 more in the data table.
Net interprovincial migration (4-quarter total)
In-migrants minus out-migrants over the previous four quarters (derived).
Chart loads when it comes into view.
Latest values: Alberta 78,320 (2026 Q2); British Columbia 58,490 (2026 Q2); Saskatchewan 18,270 (2026 Q2); Manitoba 14,610 (2026 Q2); and 6 more in the data table.
City populations are annual estimates on 2021 boundaries and end in 2025, a year before the national series. They changed by 3.1% in Edmonton, 2.9% in Calgary, 2.3% in Ottawa–Gatineau, 0.5% in Montréal, 0.2% in Vancouver and 0.0% in Toronto in that year. Because they end in 2025, they may not show the 2026 fall in temporary residents.
Population by metropolitan area, indexed
July 1 estimates, 2021 boundaries; start of period = 100.
Chart loads when it comes into view.
Latest values: Calgary 1,836,000 (2025); Edmonton 1,692,000 (2025); Toronto 7,109,000 (2025); Vancouver 3,088,000 (2025); and 2 more in the data table.
Related relationships: Calgary · Edmonton · Toronto · Vancouver
What it influences
Population growth feeds labour supply, housing demand, consumer spending and tax revenue. Immigration policy feeds into population growth (a strongly evidenced accounting relationship). Population growth is linked to housing and rents by an observed association in Calgary and a hypothesis nationally.
Risks
Estimates of non-permanent residents are the most uncertain component and were revised by more than usual in 2026. Further revisions to the stock of temporary residents would change the population and per-capita figures in this report.
Statistics Canada said the revisions this year were larger than usual.
Evidence: Statistics Canada: The Daily: Canada's population estimates, second quarter 2026
What it means for decisions
For a landlord or developer. The fall in temporary residents is concentrated in Ontario, British Columbia and Quebec, the three most populous provinces. Whether rent growth falls as a result is a hypothesis. Rents rose 2.8% over the year to September 2026, after a peak annual rise of 8.9% in May 2024.
For an employer. The loss of work-permit holders from their peak is a loss of workers, not only of households, and it arrives while employment is flat. Sectors that rely on temporary workers may feel it first. The labour and industry sections show where employment is concentrated.
For a college or university. Study-permit holders are down 40.5% since the start of 2024, a change consistent with the federal plan cited above. Statistics Canada says the provinces that receive the largest share of international migrants are more affected by changes in those levels.
Evidence: Statistics Canada: The Daily: Canada's population estimates, second quarter 2026; Immigration, Refugees and Citizenship Canada: Supplementary Information for the 2026-2028 Immigration Levels Plan
For a government. A slower-growing population could lower growth in tax revenue and in demand for services, and the ageing trend has resumed; the long-run section shows how far ageing has gone. The levels plan is the policy variable.
What the data cannot say. Non-permanent resident estimates were revised by more than usual, as Statistics Canada notes. Natural increase and statistical adjustments are not in the series. City figures end a year before the national ones.
What to watch
The next quarterly population estimates, what the 2027–2029 levels plan released on 5 November 2026 does to arrivals, and whether the net outflow of non-permanent residents continues.
Prepared with AI assistance.
Follow the relationships
- Population growth 0 with evidence · 0 recorded Open in Studio
- Federal immigration levels 0 with evidence · 0 recorded Open in Studio
- Housing demand 2 with evidence · 2 recorded Open in Studio
Sources for this section (7 datasets, 4 documents)
Data
- Population estimates, quarterly (17-10-0009-01; 7 series; latest 1 July 2026; retrieved 2026-10-23)
- Estimates of the components of international migration, quarterly (17-10-0040-01; 9 series; latest Q2 2026; retrieved 2026-10-23)
- Estimates of the number of non-permanent residents by type, quarterly (17-10-0121-01; 3 series; latest Q3 2026; retrieved 2026-10-23)
- Labour force characteristics, monthly, seasonally adjusted and trend-cycle (14-10-0287-01; 1 series; latest October 2026; retrieved 2026-11-07)
- Estimates of the components of interprovincial migration, quarterly (17-10-0020-01; 2 series; latest Q2 2026; retrieved 2026-10-23)
- Consumer Price Index, monthly, not seasonally adjusted (18-10-0004-01; 1 series; latest September 2026; retrieved 2026-10-23)
- Population estimates, July 1, by census metropolitan area and census agglomeration, 2021 boundaries (17-10-0148-01; 6 series; latest 2025; retrieved 2026-10-23)
Documents cited
- Statistics Canada: The Daily: Canada's population estimates, second quarter 2026 (retrieved 2026-11-07)
- Immigration, Refugees and Citizenship Canada: Supplementary Information for the 2026-2028 Immigration Levels Plan (retrieved 2026-10-25)
- Immigration, Refugees and Citizenship Canada: Supplementary Information for the 2027-2029 Immigration Levels Plan (retrieved 2026-11-06)
- Statistics Canada: The Daily: Labour Force Survey, September 2026 (retrieved 2026-10-25)
Each dataset is used under its licence; attribution and series-level detail are in each chart’s “About this data” panel. Limitations: Components are Statistics Canada estimates and are revised, in 2026 by more than usual for non-permanent residents. Immigrants are new permanent residents. City population is annual (July 1, 2021 boundaries) and ends a year before the national quarterly series. The age structure and the labour-force effects of migration are not decomposed in this report.
How dependent is Canada on one customer and one commodity group, and how are tariffs changing the pattern?
The United States took 70.2% of Canada's goods exports in September 2026, down from a twenty-year high of 79.6% in February 2025
Graphic: What Canada sells and buys, by product
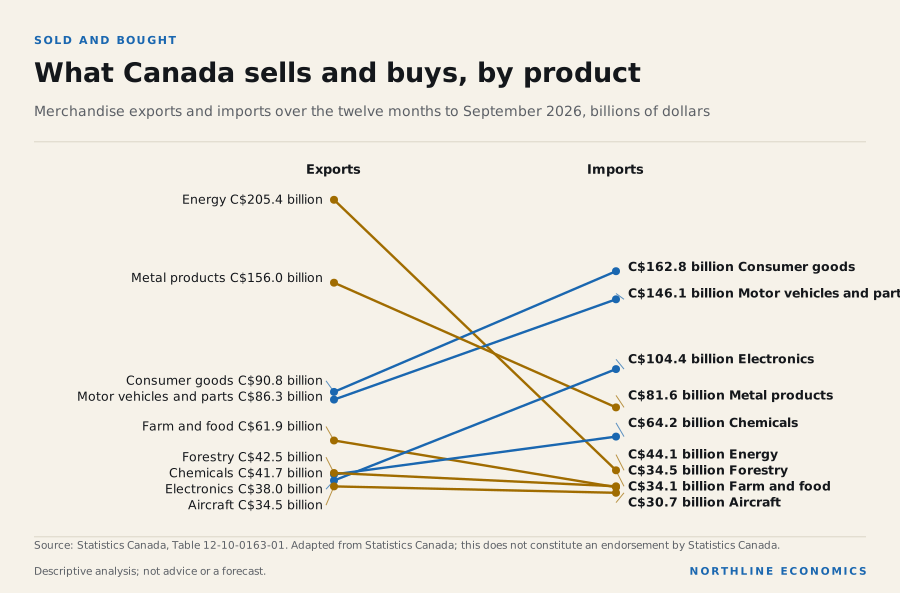
What happened
Canada's merchandise exports were C$78.6 billion in September 2026 and imports C$73.2 billion, a balance-of-payments surplus of C$5.4 billion. Exports to the United States were C$55.2 billion, 70.2% of the total, up from 69.9% in the previous month; the United States supplied 58.5% of imports. Against the same month a year earlier, exports to the United States changed by 20.4%, to China by 67.3%, to the United Kingdom by 52.9% and to the European Union by 3.9%. Most of these changes are large; this report does not separate timing effects, price effects and underlying demand.
Merchandise exports and imports
C$ billions per month, balance-of-payments basis, seasonally adjusted.
Chart loads when it comes into view.
Latest values: Exports 78.55 (2026-09); Imports 73.2 (2026-09).
Related relationships: Merchandise exports · 2 relationships use this data as evidence
The United States’ share of Canada’s goods trade
Percent of merchandise exports and imports, monthly, balance-of-payments basis, seasonally adjusted (derived).
Chart loads when it comes into view.
Latest values: Share of exports 70.2 (2026-09); Share of imports 58.5 (2026-09).
Related relationships: Merchandise exports · 1 relationship use this data as evidence
Statistics Canada reported that the goods surplus widened in September, that exports to the United States rose, mainly because of higher exports of crude oil and unwrought gold, and that exports to other countries fell for a second consecutive month after reaching a record high in July. It has also recorded that the United States announced new tariffs on a range of Canadian products on 22 July which took effect at the end of August, with some tariffs on electrical products removed in September, and that Canada announced tariffs on select American goods at the end of August.
Evidence: Statistics Canada: The Daily: Canadian international merchandise trade, September 2026; Statistics Canada: The Daily: Canadian international merchandise trade, August 2026
A balance built from opposites
The sum of Canada’s goods trade is small. Over the twelve months to September 2026 the balance is C$10.7 billion on a balance-of-payments basis, near zero against about C$865.7 billion of exports. The number is small because it is the sum of large numbers with opposite signs.
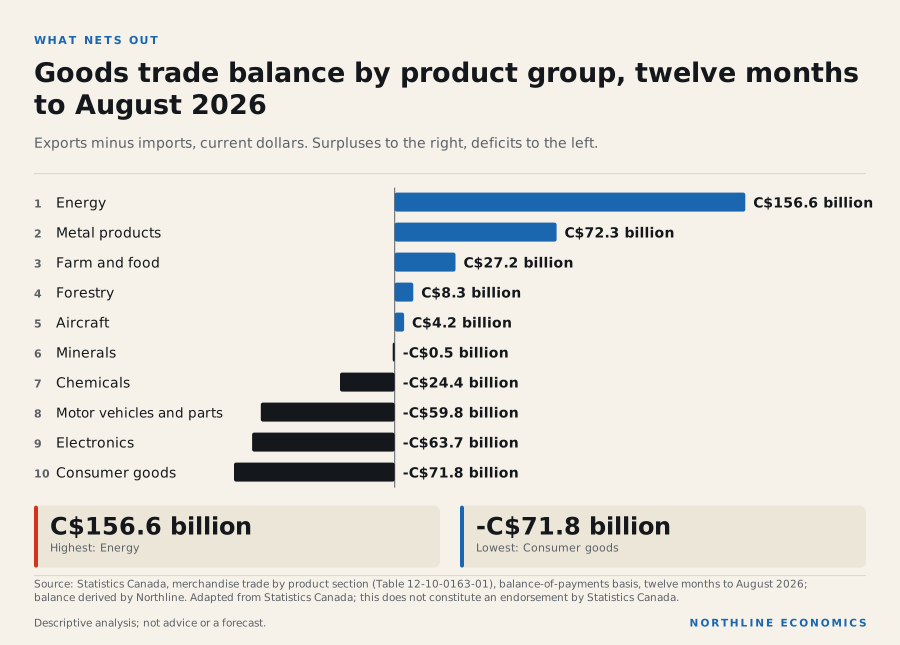
The data behind this graphic
| Item | Value |
|---|---|
| Energy | C$156.6 billion |
| Metal products | C$72.3 billion |
| Farm and food | C$27.2 billion |
| Forestry | C$8.3 billion |
| Aircraft | C$4.2 billion |
| Minerals | -C$0.5 billion |
| Chemicals | -C$24.4 billion |
| Motor vehicles and parts | -C$59.8 billion |
| Electronics | -C$63.7 billion |
| Consumer goods | -C$71.8 billion |
Energy has a surplus of C$156.6 billion over the twelve months to August 2026, of which crude oil alone is C$120.7 billion. Metal products have a surplus of C$72.3 billion, which in Statistics Canada’s classification includes precious metals such as gold (the gold price was US$4,411 an ounce in August 2026 against US$3,368 a year earlier), and farm and food products C$27.2 billion. Against that, consumer goods have a deficit of C$71.8 billion, electronics C$63.7 billion, motor vehicles and parts C$59.8 billion and chemicals C$24.4 billion.
The shape is the shape of a resource exporter: it sells raw and lightly processed materials and buys manufactured goods. It is also a reason that the trade balance is sensitive to commodity prices. A fall in energy prices would shrink the largest surplus, and the products Canada buys would not become cheaper by the same amount. The product groups overlap (crude oil is part of energy) and do not cover all goods, so they do not sum to the total. Motor vehicles and parts are a deficit because Canada imported C$146.1 billion of them over the twelve months to September 2026 and exported C$86.3 billion.
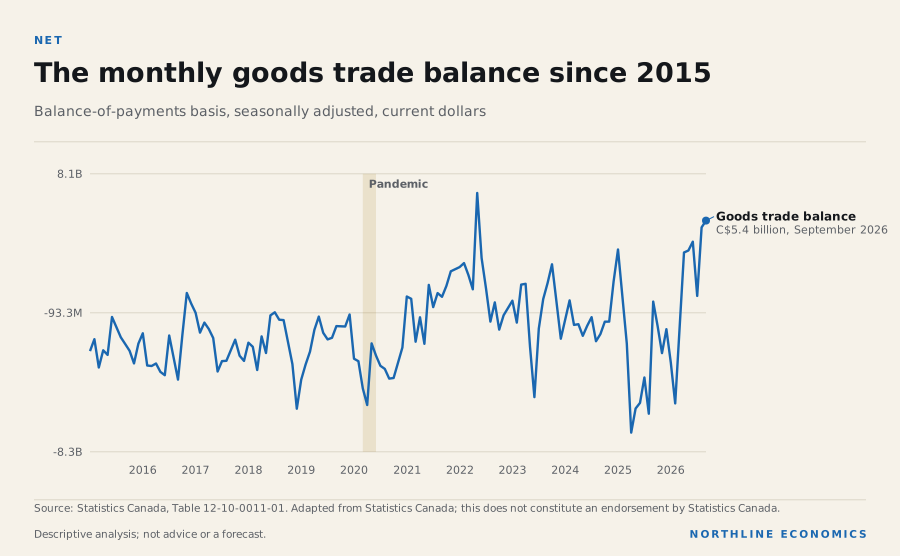
The data behind this graphic
| Series | Latest |
|---|---|
| Goods trade balance | C$5.4 billion, September 2026 |
The monthly balance swung from a surplus of C$7.0 billion in May 2022 to a deficit of C$7.2 billion in April 2025. Statistics Canada says in the release cited above that tariff announcements can change the timing of shipments, so monthly balances swing for that reason as well as for prices and volumes. It is C$5.4 billion in the latest month.
The exchange rate
One US dollar cost an average of C$1.41 in October 2026. It cost C$1.21 in May 2021, the low of the series, and C$1.44 in January 2025, the high. A weaker Canadian dollar raises the Canadian-dollar value of exports sold in US dollars, so part of the rise in dollar exports since 2019 is currency. The exchange-rate series begins in 2017 here, so a longer comparison is not available in this report.
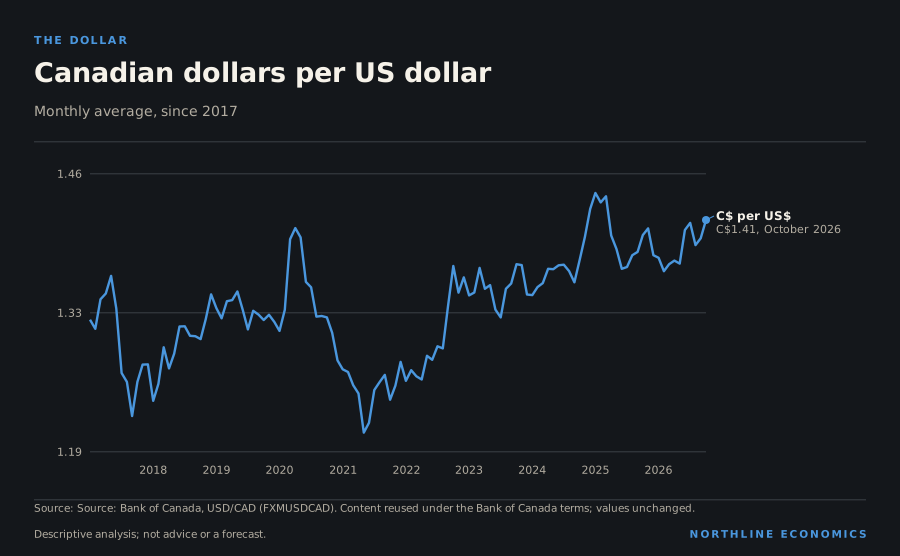
The data behind this graphic
| Series | Latest |
|---|---|
| C$ per US$ | C$1.41, October 2026 |
Dependence, province by province
The United States is the dominant customer for almost every province, but the dependence differs. In 2025, 90% of New Brunswick’s domestic exports went to the United States, 85% of Alberta’s and 80% of Prince Edward Island’s. British Columbia (51%), Saskatchewan (54%) and Newfoundland and Labrador (35%) are the least dependent.
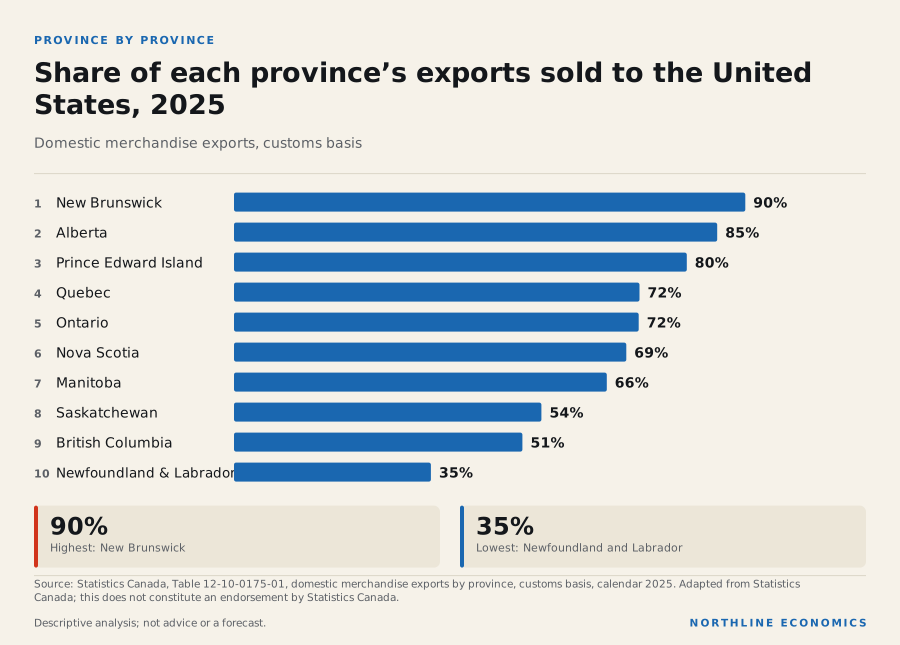
The data behind this graphic
| Item | Value |
|---|---|
| New Brunswick | 90% |
| Alberta | 85% |
| Prince Edward Island | 80% |
| Quebec | 72% |
| Ontario | 72% |
| Nova Scotia | 69% |
| Manitoba | 66% |
| Saskatchewan | 54% |
| British Columbia | 51% |
| Newfoundland and Labrador | 35% |
The research notes on Canada–United States trade, on Canada’s other trading partners and on provincial energy exports develop each of these in turn, with historical context and the structure of the agreements.
Why it happened
Statistics Canada notes that tariff announcements can prompt importers to bring shipments forward, which would inflate exports to the United States in the months before tariffs take effect and depress them afterwards. That link is a hypothesis: the release describes what can happen, and the size of any effect here is not measured.
Evidence: Statistics Canada: The Daily: Canadian international merchandise trade, August 2026
Exports of energy products are C$20.6 billion, 50.8% more than a year earlier, and crude oil exports are C$14.7 billion, 46.9% higher. The WTI price went from US$63.70 a barrel in September 2025 to US$96.90 in September 2026, so part of the change in export value is price rather than volume; this report does not split the two.
Statistics Canada attributes the rise in crude oil export value in August and September to higher prices, and noted in August that prices of refined petroleum exports were up more than half from a year earlier. Value rises with price even if volumes are flat, so export value is not a measure of how much was sold.
Evidence: Statistics Canada: The Daily: Canadian international merchandise trade, August 2026; Statistics Canada: The Daily: Canadian international merchandise trade, September 2026
Exports of energy, motor vehicles and food
C$ billions per month, seasonally adjusted.
Chart loads when it comes into view.
Latest values: Energy products (all) 20.64 (2026-09); Crude oil and bitumen 14.66 (2026-09); Motor vehicles and parts 7.332 (2026-09); Farm, fishing and food products 5.484 (2026-09).
Related relationships: 3 relationships use this data as evidence
Why it matters
Concentration is the key exposure. In calendar 2025, the United States took 72.3% of Canada's goods exports and supplied 45.9% of its imports on a customs basis; the United Kingdom, the next largest single partner in the table, took 6.0% of exports. Energy products make up 26.3% of exports now, against a low of 9.4% in April 2020 and a high of 29.2% in April 2022: when energy prices rise, the energy share of exports rises with them, and so does the economy's exposure to those prices.
Canada’s main trading partners, calendar 2025
Share of Canada’s merchandise exports and imports (customs basis). The European Union and its member countries overlap; shares must not be summed across rows. Merchandise only.
Chart loads when it comes into view.
Top values: United States 72.33%; United Kingdom 6%; European Union 5.52%.
Exports by destination
C$ billions per month, seasonally adjusted. The United States is plotted with the other main destinations.
Chart loads when it comes into view.
Latest values: United States 55.17 (2026-09); China 4.448 (2026-09); European Union 3.946 (2026-09); United Kingdom 4.958 (2026-09); and 1 more in the data table.
Related relationships: United States · Merchandise exports · 1 relationship use this data as evidence
In September 2026, motor vehicles and parts exports were C$7.3 billion and consumer goods exports C$7.7 billion.
Statistics Canada reported a large drop in imports of motor vehicles and parts in August, the largest decline among import product sections.
Evidence: Statistics Canada: The Daily: Canadian international merchandise trade, August 2026
History
The United States share of exports ranged from 64.7% in April 2020 to 79.6% in February 2025 over twenty years and averaged 74.0% over ten. Energy's share of exports has ranged from 9.4% in April 2020 to 29.2% in April 2022. One US dollar cost C$1.41 in October 2026, a change of 1.0% from a year earlier and of 13.7% from five years earlier, having peaked at C$1.44 in January 2025.
Exports by commodity group, indexed
Monthly, balance-of-payments basis, seasonally adjusted; start of the period = 100.
Chart loads when it comes into view.
Latest values: Energy products 20,640,000,000 (2026-09); Motor vehicles and parts 7,332,000,000 (2026-09); Farm, fishing and food products 5,484,000,000 (2026-09); Forestry and building materials 3,424,000,000 (2026-09); and 4 more in the data table.
Related relationships: 2 relationships use this data as evidence
Across geographies
Exposure differs sharply by province. In 2025, 90% of New Brunswick's domestic goods exports and 85% of Alberta's went to the United States, against 35% for Newfoundland and Labrador and 51% for British Columbia; Ontario and Quebec, whose exports are mainly manufactured, were at 72% and 72%. Energy products made up 76% of Alberta's domestic exports, 54% of Newfoundland and Labrador's, 38% of New Brunswick's and 33% of Saskatchewan's but only 1% of Ontario's.
Where each province’s goods exports go, and what they are, 2025
Share of each province’s domestic merchandise exports (customs basis). A measured exposure of export value to one market or one commodity group, not an estimate of how much income or employment depends on it.
Chart loads when it comes into view.
Top values: New Brunswick 90.4%; Alberta 85.43%; Prince Edward Island 80.05%.
These are measured shares of export value by province of origin. They show where a change in US demand, US tariffs or energy prices would first appear in export values; they do not measure employment or income effects, and the explorer says so on each of the exposure edges. City exposure is not measured here. Statistics Canada does publish the value of exports by census metropolitan area (Table 12-10-0137-01, trade in goods by exporter characteristics), but on a different basis from these province-of-origin figures, and those figures are not held in the data library.
What it influences
Exports drive manufacturing and resource output, transportation and port activity, and provincial revenue. The relationship explorer records the documented exposures (US share by province, energy share by province, motor vehicles in exports). The effects of US trade policy on manufacturing and logistics are hypotheses, and the effect of the exchange rate on exporters is not measured here.
The explorer's link from oil prices to energy investment and national income rests on a statement to Parliament by a Bank of Canada official in March 2015, who said that the energy price decline then under way would reduce aggregate income and that business investment in the oil and gas sector was anticipated to fall by about a third in 2015.
For the world trade backdrop, tariff events documented so far and the other economies' trade openness, see the Global report and its tariffs section; the United States took 72% of Canada's goods exports in 2025.
Risks
In its October 2026 Monetary Policy Report, as in July, the Bank of Canada named Canada’s trade relationship with the United States as one of the two most important risks to the outlook for inflation; in October the other was the evolution of energy prices. At the joint review on 1 July 2026 the United States did not agree to renew the Canada-United States-Mexico Agreement in its current form, so it was not renewed. Canada supported renewal. The agreement remains in force until 2036 and can be renewed at any time for another 16-year period. Under its terms, when a party does not confirm an extension at the six-year review, the parties must hold a joint review every year for the rest of the term.
Evidence: Bank of Canada: Monetary Policy Report, October 2026: Risks; Bank of Canada: Monetary Policy Report, July 2026: Overview; Office of the United States Trade Representative: Ambassador Greer Issues Statement on the USMCA Joint Review; Global Affairs Canada: Statement by Minister LeBlanc following trilateral CUSMA joint review meeting; Global Affairs Canada: Canada-United States-Mexico Agreement (CUSMA): Chapter 34, Final provisions (consolidated text)
The United States has since added tariffs under Section 338 of its Tariff Act of 1930. On 20 July 2026 it announced additional tariffs of 50% on certain goods of Canada, in response to what it called Canada's discriminatory treatment of US motor vehicles, alcoholic beverages and dairy; the US Trade Representative put the imports covered at nearly US$20 billion. After a three-day suspension the tariffs took effect on 22 August 2026, and they apply whether or not the goods qualify as originating under the Canada-United States-Mexico Agreement. On 8 September the United States banned some of the Canadian products concerned from entry, with effect from 29 September, and changed the list of goods covered; it changed the list again with effect from 30 October.
Evidence: The White House (Fact Sheet): Fact Sheet: President Donald J. Trump Imposes Additional Tariffs on Canada (Section 338, 20 July 2026); Office of the United States Trade Representative: Ambassador Greer Issues Statement on President Trump Imposing Section 338 Tariffs on Canada; The White House (Presidential Actions): Temporary Suspension of Additional Duties to Offset Canadian Discrimination Against the Commerce of the United States With Respect to Alcoholic Beverages, Dairy, and Motor Vehicles (Proclamation, 18 August 2026); The White House (Fact Sheet): Fact Sheet: President Donald J. Trump Responds to Canada's Retaliation (Section 338, 8 September 2026); The White House (Fact Sheet): Fact Sheet: President Donald J. Trump Further Modifies Canadian Products Subject to Tariffs under Section 338 (23 October 2026)
The Department of Finance reported that customs import duties fell in April to June 2026 after countermeasures to US tariffs were repealed. Budget 2026 forecasts them to rise by 7.8% in 2026-27, mainly because new Canadian counter tariffs, and higher rates on some existing ones, have applied since 8 September 2026, and it assumes the countermeasures stay in place into 2027-28. Federal revenue therefore also depends on trade policy. Tariff coverage by product, rates, exemptions and supply-chain vulnerabilities are not assessed here because tariff schedules are not held here.
Evidence: Department of Finance Canada: The Fiscal Monitor, June 2026; Department of Finance Canada: Budget 2026, Annex 1: Details of economic and fiscal projections
What it means for decisions
For an exporter. A balanced total conceals strong segments and weak ones. The sectors with surpluses (energy, metals, farm and food) sell to a world market whose prices move; the sectors with deficits (consumer goods, electronics, vehicles) compete with imports at home. Which side a business is on determines its exposure to prices and to tariffs.
For an importer. The products with the largest deficits are those Canada buys far more of than it sells. Tariffs and a weaker dollar can raise their cost, and in September the Bank of Canada said tariffs could pass through to consumer prices over time.
Evidence: Bank of Canada: Bank of Canada maintains the policy rate (2 September 2026)
For a provincial government. A province selling nine tenths of its exports to one country is more exposed to its trade policy than one selling half. In 2025 the largest dependences were in New Brunswick, Alberta and Prince Edward Island.
For a policymaker. The target of doubling non-US exports in a decade, cited in the transportation section, would be a large change from the present shares.
What the data cannot say. The product groups are broad. The monthly figures are volatile and affected by the timing of tariff announcements. Value is not volume, and no tariff schedules are held here.
What to watch
The October trade release on 8 December 2026, monthly US share of exports (does it stay near its recent level?), the effect of tariffs on autos and electrical products, and energy prices. The release calendar lists the next dates.
Prepared with AI assistance.
Follow the relationships
- United States 12 with evidence · 12 recorded Open in Studio
- US tariff announcements and Canadian counter-measures (2026) 0 with evidence · 0 recorded Open in Studio
- Merchandise exports 4 with evidence · 4 recorded Open in Studio
- Canadian dollar (C$ per US$) 1 with evidence · 1 recorded Open in Studio
- Manufacturing 12 with evidence · 12 recorded Open in Studio
Upcoming releases
- 2026-12-08 Canadian international merchandise trade October 2026 · Statistics Canada
Sources for this section (4 datasets, 16 documents)
Data
- International merchandise trade for all countries and by Principal Trading Partners, monthly (12-10-0011-01; 9 series; latest September 2026; retrieved 2026-11-05)
- Gold, monthly average price (Pink Sheet (monthly prices); 2 series; latest October 2026; retrieved 2026-11-05)
- International merchandise trade by commodity, monthly (12-10-0163-01; 6 series; latest September 2026; retrieved 2026-11-05)
- USD/CAD monthly average exchange rate (C$ per 1 USD), counterparty US (FXMUSDCAD; 1 series; latest October 2026; retrieved 2026-11-05)
Documents cited
- Statistics Canada: The Daily: Canadian international merchandise trade, September 2026 (retrieved 2026-11-06)
- Statistics Canada: The Daily: Canadian international merchandise trade, August 2026 (retrieved 2026-10-22)
- Bank of Canada: Rhys Mendes, Opening Statement before the House of Commons Standing Committee on Finance, 12 March 2015 (retrieved 2026-11-07)
- Bank of Canada: Monetary Policy Report, October 2026: Risks (retrieved 2026-11-07)
- Bank of Canada: Monetary Policy Report, July 2026: Overview (retrieved 2026-10-25)
- Office of the United States Trade Representative: Ambassador Greer Issues Statement on the USMCA Joint Review (retrieved 2026-11-06)
- Global Affairs Canada: Statement by Minister LeBlanc following trilateral CUSMA joint review meeting (retrieved 2026-11-06)
- Global Affairs Canada: Canada-United States-Mexico Agreement (CUSMA): Chapter 34, Final provisions (consolidated text) (retrieved 2026-11-07)
- The White House (Fact Sheet): Fact Sheet: President Donald J. Trump Imposes Additional Tariffs on Canada (Section 338, 20 July 2026) (retrieved 2026-11-07)
- Office of the United States Trade Representative: Ambassador Greer Issues Statement on President Trump Imposing Section 338 Tariffs on Canada (retrieved 2026-11-07)
- The White House (Presidential Actions): Temporary Suspension of Additional Duties to Offset Canadian Discrimination Against the Commerce of the United States With Respect to Alcoholic Beverages, Dairy, and Motor Vehicles (Proclamation, 18 August 2026) (retrieved 2026-11-07)
- The White House (Fact Sheet): Fact Sheet: President Donald J. Trump Responds to Canada's Retaliation (Section 338, 8 September 2026) (retrieved 2026-11-07)
- The White House (Fact Sheet): Fact Sheet: President Donald J. Trump Further Modifies Canadian Products Subject to Tariffs under Section 338 (23 October 2026) (retrieved 2026-11-07)
- Department of Finance Canada: The Fiscal Monitor, June 2026 (retrieved 2026-10-22)
- Department of Finance Canada: Budget 2026, Annex 1: Details of economic and fiscal projections (retrieved 2026-11-07)
- Bank of Canada: Bank of Canada maintains the policy rate (2 September 2026) (retrieved 2026-10-22)
Each dataset is used under its licence; attribution and series-level detail are in each chart’s “About this data” panel. Limitations: Monthly series are goods only, on a balance-of-payments basis, seasonally adjusted; annual shares by province and partner use customs-basis data. Month-to-month and year-over-year changes in 2025–26 are affected by tariff announcements that can bring shipments forward. Services trade, tariff rates by product and supply-chain structure are not held here.
Is Canada investing enough to raise its future output, and where is the money going?
Business investment is 4.9% below its Q1 2022 peak, with machinery and equipment up and structures down on a year earlier
Graphic: The economy grew; business investment did not
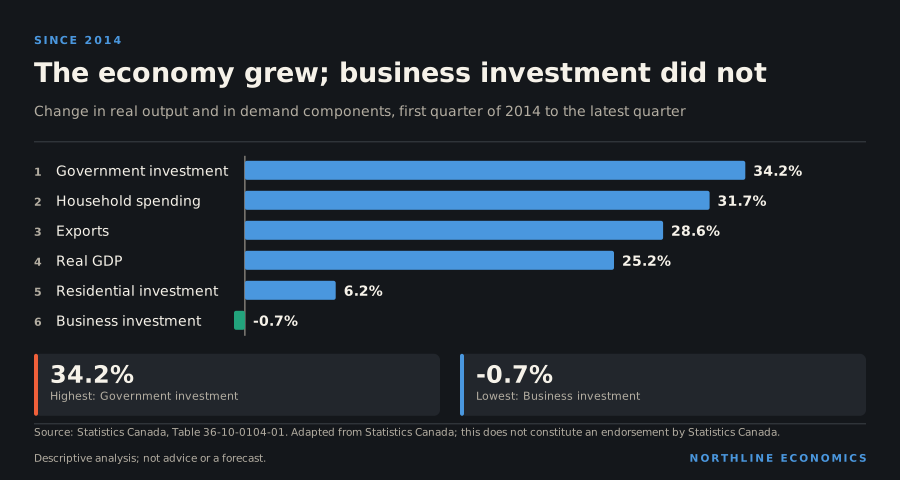
What happened
Real business gross fixed capital formation was C$428.0 billion at an annual rate in Q2 2026, 0.2% higher than a year earlier, or 17.0% of GDP. Within it, machinery and equipment rose 6.3% over the year and intellectual property products 3.3%, while non-residential structures changed by -2.1% and residential structures by -1.7%. Government investment is C$103.4 billion, 3.6% higher over the year and 23.5% higher than at the end of 2019. Business investment contributed 1.7 percentage points to annualized GDP growth in the quarter.
Business investment by asset, indexed
Real gross fixed capital formation, chained 2017 dollars, annual rate; start of the period = 100.
Chart loads when it comes into view.
Latest values: Residential structures 154,600,000,000 (2026 Q2); Non-residential structures 130,700,000,000 (2026 Q2); Machinery and equipment 85,550,000,000 (2026 Q2); Intellectual property products 63,950,000,000 (2026 Q2).
Related relationships: Business investment · Residential construction
Business and government investment, indexed
Real gross fixed capital formation, chained 2017 dollars, annual rate; start of the period = 100.
Chart loads when it comes into view.
Latest values: Business investment 428,000,000,000 (2026 Q2); Government investment 103,400,000,000 (2026 Q2).
Related relationships: Business investment
Statistics Canada reported that business capital investment rose in the second quarter, driven by engineering structures and machinery and equipment, with computer investment rising strongly, and that residential investment rose after two quarterly declines.
Evidence: Statistics Canada: The Daily: Gross domestic product, income and expenditure, second quarter 2026
In its October report the Bank of Canada said that investment and exports rose in the second quarter, with robust spending on machinery and equipment, including AI-related investment, and activity in the oil and gas sector boosting business investment. It expects business investment to increase in response to recent government incentives.
Evidence: Bank of Canada: Monetary Policy Report, October 2026: Overview; Bank of Canada: Monetary Policy Report, October 2026: Current conditions
Twelve years without growth
The sharpest fact in the investment accounts is a comparison across more than a decade. Real business investment is C$428.0 billion at an annual rate, against C$431.2 billion in the first quarter of 2014: a change of -0.7%. Over those twelve years real GDP rose 25.2%, household spending 31.7%, exports 28.6% and government investment 34.2%. Business investment is the one large component that did not grow.
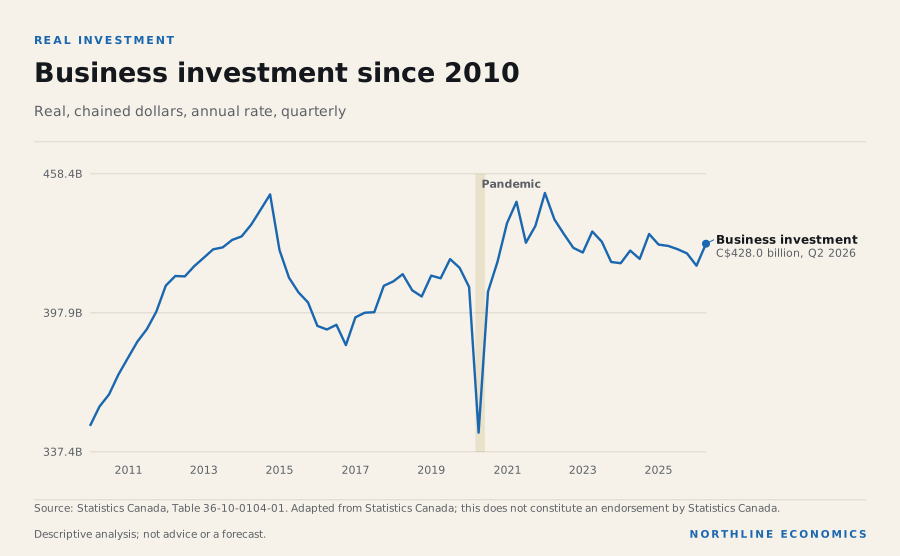
The data behind this graphic
| Series | Latest |
|---|---|
| Business investment | C$428.0 billion, Q2 2026 |
It did not move in a straight line. It fell to C$345.8 billion in Q2 2020 (the pandemic quarter), rose to C$450.1 billion in Q1 2022 and has since eased to C$428.0 billion. It stands 2.5% above its end-2019 level, a small gain over six and a half years. Investment is lumpy, and a single quarter proves little; the twelve-year comparison is what stands out.
Because investment adds to the capital stock, the cost of a flat line accumulates. A smaller addition to plant, equipment and software each year leaves each worker with less to work with than they would otherwise have had. The productivity section shows the output side of the same picture. The two are consistent, but the national accounts do not establish that one caused the other.
Why it happened
The national accounts show what was invested in, not why firms invested or held back. The pattern across assets is itself informative. Investment in intellectual property products is 50.7% higher than in 2014 and machinery and equipment 2.8%, while non-residential structures (which include pipelines, plants and commercial buildings) have changed by -17.3% and total business investment by -0.7% since the first quarter of 2014. The weakness is concentrated in non-residential structures.
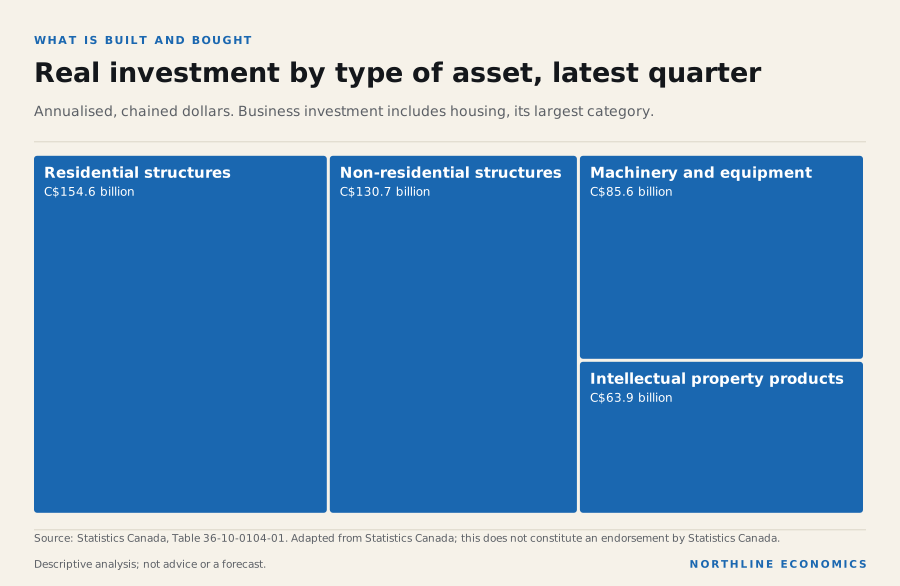
The data behind this graphic
| Item | Value |
|---|---|
| Residential structures | C$154.6 billion |
| Non-residential structures | C$130.7 billion |
| Machinery and equipment | C$85.6 billion |
| Intellectual property products | C$63.9 billion |
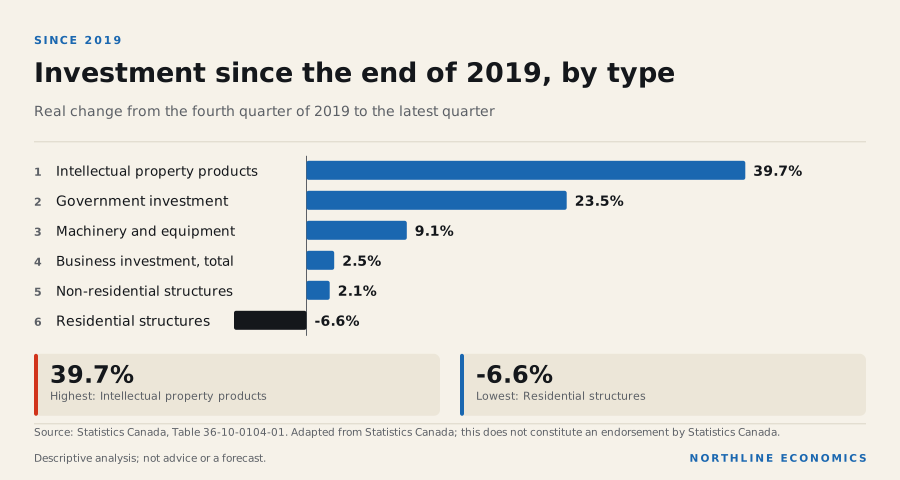
The data behind this graphic
| Item | Value |
|---|---|
| Intellectual property products | 39.7% |
| Government investment | 23.5% |
| Machinery and equipment | 9.1% |
| Business investment, total | 2.5% |
| Non-residential structures | 2.1% |
| Residential structures | -6.6% |
The composition has changed more than the total. Spending on intellectual property products, which means software, research and development and similar assets, has grown 39.7% since the end of 2019, and machinery and equipment 9.1%. Non-residential structures, which are the second-largest category of business investment at C$130.7 billion, have grown only 2.1%, and housing investment is down 6.6%.
The Bank of Canada said in 2015 that the fall in oil prices would weaken business investment in the oil and gas sector. The decline in structures investment after 2014 is consistent with that episode, but structures include much more than oil and gas, and this report cannot allocate the real decline by sector: its investment-by-industry figures are in current dollars and cover only oil and gas, mining and support activities. The Bank's statement is an assessment of the 2014–15 episode and not an estimate of how investment responds to oil prices today.
Evidence: Rhys Mendes, Opening Statement before the House of Commons Standing Committee on Finance (Bank of Canada), 12 March 2015; Bank of Canada: Rhys Mendes, Opening Statement before the House of Commons Standing Committee on Finance, 12 March 2015
Non-residential building construction put in place was 10.3% higher in the latest month than a year earlier, with industrial buildings changing by 22.1%, institutional buildings by 13.5% and commercial buildings by 1.2%.
Investment in new building construction
Value of new residential and non-residential construction put in place, current dollars, not seasonally adjusted: 12-month change (derived).
Chart loads when it comes into view.
Latest values: Residential -1.09 (2026-08); Non-residential 10.26 (2026-08); Total 2.22 (2026-08).
Related relationships: 1 relationship use this data as evidence
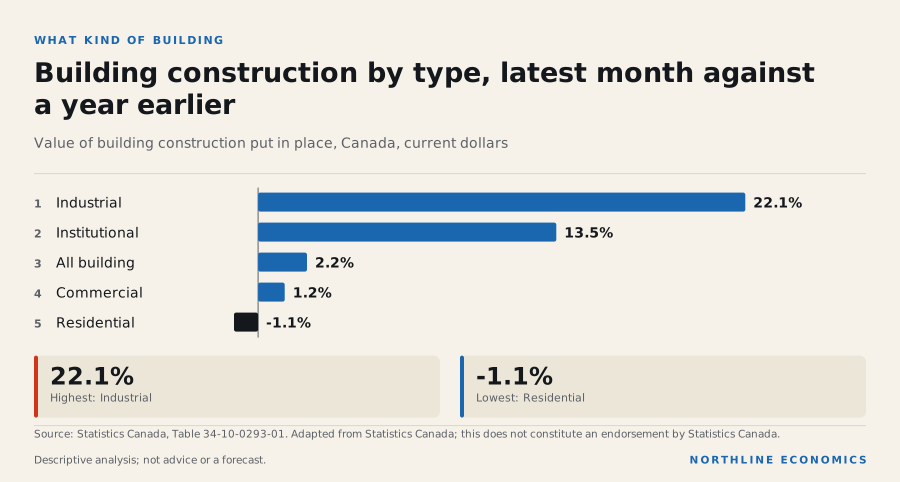
The data behind this graphic
| Item | Value |
|---|---|
| Industrial | 22.1% |
| Institutional | 13.5% |
| All building | 2.2% |
| Commercial | 1.2% |
| Residential | -1.1% |
By type, institutional and industrial building are up most on a year earlier, and commercial building is close to flat. Institutional construction (hospitals, schools, universities) is influenced by public budgets. Industrial construction (C$1.0 billion in the latest month) is small in value but rising quickly from a low base. Residential construction, at C$8.6 billion, is by far the largest category and is the one the housing section covers.
The oil and gas cycle inside the total
Statistics Canada’s capital expenditure survey makes it possible to look inside the structures figure at one industry, oil and gas extraction. It is measured in current dollars and covers all non-residential tangible capital, not only structures, but it shows the size of the swing.
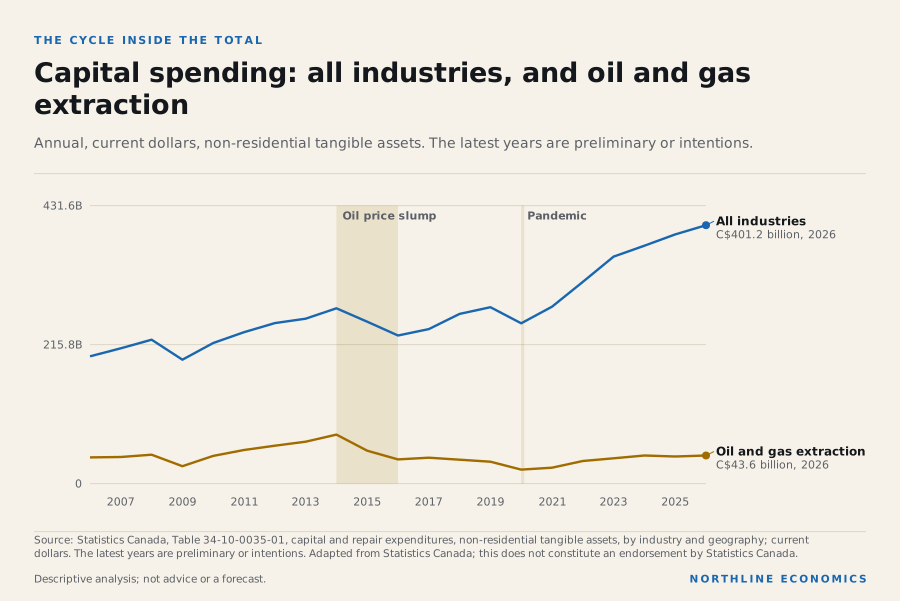
The data behind this graphic
| Series | Latest |
|---|---|
| All industries | C$401.2 billion, 2026 |
| Oil and gas extraction | C$43.6 billion, 2026 |
Spending by oil and gas extraction was C$76.1 billion in 2014, C$37.6 billion in 2016 and C$21.8 billion in 2020, and is C$42.0 billion in 2025 on a preliminary basis. The industry spent less in 2025 than in 2014 in current dollars, so after inflation the fall is larger. Spending by all industries together went the other way. It was C$272.1 billion in 2014 and C$386.8 billion in 2025, and the 2026 intentions of C$401.2 billion are 47.4% above 2014, all in current dollars.
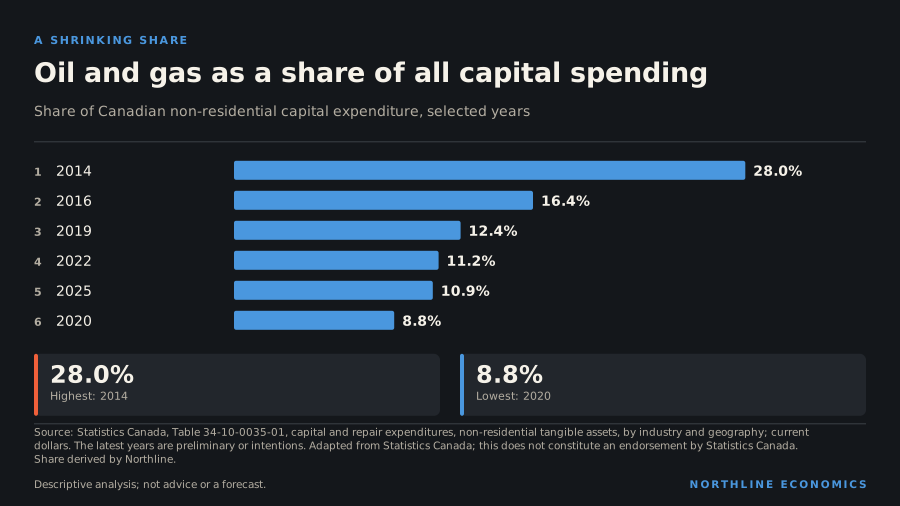
The data behind this graphic
| Item | Value |
|---|---|
| 2014 | 28.0% |
| 2016 | 16.4% |
| 2019 | 12.4% |
| 2022 | 11.2% |
| 2025 | 10.9% |
| 2020 | 8.8% |
Oil and gas extraction accounted for 28.0% of all capital spending in 2014 and 10.9% in 2025. Spending by every other industry combined rose from C$196.0 billion to C$344.7 billion. In current dollars, oil and gas accounted for most of the 2014-16 fall in capital spending, and the rise since has come from the other industries. The comparison with real investment needs care, because the survey measures current dollars and the national accounts measure real chained dollars, so the two should be compared on direction, not size.
The same dataset shows the exposure of one province. Alberta’s share of energy capital spending and the dependence of its public revenue on it are described in the research note on Alberta’s energy economy.
Why it matters
Investment builds the capital stock that determines future output per worker. Weak investment in structures and a long run of weak output per hour (see the productivity section) are consistent with one another, but the national accounts do not show that one caused the other. That business investment supports employment is a hypothesis with no evidence here; the Bank of Canada said in 2015 that the fall in oil prices would weaken oil and gas investment. Public investment has grown faster than business investment since 2019, which matters for infrastructure and for the fiscal position.
History
Real business investment peaked at C$450.1 billion in Q1 2022; it is 2.5% above its level at the end of 2019 and -0.7% relative to the first quarter of 2014. Foreign direct investment into Canada totalled C$80.3 billion over the last four quarters, with a ten-year quarterly high of C$36.5 billion in Q2 2024; Canadian direct investment abroad over the same period was C$93.3 billion. Direct investment flows are volatile and include mergers, acquisitions and reinvested earnings, so they are not a measure of new plants.
Direct investment flows (4-quarter total)
Foreign direct investment in Canada and Canadian direct investment abroad, C$ billions, balance-of-payments basis.
Chart loads when it comes into view.
Latest values: Foreign direct investment in Canada 80.28 (2026 Q2); Canadian direct investment abroad 93.31 (2026 Q2).
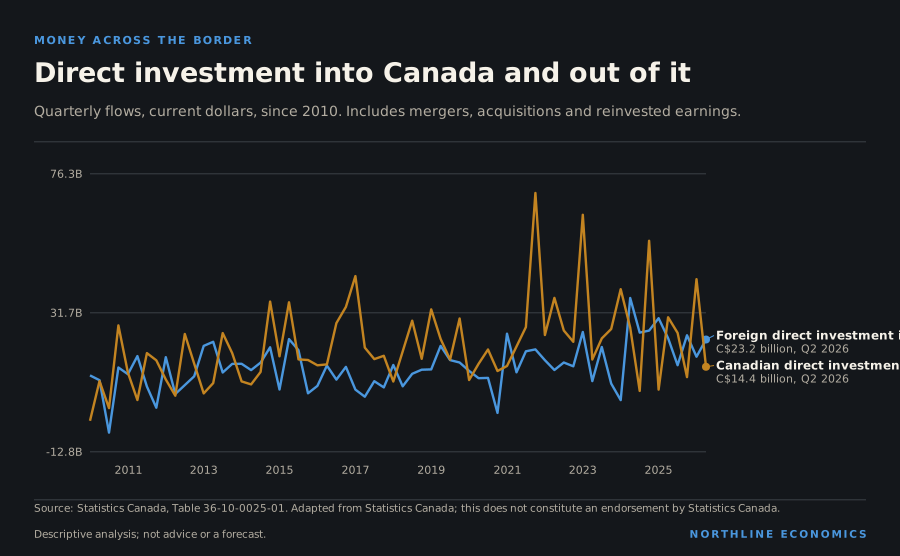
The data behind this graphic
| Series | Latest |
|---|---|
| Foreign direct investment in Canada | C$23.2 billion, Q2 2026 |
| Canadian direct investment abroad | C$14.4 billion, Q2 2026 |
Foreign direct investment into Canada and Canadian direct investment abroad are each large and volatile. Over the last four quarters inflows were C$80.3 billion and outflows C$93.3 billion. In the last twenty quarters the totals were C$390.3 billion in and C$595.3 billion out. Canadian companies have invested more abroad than foreigners have invested in Canada over that span.
That is not in itself a problem, since outward investment earns income for Canadians, but it means that the country’s capital deepening depends on domestic saving and domestic firms’ willingness to build at home.
Across geographies
Investment in new building construction (current dollars, not seasonally adjusted) in the latest month changed from a year earlier by 3.6% in Ontario, 2.4% in Quebec, 1.5% in British Columbia and -1.7% in Alberta; the monthly value was C$4.4 billion in Ontario and C$1.9 billion in Alberta. City-level construction investment is not held here.
Investment in new building construction by province, indexed
Current dollars, not seasonally adjusted, 12-month sum; start of the period = 100.
Chart loads when it comes into view.
Latest values: Alberta 21,980,000,000 (2026-08); British Columbia 26,550,000,000 (2026-08); Saskatchewan 3,138,000,000 (2026-08); Manitoba 4,591,000,000 (2026-08); and 6 more in the data table.
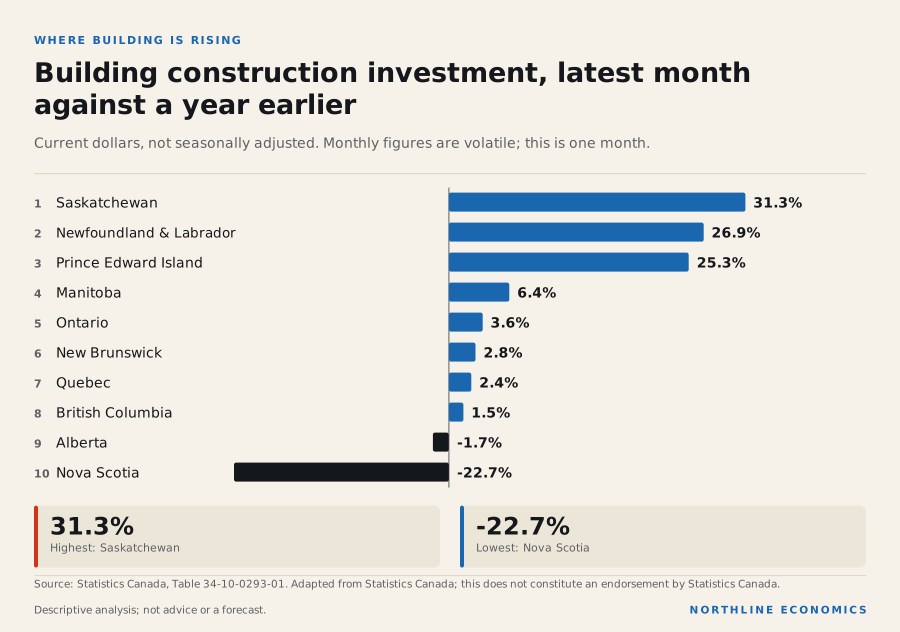
The data behind this graphic
| Item | Value |
|---|---|
| Saskatchewan | 31.3% |
| Newfoundland and Labrador | 26.9% |
| Prince Edward Island | 25.3% |
| Manitoba | 6.4% |
| Ontario | 3.6% |
| New Brunswick | 2.8% |
| Quebec | 2.4% |
| British Columbia | 1.5% |
| Alberta | -1.7% |
| Nova Scotia | -22.7% |
In the latest month, building investment was 31.3% higher than a year earlier in Saskatchewan, 26.9% in Newfoundland and Labrador and 25.3% in Prince Edward Island, and lower in Nova Scotia (-22.7%) and Alberta (-1.7%). Monthly provincial building values are volatile and the small provinces swing most, so this chart should be read as a snapshot of the latest month, not as a trend. Over the longer window from August 2019, Saskatchewan (148.9%) and New Brunswick (144.8%) show the largest increases and British Columbia (33.7%) among the smallest, though these are current-dollar values and construction costs have risen.
Investment by industry and province comes from Statistics Canada's capital and repair expenditures survey, which publishes intentions and actuals annually. This report holds it only for oil and gas, mining and support activities, nationally and for Alberta, in current dollars, so this section cannot say which other provinces or industries are investing more.
What it influences
Investment affects employment and construction activity in the short run and productive capacity in the long run. Any link between business investment and employment or housing costs is only a hypothesis; the link from oil prices to energy-sector investment has the Bank of Canada as its source.
Risks
In September the Bank of Canada said tariffs will raise costs for some businesses. On 28 October it said that, owing to new US tariffs, growth is expected to slow in the fourth quarter of 2026, before picking up again in 2027, and its October report says that trade uncertainty dampens business investment and household spending. That describes the coming months; this report does not attribute the twelve-year flat run in investment to trade uncertainty.
Evidence: Bank of Canada: Bank of Canada raises the policy rate by 25 basis points to 2½% (28 October 2026); Bank of Canada: Bank of Canada maintains the policy rate (2 September 2026); Bank of Canada: Monetary Policy Report, October 2026: Current conditions
What it means for decisions
For a business owner. If investment has been flat in real terms for twelve years, a firm that has raised its investment has gone against the national trend. Where firms are choosing between structures and intangible assets, the national data show where the money went: software and research have grown, buildings have not.
For a lender or investor. The investment story is less concentrated than it was. The decline of oil and gas as a share of capital spending, from 28.0% to 10.9%, means that national investment figures now depend less on one commodity price than they once did, and more on the combined behaviour of manufacturing, services, utilities and others. The data in this report do not split that group further.
For a policymaker. Public investment has risen faster than business investment, and institutional and industrial building are up most on a year earlier. Whether public investment crowds in or substitutes for private investment is a question this report cannot answer. Budget 2025 cites a Statistics Canada estimate that business investment in 2021 would have been 9 per cent higher had the federal regulatory burden stayed at 2006 levels; the national accounts record the outcome, not the cause. Budget 2026 adds the Productivity Mega Deduction, announced in September, which it says will cut Canada's marginal effective tax rate on new business investment from 13% to 6.4%; this report does not assess its effect.
Evidence: Finance Canada: Budget 2025, Chapter 1: Productivity and Competitiveness; Department of Finance Canada: Budget 2026, Chapter 1: Canada's Investment Supercycle
For a resident. The effect appears later, in productivity and in wages: a smaller addition to the capital stock means less to work with, and the productivity section shows what has happened to output per hour.
What the data cannot say. Investment by industry is available here only for oil and gas, mining and support activities, and in current dollars. Investment in data centres, clean power and manufacturing is not separated. Building values are nominal and include price changes.
What to watch
The third-quarter national accounts (business investment by asset), monthly building construction investment, and the annual capital and repair expenditures intentions.
Prepared with AI assistance.
Follow the relationships
- Business investment 0 with evidence · 0 recorded Open in Studio
- Business investment in oil and gas 0 with evidence · 0 recorded Open in Studio
- US tariff announcements and Canadian counter-measures (2026) 0 with evidence · 0 recorded Open in Studio
Upcoming releases
- 2026-11-19 Investment in building construction September 2026 · Statistics Canada
- 2026-11-30 Gross domestic product, income and expenditure Third quarter 2026 · Statistics Canada
Sources for this section (4 datasets, 8 documents)
Data
- Gross domestic product, expenditure-based, Canada, quarterly (36-10-0104-01; 10 series; latest Q2 2026; retrieved 2026-10-23)
- Investment in Building Construction (34-10-0293-01; 14 series; latest August 2026; retrieved 2026-10-23)
- Capital and repair expenditures, non-residential tangible assets, by industry and geography (34-10-0035-01; 2 series; latest 2026; retrieved 2026-10-30)
- Balance of international payments, flows of Canadian direct investment abroad and foreign direct investment in Canada, quarterly (36-10-0025-01; 2 series; latest Q2 2026; retrieved 2026-10-23)
Documents cited
- Statistics Canada: The Daily: Gross domestic product, income and expenditure, second quarter 2026 (retrieved 2026-10-22)
- Bank of Canada: Monetary Policy Report, October 2026: Overview (retrieved 2026-11-07)
- Bank of Canada: Monetary Policy Report, October 2026: Current conditions (retrieved 2026-11-07)
- Bank of Canada: Rhys Mendes, Opening Statement before the House of Commons Standing Committee on Finance, 12 March 2015 (retrieved 2026-11-07)
- Bank of Canada: Bank of Canada raises the policy rate by 25 basis points to 2½% (28 October 2026) (retrieved 2026-11-07)
- Bank of Canada: Bank of Canada maintains the policy rate (2 September 2026) (retrieved 2026-10-22)
- Finance Canada: Budget 2025, Chapter 1: Productivity and Competitiveness (retrieved 2026-10-25)
- Department of Finance Canada: Budget 2026, Chapter 1: Canada's Investment Supercycle (retrieved 2026-11-07)
Each dataset is used under its licence; attribution and series-level detail are in each chart’s “About this data” panel. Limitations: Investment is measured in real terms by asset type (national accounts), not by industry. Investment by industry is available here only for oil and gas, mining and support activities, and in current dollars; investment in data centres, clean power and manufacturing is not separated. Building construction investment is in current dollars, not seasonally adjusted. Direct investment flows are volatile and are affected by financial restructurings. The regulatory-burden estimate is quoted as Budget 2025 cited it, and the Productivity Mega Deduction as Budget 2026, tabled on 5 November 2026, describes it; its effect is not assessed.
Are public finances on a sustainable path, and how much of what governments spend goes to carrying debt?
Governments borrowed C$53.8 billion over the four quarters to Q2 2026 and the federal interest bill was C$52.2 billion over the same four quarters; in Q2 2026 it took 10.5% of federal revenue
Graphic: What the federal government pays in interest each quarter
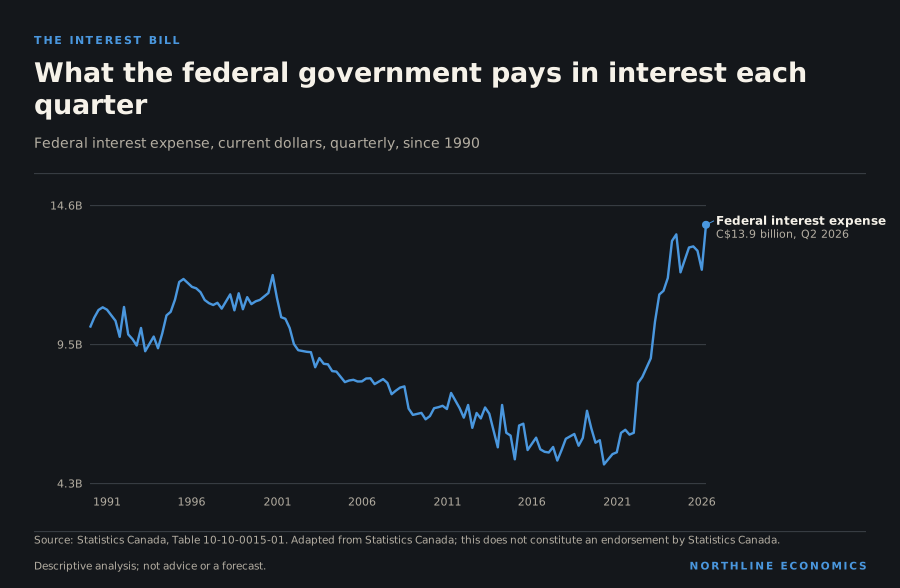
What happened
On a national-accounts basis, governments together borrowed C$53.8 billion over the four quarters to Q2 2026 (net lending of -C$53.8 billion). The federal government's net lending was -C$50.5 billion over that period and the provincial and territorial governments' was -C$53.6 billion. In the latest quarter alone the consolidated sector's balance was C$4.8 billion, the federal government's -C$4.5 billion and the provinces' -C$12.5 billion. Consolidated revenue over the year was C$1.40 trillion and expense C$1.42 trillion.
Government net lending (+) or borrowing (−), 4-quarter total
C$ billions. Government finance statistics, consolidated by level; federal figures differ from the budget’s accounting basis.
Chart loads when it comes into view.
Latest values: Federal government -50.52 (2026 Q2); Provincial and territorial governments -53.63 (2026 Q2); Consolidated governments -53.77 (2026 Q2).
Related relationships: Government finances
Consolidated government revenue and expense, 4-quarter total
C$ billions, government finance statistics.
Chart loads when it comes into view.
Latest values: Revenue 1,397 (2026 Q2); Expense 1,419 (2026 Q2).
Federal net debt was C$1.47 trillion in March 2026, 4.9% more than a year earlier and 86.8% more than at the end of 2019, when it was C$785.6 billion.
Federal government debt
C$ trillions, monthly. Net debt is gross liabilities minus financial assets.
Chart loads when it comes into view.
Latest values: Net debt 1.467 (2026-03); Gross debt (liabilities) 2.315 (2026-03).
Related relationships: Government finances
The Department of Finance's Fiscal Monitor, which reports on a different (budgetary) basis, shows a federal deficit of $5.4 billion for April to August 2026 against $11.1 billion for the same months of 2025. Revenues were up 7.1%, largely on personal income tax, other revenues and GST, offset in part by lower customs import duties and energy tax revenues, and public debt charges were up 9.1%.
Evidence: Department of Finance Canada: The Fiscal Monitor, August 2026
The interest bill: a dollar story and a share story
The federal government paid C$13.9 billion in interest in the latest quarter, the highest in a series that begins in 1990. In the second quarter of 2019, the same quarter seven years earlier (the series is not seasonally adjusted), the figure was C$7.0 billion, and its low was C$5.0 billion in Q2 2020. Over the past year interest expense totalled C$52.2 billion.
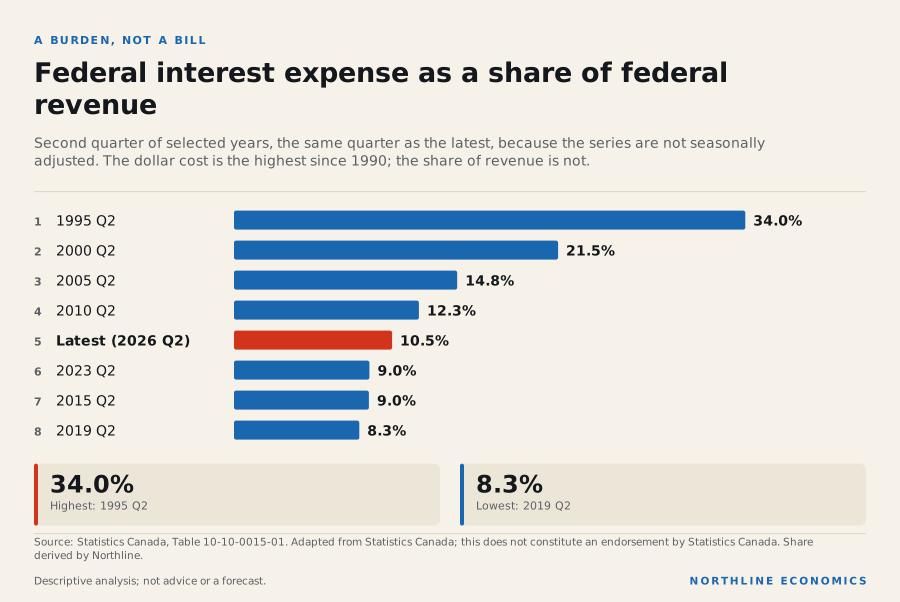
The data behind this graphic
| Item | Value |
|---|---|
| 1995 Q2 | 34.0% |
| 2000 Q2 | 21.5% |
| 2005 Q2 | 14.8% |
| 2010 Q2 | 12.3% |
| Latest (2026 Q2) | 10.5% |
| 2023 Q2 | 9.0% |
| 2015 Q2 | 9.0% |
| 2019 Q2 | 8.3% |
Revenue has grown too, so the burden is better measured as a share of revenue. At 10.5% it is higher than in the same quarter of 2019 (8.3%) and higher than its low of 5.0% in the first quarter of 2021. But it is far lower than in the 1990s, when it was 34.0% in the second quarter of 1995, and lower than in 2000 (21.5%). The dollar figure is at a record because the debt is large and rates are higher than in the 2010s. The share is moderate because revenue is also much larger in nominal terms, C$132.4 billion a quarter now against C$51.5 billion in the same quarter of 2000.
Two readings are possible, and the data do not decide between them. One is that the burden has returned to a level that is manageable by the standard of the past thirty years. The other is that it has risen steeply since its low in early 2021, and that it may keep rising as maturing debt is refinanced at higher rates. The Department of Finance statement later in the section attributes the rise in debt charges mainly to higher effective interest rates on a larger stock of marketable bonds. This report holds no projection of that path.
Who is borrowing
Governments together borrowed C$53.8 billion over the year, on the national-accounts basis. That is more than the gap between revenue and expense, because net borrowing also counts governments' net investment in non-financial assets such as buildings and infrastructure. Federal borrowing was C$50.5 billion and provincial and territorial borrowing C$53.6 billion. They do not add to the consolidated figure because the consolidated total also includes local governments and the public pension plans; the difference between the sum of the two and the total is their combined net lending.
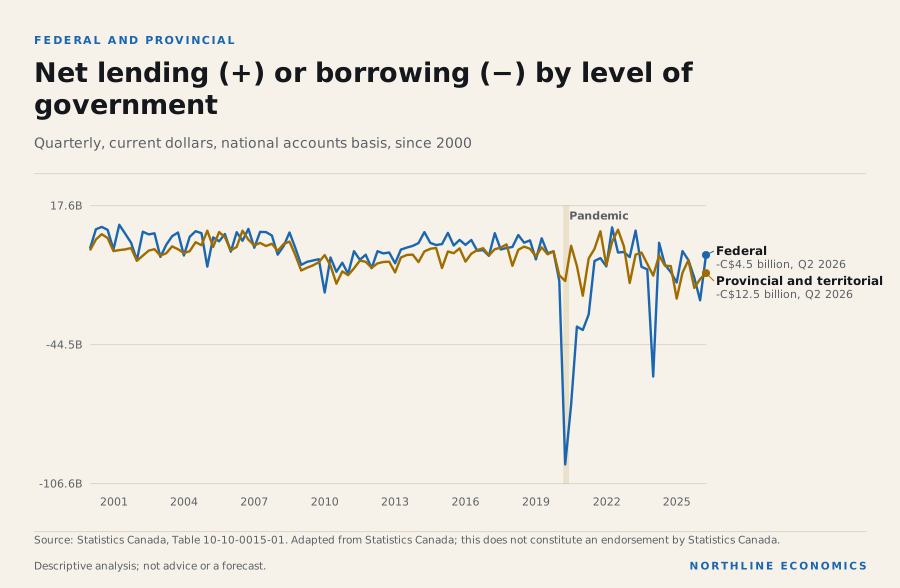
The data behind this graphic
| Series | Latest |
|---|---|
| Federal | -C$4.5 billion, Q2 2026 |
| Provincial and territorial | -C$12.5 billion, Q2 2026 |
The pandemic quarter dominates the long chart: federal net lending reached -C$98.0 billion in Q2 2020. The recent change is that the provinces have caught up with the federal government. Their worst quarter in ten years was -C$23.9 billion in Q1 2025, and over the past year they borrowed slightly more than Ottawa did. Over five years the consolidated total is -C$121.8 billion.
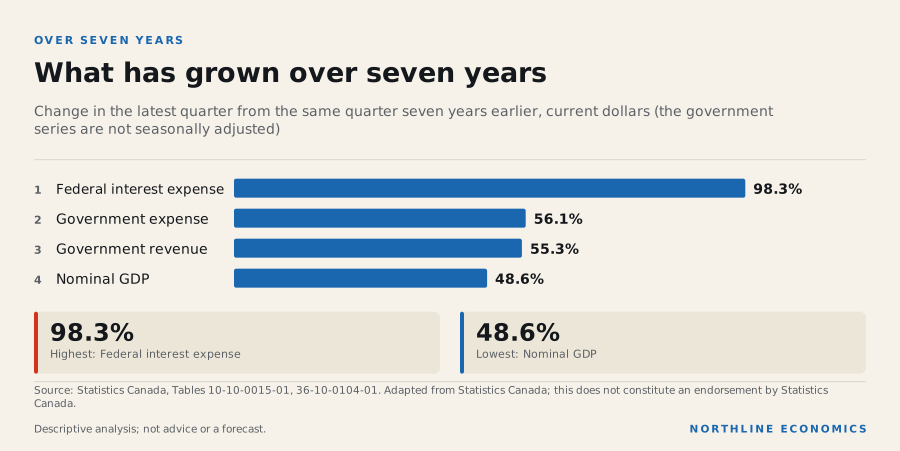
The data behind this graphic
| Item | Value |
|---|---|
| Federal interest expense | 98.3% |
| Government expense | 56.1% |
| Government revenue | 55.3% |
| Nominal GDP | 48.6% |
The chart for the whole period makes the arithmetic plain. Federal interest expense has grown far faster than anything else. Because the government series are not seasonally adjusted, the chart compares the latest quarter with the same quarter seven years earlier: consolidated expense is up 56.1% and revenue 55.3%, against 48.6% for nominal GDP. Federal net debt rose because the federal government borrowed in almost every quarter of the period. Net debt itself is C$1.47 trillion, from C$785.6 billion at the end of 2019 and C$685.1 billion at the end of 2014, so it has grown by more than nominal GDP over both periods.
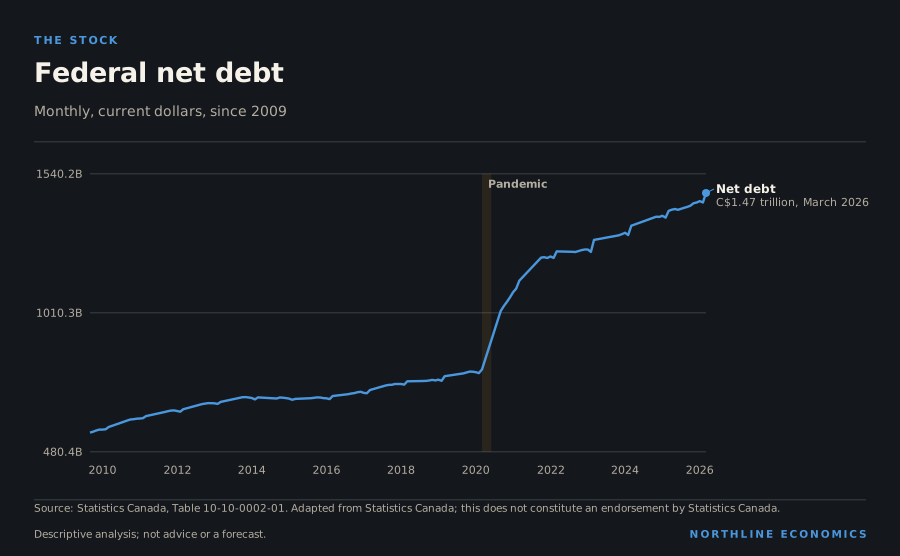
The data behind this graphic
| Series | Latest |
|---|---|
| Net debt | C$1.47 trillion, March 2026 |
Why it happened
The deficit depends on both spending and revenue. Against the same quarter seven years earlier, consolidated expense is up 56.1% and revenue 55.3%, against nominal GDP 48.6%. Spending has therefore grown faster than the economy, and faster than revenue. The largest deficit of the period was -C$105.0 billion in Q2 2020. This report does not decompose the changes in revenue and expense into policy changes, inflation and growth.
Interest costs have risen with borrowing and rates: federal interest expense over the year was C$52.2 billion. The latest quarter's bill was 98.3% higher than in the same quarter seven years earlier and 10.5% of that quarter's federal revenue.
The Department of Finance reports that public debt charges from April to August 2026 were 9.1% higher than a year earlier, primarily because of an increased stock of marketable bonds with higher average effective interest rates, and that lower short-term interest rates on treasury bills partly tempered the increase. In Budget 2026 it explains that higher interest rates raise debt charges in two ways: as existing debt matures and is refinanced at higher rates, and by increasing the expected cost of future borrowing.
Evidence: relationship: Government of Canada bond yields and Government finances; Department of Finance Canada: The Fiscal Monitor, August 2026; Department of Finance Canada: Budget 2026, Annex 1: Details of economic and fiscal projections
Why it matters
Debt service competes with other spending and with tax cuts, and a rising interest bill makes governments more sensitive to interest rates and to the growth of nominal GDP. Whether the position is sustainable depends on interest rates relative to nominal growth and on projected primary balances, which require forecasts that this report does not hold. It is therefore not assessed here and nothing in this section should be read as a judgement on sustainability.
History
Federal net lending's worst quarter in the past twenty years was -C$98.0 billion in Q2 2020. The provinces' worst quarter in the past ten years was -C$23.9 billion in Q1 2025. Five-year consolidated net lending totals -C$121.8 billion.
Across geographies
The distribution across provinces is wide. In the fiscal year that began in April 2024, the most recent in the accounts held here and one Statistics Canada marks as preliminary, Alberta’s net operating balance was 8.5% of its revenue and Nova Scotia’s and New Brunswick’s were slightly positive. British Columbia’s was -16.5%, the largest deficit relative to revenue, and Saskatchewan’s (-9.3%), Quebec’s (-9.2%) and Ontario’s (-8.2%) were also large. These are Statistics Canada’s statistical figures. They differ from the balances the provinces report because of differences in coverage, accounting rules and timing, and are not comparable with them. For that year the provinces' own audited results tell a different story in several cases: New Brunswick reported a deficit of $104.4 million, not a surplus, and Saskatchewan's operating deficit was $249 million and Ontario's $1.1 billion, far smaller than the statistical figures. Alberta reported a surplus of $8.3 billion.
Evidence: Statistics Canada: Consolidated Canadian Government Finance Statistics, 2024 (The Daily, note to readers); Government of New Brunswick, Department of Finance and Treasury Board: News release: Public accounts for 2024-25 (29 September 2025); Government of Saskatchewan (Finance): Saskatchewan Finished 2024-25 Near Budget Forecast; Government of Ontario: Public Accounts 2025-26: Annual report; Government of Alberta (Treasury Board and Finance): 2025-26 Final Results: Year-End Report
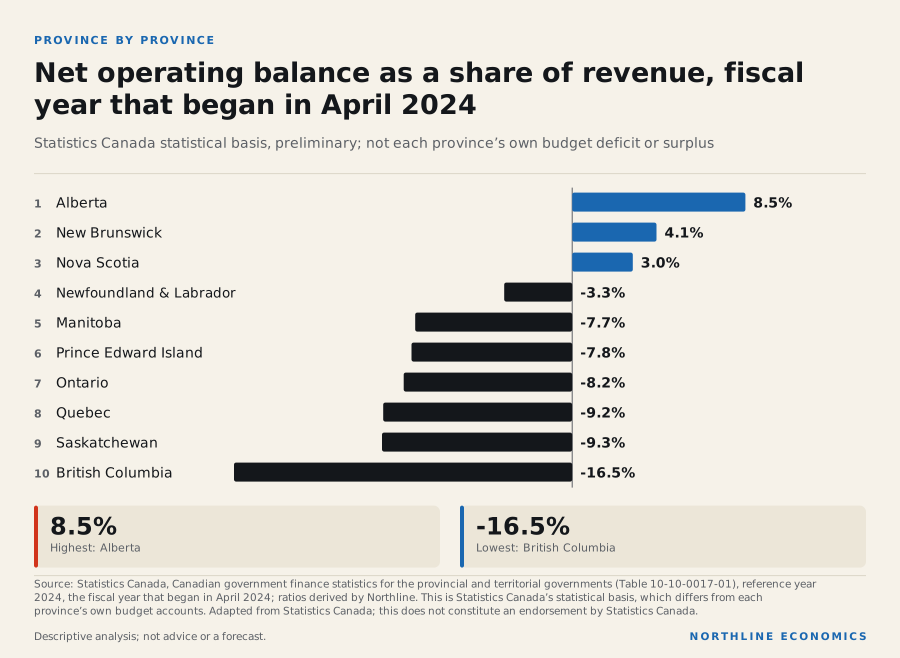
The data behind this graphic
| Item | Value |
|---|---|
| Alberta | 8.5% |
| New Brunswick | 4.1% |
| Nova Scotia | 3.0% |
| Newfoundland and Labrador | -3.3% |
| Manitoba | -7.7% |
| Prince Edward Island | -7.8% |
| Ontario | -8.2% |
| Quebec | -9.2% |
| Saskatchewan | -9.3% |
| British Columbia | -16.5% |
The stock of liabilities tells a different story. Alberta’s liabilities are 1.48 times its revenue, among the lowest of the ten, while Manitoba’s are 3.43 times, Newfoundland and Labrador’s 2.95 and Quebec’s 2.88. British Columbia has the largest deficit and a relatively low multiple (1.82): so the large deficit sits on a comparatively small stock. These are gross liabilities, which include pension and other obligations and are not offset by financial assets, so they overstate net debt.
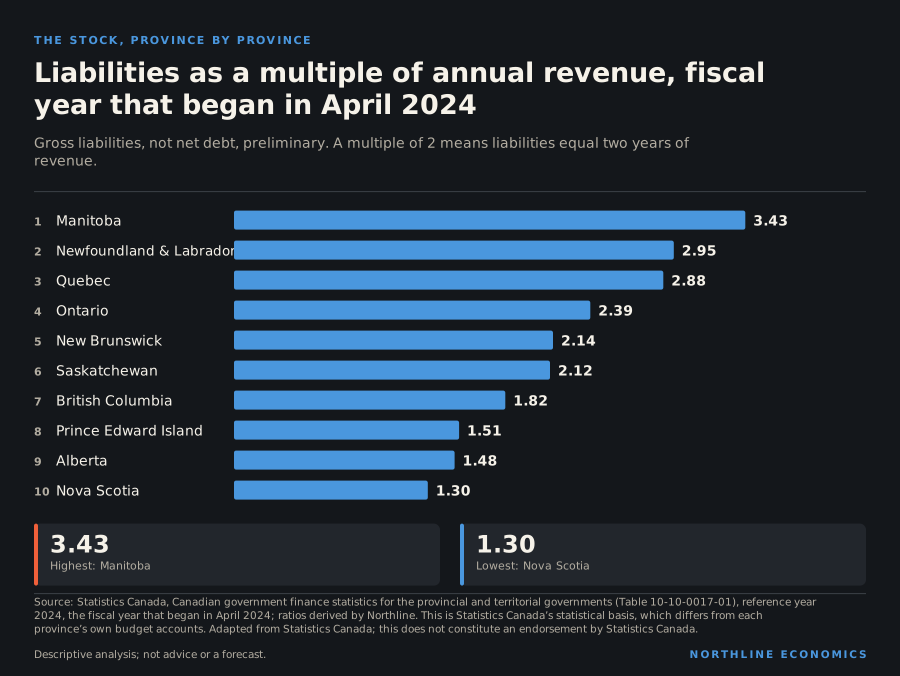
The data behind this graphic
| Item | Value |
|---|---|
| Manitoba | 3.43 |
| Newfoundland and Labrador | 2.95 |
| Quebec | 2.88 |
| Ontario | 2.39 |
| New Brunswick | 2.14 |
| Saskatchewan | 2.12 |
| British Columbia | 1.82 |
| Prince Edward Island | 1.51 |
| Alberta | 1.48 |
| Nova Scotia | 1.30 |
Provincial public finances are available as a recent aggregate: the provincial and territorial governments' net lending was -C$53.6 billion over the four quarters to Q2 2026, on Statistics Canada's national-accounts basis. Province-by-province accounts are available only for past fiscal years. In the fiscal year that began in April 2024, the net operating balance of the provincial government was C$6.9 billion in Alberta (8.5% of its revenue), -C$16.9 billion in Ontario, -C$15.9 billion in Quebec and -C$13.2 billion in British Columbia; liabilities were C$492.0 billion in Ontario, C$495.5 billion in Quebec, C$144.6 billion in British Columbia and C$120.6 billion in Alberta. These are accounts for a past year, not the current budget. One sourced sensitivity, for Alberta's oil revenue, is given below.
Alberta's Budget 2026 fiscal plan puts the net fiscal impact of a fall of one US dollar a barrel in the WTI price at about $680 million over a full year. With the WTI price at US$97.70 in October 2026, a change of 62.3% from a year earlier, the sensitivity indicates the direction and rough scale of the budget's exposure, but it is a government estimate based on the budget's own price assumptions, which the fiscal plan says can vary significantly at different price levels, and it applies to the provincial budget only. It is not an estimate of the effect on any city or of the realised revenue.
What it influences
Government deficits and debt feed into interest costs, tax policy and the scope for public investment. The Department of Finance links interest rates on its marketable debt to the federal interest bill, and the sensitivity in Alberta's budget is the only quantified estimate of the oil price's effect in this section.
Risks
Higher interest rates on renewed debt, slower nominal growth and lower commodity-related revenue raise deficits; the opposite eases them.
The Fiscal Monitor reports that countermeasures to US tariffs were repealed and that the federal fuel charge was removed in April 2025, both of which affect revenue comparisons across years. Budget 2026 adds that new Canadian counter tariffs have applied since 8 September 2026 and are assumed to remain in place into 2027-28, and that temporary relief from the federal fuel excise tax lowers motive fuel revenues in 2026-27. This report does not hold fiscal projections and so does not assess these risks quantitatively.
Evidence: Department of Finance Canada: The Fiscal Monitor, June 2026; Department of Finance Canada: Budget 2026, Annex 1: Details of economic and fiscal projections
What it means for decisions
For a taxpayer or voter. The share of federal revenue that goes to interest is the number that matters, not the dollar figure. At 10.5% it is about a tenth of every revenue dollar. It was about a third in 1995.
For a bondholder or lender. Federal net debt has grown faster than nominal GDP. The ratio of interest to revenue is the one to watch, because it shows whether the interest bill is crowding out other spending. This report does not hold fiscal projections and does not assess sustainability.
For a business that sells to government or depends on it. Provincial positions differ widely. A province with a surplus and low liabilities relative to revenue (Alberta) has more fiscal room than one with a large deficit (British Columbia), but Alberta’s revenue depends on oil prices, as the sensitivity in the Alberta budget shows, and a fall in prices could change the picture quickly.
For a policymaker. A larger interest bill reduces room for other spending or tax cuts. The levers are the growth of nominal GDP, the primary balance and interest rates, and they interact; the productivity section is relevant because faster real growth raises nominal GDP and, through revenue, the primary balance.
What the data cannot say. The statistical-basis provincial figures are for a past year and are not each province’s current budget. The national-accounts figures differ from the Fiscal Monitor’s budgetary figures. Nothing here is a judgement on whether debt is sustainable.
What to watch
Quarterly government finance statistics for the third quarter, the monthly Fiscal Monitor, federal and provincial budget and fiscal updates, and the yield on long-term government bonds.
Prepared with AI assistance.
Follow the relationships
- Government finances 1 with evidence · 1 recorded Open in Studio
- Government of Canada bond yields 5 with evidence · 5 recorded Open in Studio
- World oil price (WTI) 16 with evidence · 16 recorded Open in Studio
- Alberta 14 with evidence · 17 recorded Open in Studio
Upcoming releases
- 2026-11-23 Quarterly financial statistics for enterprises Third quarter 2026 · Statistics Canada
Sources for this section (5 datasets, 9 documents)
Data
- Statement of government operations and balance sheet, government finance statistics, quarterly (10-10-0015-01; 7 series; latest Q2 2026; retrieved 2026-10-23)
- Central government debt (10-10-0002-01; 1 series; latest March 2026; retrieved 2026-11-05)
- Gross domestic product, expenditure-based, Canada, quarterly (36-10-0104-01; 1 series; latest Q2 2026; retrieved 2026-10-23)
- Canadian government finance statistics for the provincial and territorial governments (10-10-0017-01; 8 series; latest 2024; retrieved 2026-11-07)
- Crude oil, WTI, monthly average price (Pink Sheet (monthly prices); 1 series; latest October 2026; retrieved 2026-11-05)
Documents cited
- Department of Finance Canada: The Fiscal Monitor, August 2026 (retrieved 2026-11-07)
- Department of Finance Canada: Budget 2026, Annex 1: Details of economic and fiscal projections (retrieved 2026-11-07)
- Statistics Canada: Consolidated Canadian Government Finance Statistics, 2024 (The Daily, note to readers) (retrieved 2026-11-06)
- Government of New Brunswick, Department of Finance and Treasury Board: News release: Public accounts for 2024-25 (29 September 2025) (retrieved 2026-11-07)
- Government of Saskatchewan (Finance): Saskatchewan Finished 2024-25 Near Budget Forecast (retrieved 2026-10-25)
- Government of Ontario: Public Accounts 2025-26: Annual report (retrieved 2026-10-25)
- Government of Alberta (Treasury Board and Finance): 2025-26 Final Results: Year-End Report (retrieved 2026-10-25)
- Government of Alberta (Treasury Board and Finance): Budget 2026: Focused on what matters, Fiscal Plan 2026-29 (Open Government Licence - Alberta) (retrieved 2026-11-07)
- Department of Finance Canada: The Fiscal Monitor, June 2026 (retrieved 2026-10-22)
Each dataset is used under its licence; attribution and series-level detail are in each chart’s “About this data” panel. Limitations: Quarterly government finance statistics use national-accounts conventions and differ from the budgetary balance in the federal Fiscal Monitor and the Public Accounts. Province-by-province accounts are available only to the fiscal year that began in April 2024, which Statistics Canada marks as preliminary. Local government detail, pension-plan balances and fiscal projections (budget forecasts) are not held here. The federal debt series is monthly and ends in March 2026. The quarterly government finance series are not seasonally adjusted, so growth is measured against the same quarter of an earlier year. This section does not assess fiscal sustainability, which needs projections.
Which industries are driving output, jobs and exports, and where are they concentrated?
Oil and gas output is 15.8% above its end-2019 level while manufacturing is 4.2% below it
Graphic: Which industries have grown, and which have not
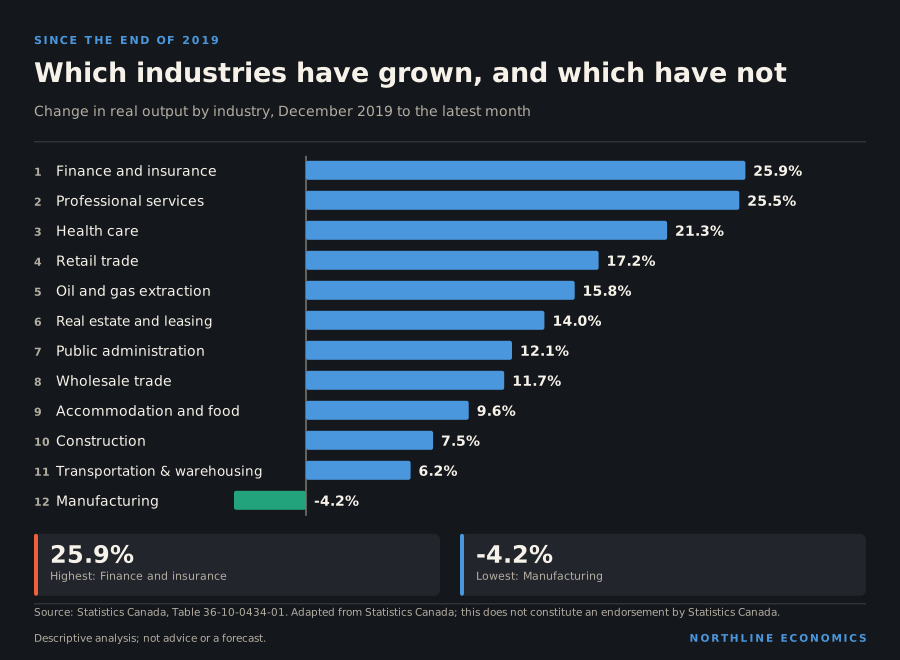
What happened
Services-producing industries account for roughly 75.0% of real output (an approximation, since chained-dollar components are not additive). Among the largest individual industries, real estate and leasing is 13.2%, manufacturing 8.6%, health care 8.1%, finance and insurance 7.7%, construction 7.3%, public administration 7.2%, mining and oil and gas 5.2% and agriculture and forestry 1.9%. Over the year to August 2026, real output changed by 3.4% in information and cultural industries, 5.5% in transportation and warehousing, 2.6% in finance and insurance, 1.5% in oil and gas extraction, 1.8% in manufacturing, -0.1% in professional services and -7.7% in agriculture, forestry, fishing and hunting.
Output growth in resource and goods industries
Percent change from a year earlier in monthly real GDP (derived).
Chart loads when it comes into view.
Latest values: Oil and gas extraction 1.5 (2026-08); Manufacturing 1.85 (2026-08); Construction 0.38 (2026-08).
For August 2026, Statistics Canada reported that real GDP was essentially unchanged for a second consecutive month. Retail trade rebounded and manufacturing rose for the fifth time in seven months, with refineries resuming production after unscheduled maintenance in July, while wholesale trade and public administration declined and oil and gas extraction fell for a third consecutive month.
Evidence: Statistics Canada: The Daily: Gross domestic product by industry, August 2026
The shape of the economy
Canadian industry is easier to understand by size, then by change. At the latest reading the largest single industry is real estate and leasing, at C$313.2 billion a year in real output, which includes the imputed rent that homeowners are deemed to pay themselves. Manufacturing is second at C$202.9 billion, followed by health care (C$193.2 billion), finance and insurance (C$183.1 billion) and construction (C$172.4 billion). Mining, quarrying and oil and gas is C$123.4 billion, of which oil and gas extraction is C$79.3 billion.
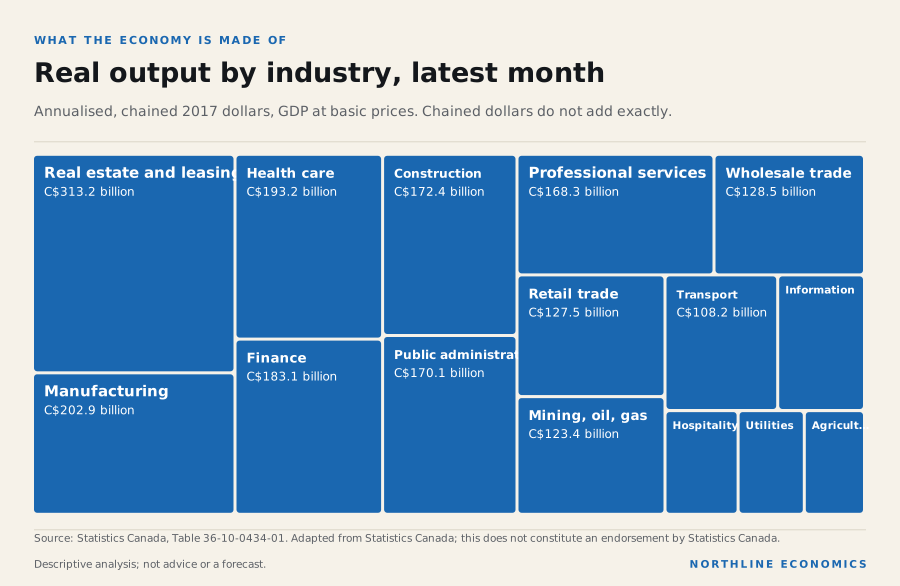
The data behind this graphic
| Item | Value |
|---|---|
| Real estate and leasing | C$313.2 billion |
| Manufacturing | C$202.9 billion |
| Health care | C$193.2 billion |
| Finance | C$183.1 billion |
| Construction | C$172.4 billion |
| Public administration | C$170.1 billion |
| Professional services | C$168.3 billion |
| Wholesale trade | C$128.5 billion |
| Retail trade | C$127.5 billion |
| Mining, oil, gas | C$123.4 billion |
| Transport | C$108.2 billion |
| Information | C$83.4 billion |
| Hospitality | C$53.7 billion |
| Utilities | C$48.6 billion |
| Agriculture, forestry, fishing | C$44.2 billion |
Growth since 2019 sorted industries into two groups, as the opening chart shows. Finance (25.9%), professional services (25.5%) and health (21.3%) have led. Manufacturing is the only large industry smaller than it was (-4.2%). Transportation and warehousing (6.2%) and utilities (4.6%) have grown least among the industries that grew.
Twenty-six years of structural change
The 2019 starting point hides a longer pattern. Back to January 2000, real output across the economy is up 70.7%. The services-producing side is up 90.6% and the goods-producing side 33.5%.
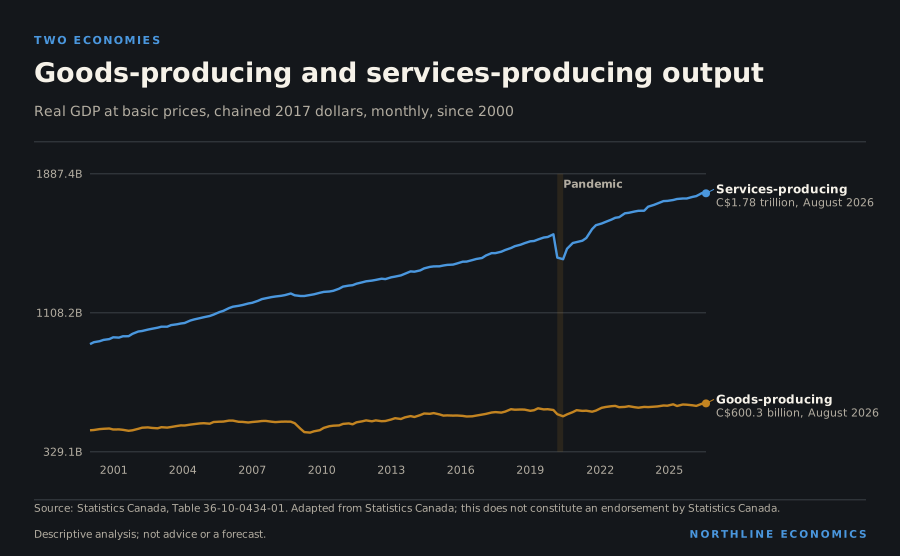
The data behind this graphic
| Series | Latest |
|---|---|
| Services-producing | C$1.78 trillion, August 2026 |
| Goods-producing | C$600.3 billion, August 2026 |
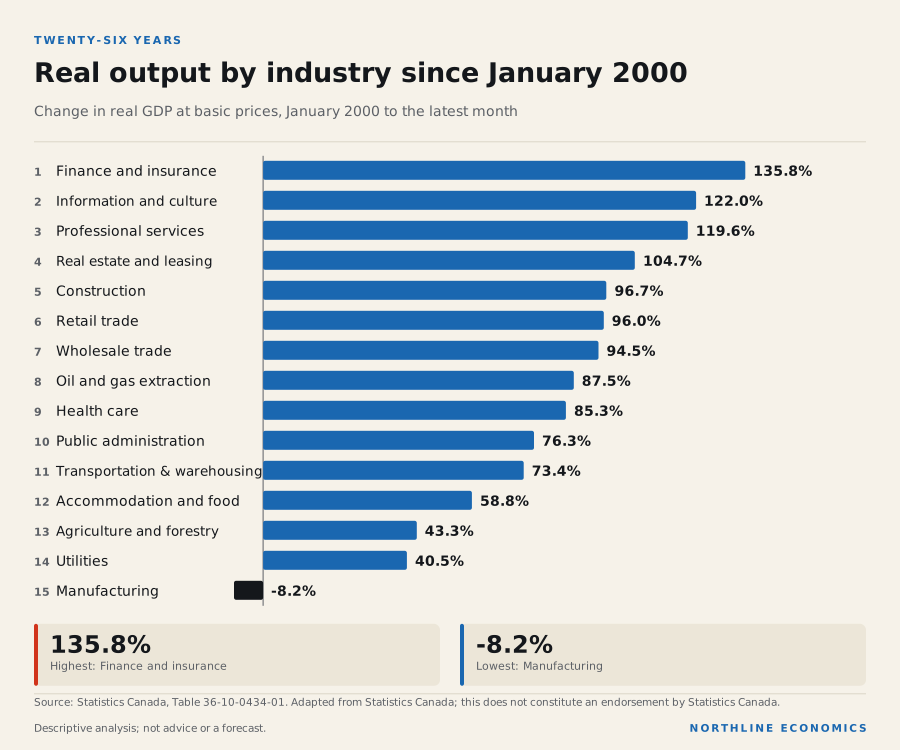
The data behind this graphic
| Item | Value |
|---|---|
| Finance and insurance | 135.8% |
| Information and culture | 122.0% |
| Professional services | 119.6% |
| Real estate and leasing | 104.7% |
| Construction | 96.7% |
| Retail trade | 96.0% |
| Wholesale trade | 94.5% |
| Oil and gas extraction | 87.5% |
| Health care | 85.3% |
| Public administration | 76.3% |
| Transportation and warehousing | 73.4% |
| Accommodation and food | 58.8% |
| Agriculture and forestry | 43.3% |
| Utilities | 40.5% |
| Manufacturing | -8.2% |
Three things stand out. First, the fastest growth has been in finance and insurance (135.8%), information and culture (122.0%) and professional services (119.6%), all more than doubling in real terms. Second, oil and gas extraction (87.5%) has outgrown the economy as a whole, a reminder that after the price slump of 2014–16 the industry did not shrink in volume terms, even though its capital spending did (see the investment section). Third, manufacturing is the only large industry that produces less than in January 2000 (-8.2%).
The jobs data add a second dimension. Total employment is up 44.0% over the same period, less than output, so output per job has risen.
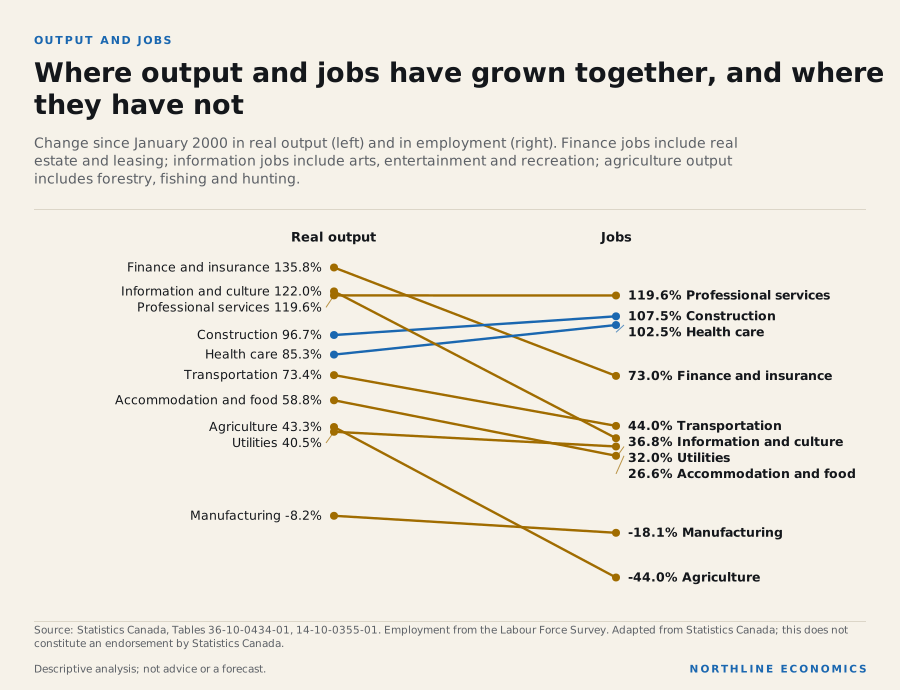
The data behind this graphic
| Item | Real output | Jobs |
|---|---|---|
| Professional services | 119.6% | 119.6% |
| Finance and insurance | 135.8% | 73.0% |
| Health care | 85.3% | 102.5% |
| Construction | 96.7% | 107.5% |
| Information and culture | 122.0% | 36.8% |
| Transportation | 73.4% | 44.0% |
| Accommodation and food | 58.8% | 26.6% |
| Utilities | 40.5% | 32.0% |
| Manufacturing | -8.2% | -18.1% |
| Agriculture | 43.3% | -44.0% |
The pairs show how different industries have grown. In professional services output and jobs rose by about the same proportion (119.6% and 119.6%), so growth came from adding people. In finance and insurance, output rose 135.8%; jobs, on a wider measure that includes real estate and leasing, rose 73.0%, which suggests each job supports more output. In agriculture the contrast is the sharpest: output, which here includes forestry, fishing and hunting, is up 43.3% while agricultural jobs are down 44.0%. In manufacturing, output is -8.2% and jobs -18.1%: fewer people making slightly less. Health care and construction employ more than twice as many people as in 2000 (jobs up 102.5% and 107.5%), and their output has grown by less than that, which in these measures means less output per job than before. Whether that reflects measurement, mix or a real change in efficiency is not something these series can settle.
Since the end of 2019, the factory story is different again. Manufacturing output is 4.2% lower (to August 2026) while manufacturing employment is 6.6% higher (to October 2026). Real output has fallen and employment has risen, which is the opposite of the 2000s pattern. The two are measured in different surveys and the monthly employment series is noisy, so this is a caution, not a conclusion.
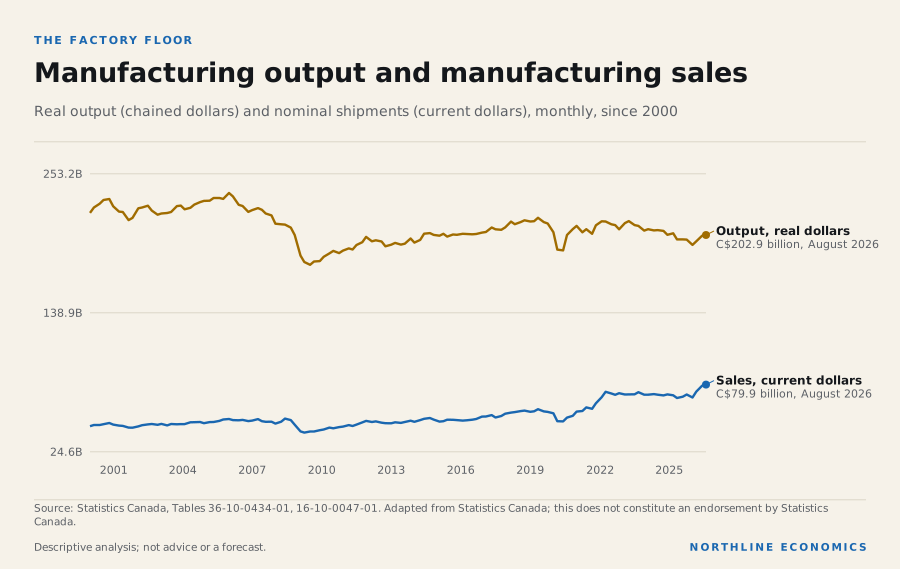
The data behind this graphic
| Series | Latest |
|---|---|
| Sales, current dollars | C$79.9 billion, August 2026 |
| Output, real dollars | C$202.9 billion, August 2026 |
The chart makes a point about nominal figures. Manufacturing sales in current dollars have grown much faster than real output because prices have risen; a reader who sees only the sales figure would conclude that the sector has grown, while the real series shows it has not.
Energy and mining
Crude oil production was 154.0 million barrels in August 2026, 1.9% higher than a year earlier and close to the high of the available history since 2016 (156.5 million barrels in December 2025). Alberta produced 84.8% of it. Oil and gas extraction output is 15.8% above its end-2019 level. Energy products were 26.3% of goods exports in September 2026 (see the trade section).
Crude oil production
Millions of barrels per month; Alberta is the largest producing province.
Chart loads when it comes into view.
Latest values: Canada 154 (2026-08); Alberta 130.5 (2026-08).
Related relationships: Crude oil production · 1 relationship use this data as evidence
Alberta's pattern differs from the headline numbers: the resource group (forestry, fishing, mining, quarrying and oil and gas) employed 5.6% of Alberta's workers in 2025, but energy products were 76% of its domestic exports that year. In Newfoundland and Labrador the employment share was 6.4% and the export share 54%. Measured by jobs, resource industries are small; measured by export value (and, for governments, by royalties), they are large.
The Bank of Canada said in 2015 that the fall in oil prices would reduce aggregate income, a negative terms-of-trade effect, and weaken business investment in the oil and gas sector. Today's higher oil prices therefore raise the value of energy exports, but this report does not show that they have raised investment.
Evidence: Rhys Mendes, Opening Statement before the House of Commons Standing Committee on Finance (Bank of Canada), 12 March 2015; Bank of Canada: Rhys Mendes, Opening Statement before the House of Commons Standing Committee on Finance, 12 March 2015
Output of metals and minerals, potash, critical minerals and coal is not separately measured in the series held here; the value of shipments by mineral is shown below.
Statistics Canada reported that potash mining and other metal ore mining, both of which fell in July, rebounded in August, potash alongside higher exports and other metal ore mining as production resumed after disruptions; these are monthly movements in subsectors and are not trends.
Evidence: Statistics Canada: The Daily: Gross domestic product by industry, August 2026
Manufacturing
Manufacturing sales (shipments) were C$79.9 billion in August 2026, 14.2% higher than a year earlier, with new orders 12.1% higher and unfilled orders 17.0% higher. Manufacturing employment changed by -0.9% over the year to October 2026 and real manufacturing output by 1.8% over the year to August 2026. Nominal sales are rising much faster than real output because prices are rising:
Statistics Canada's price index release shows the Industrial Product Price Index up 14.5% and the Raw Materials Price Index up 27.0% from a year earlier in September.
Evidence: Statistics Canada: The Daily: Industrial product and raw materials price indexes, September 2026
Manufacturing sales, new orders and unfilled orders
C$ billions, seasonally adjusted. Unfilled orders are a stock at month end.
Chart loads when it comes into view.
Latest values: Sales (shipments) 79.88 (2026-08); New orders 79.85 (2026-08); Unfilled orders 134.2 (2026-08).
Related relationships: Manufacturing · 1 relationship use this data as evidence
Manufacturing's share of employment in 2025 was 10.8% in Quebec and 10.0% in Ontario, the provinces most exposed to US demand for manufactured goods (the exposure edges in the explorer record the export shares). Motor vehicles and parts exports were C$7.3 billion in September 2026, a change of -1.4% from a year earlier.
Statistics Canada reported that auto production rebounded in the second quarter and lifted exports.
Evidence: Statistics Canada: The Daily: Gross domestic product, income and expenditure, second quarter 2026
Agriculture and food
Agriculture, forestry, fishing and hunting output changed by -7.7% over the year to August 2026 and employment in agriculture by -3.9% over the year to October 2026. Exports of farm, fishing and intermediate food products were C$5.5 billion in September 2026, a change of 18.9% from a year earlier. In 2025 agriculture was 4.6% of Saskatchewan's employment, 2.0% of Manitoba's and 1.5% of Alberta's. Crop yields and Canadian input costs are not held here; the agriculture section covers world grain prices.
Construction, transportation, finance, technology and tourism
Construction output is 7.5% above its end-2019 level and employment 9.1% higher; the value of non-residential building construction in the latest month changed by 10.3% from a year earlier (see the investment section). Transportation and warehousing output changed by 5.5%; the Transportation Services Index changed by 2.0% and rail carloadings by 8.0% from a year earlier, to 32.8 million tonnes in August 2026.
Transportation activity
Transportation Services Index (index) is plotted alone; rail carloadings are in the data table of the next chart.
Chart loads when it comes into view.
Latest values: Transportation Services Index, seasonally adjusted 92.4 (2026-08).
Related relationships: Transportation and warehousing
Railway carloadings
Millions of tonnes per month, all traffic carried.
Chart loads when it comes into view.
Latest values: Total traffic carried 32.79 (2026-08).
Related relationships: Transportation and warehousing
The information and communication technology sector produces 6.0% of real output; its output changed by 3.0% over the year and is 30.5% higher than at the end of 2019. Professional, scientific and technical services output changed by -0.1% and employment by 1.2%. Investment in data centres, artificial intelligence and clean technology is not measured separately and is not assessed here.
Finance and insurance output changed by 2.6% over the year, and finance, insurance, real estate and leasing employment changed by -1.8%. Finance, insurance, real estate and leasing was 8.7% of Ontario's employment in 2025.
Tourism is not a single industry in these series. A partial indicator is non-resident visitors entering Canada: 4.2 million in August 2026, 4.6% more than a year earlier, of which residents of the United States are 77.8%. Seasonal patterns make comparisons with other months misleading, so only same-month comparisons are shown.
Non-resident visitors entering Canada
Visitors per month; United States residents are shown separately.
Chart loads when it comes into view.
Latest values: All non-resident visitors 4.222 (2026-08); United States residents 3.287 (2026-08).
Electricity generation was 51.6 TWh in August 2026, 8.5% higher than a year earlier: hydro is 54.8%, combustible fuels 26.3%, nuclear 12.4%, wind 5.1% and solar 1.3%. Wind generation changed by 1.0% and solar by -7.0% from the same month a year earlier.
Statistics Canada attributed July's rebound in utility output to electric power generation, transmission and distribution helped by a heat wave; in August utility output fell as nuclear generating stations in Ontario and New Brunswick underwent maintenance outages.
Evidence: Statistics Canada: The Daily: Gross domestic product by industry, July 2026; Statistics Canada: The Daily: Gross domestic product by industry, August 2026
Electricity generation by source
Terawatt-hours per month, all producers.
Chart loads when it comes into view.
Latest values: All sources 51.59 (2026-08); Hydro 28.25 (2026-08); Nuclear 6.399 (2026-08); Combustible fuels 13.58 (2026-08); and 2 more in the data table.
Statistics Canada publishes the value of mineral shipments by mineral. The value of shipments (current dollars, so prices are included) was C$773 million for copper in August 2026, C$992 million for potash, C$309 million for nickel, C$38 million for cobalt, C$21 million for zinc and C$3.1 billion for gold. Copper's value of shipments is 122.8% higher than a year earlier and nickel's 38.3%; the copper price went from US$9,670 a tonne in August 2025 to US$14,326 in August 2026, so part of the change is price, and the volume effect cannot be separated here. This report does not say which of these minerals the federal government classes as critical, because it does not hold that list, and it has no data on mine output volumes, processing capacity or exploration spending.
Value of mineral shipments: selected metals and minerals
C$ billions a month, current dollars, unadjusted (Statistics Canada). Values include price changes; some months are suppressed for confidentiality and some minerals are not shown because every recent month is suppressed or zero.
Chart loads when it comes into view.
Latest values: Copper 0.773 (2026-08); Nickel 0.309 (2026-08); Cobalt 0.038 (2026-08); Zinc 0.021 (2026-08); and 3 more in the data table.
Value of gold shipments
C$ billions a month, current dollars, unadjusted (Statistics Canada).
Chart loads when it comes into view.
Latest values: Gold 3.109 (2026-08).
Why it happened
Industry outputs can respond to different drivers: oil and gas to commodity prices and capital spending, manufacturing to export demand and inputs, construction to financing and approvals, and services to household incomes. The data here record that each industry moved differently over the year; they do not establish causes. The explorer records documented exposures between industries and provinces.
Why it matters
Industry structure determines how regions respond to shocks. The employment shares above show that provinces differ in what they produce, and the export shares show how differently the same shock would reach them. A shock to oil prices would reach Alberta, Saskatchewan and Newfoundland and Labrador through export values and public revenue much more than through employment, while a shock to US demand for manufactured goods would reach Ontario and Quebec through factory jobs.
How much of each province’s employment is in one industry
Share of provincial employment, 2025 annual average (Labour Force Survey). A measured exposure to an industry, not an estimate of how much output or income depends on it. “Resources” combines forestry, fishing, mining, quarrying and oil and gas.
Chart loads when it comes into view.
Top values: Newfoundland and Labrador 6.37%; Alberta 5.58%; Saskatchewan 3.76%.
History
Oil and gas extraction is 15.8% above its end-2019 level and manufacturing -4.2% relative to it. Manufacturing sales are 39.6% higher in current dollars than at the end of 2019, which is far more than real output, again reflecting prices. Crude oil production has risen 31.1% since January 2016.
Across geographies
Resource-heavy economies (Alberta, Saskatchewan, Newfoundland and Labrador) and manufacturing-heavy economies (Ontario, Quebec) face different drivers, as the employment and export shares above show. City-level industry structure is not published on a basis comparable with these provincial figures and is addressed, where possible, in the city reports.
What it influences
Industry output feeds employment, exports, investment and public revenue. The oil price has sourced links to energy investment, national income, consumer energy prices and exports, and the explorer connects industries to provinces through measured exposures.
Energy-related output is exposed to world prices: Brent crude was US$125.00 a barrel in October 2026 and the European gas price US$28.50 per million BTU; the Global report's energy section covers the world market and the commodities section metals, potash and grains.
Risks
In September the Bank of Canada said tariffs will raise costs for some businesses. On 28 October it said that, owing to new US tariffs, growth is expected to slow in the fourth quarter of 2026, before picking up again in 2027. Industries that sell most of their output to the United States are the most exposed to tariff changes; this report does not measure which industries those are, because tariff coverage and sales by destination are not held here by industry.
Evidence: Bank of Canada: Bank of Canada raises the policy rate by 25 basis points to 2½% (28 October 2026); Bank of Canada: Bank of Canada maintains the policy rate (2 September 2026)
What it means for decisions
For an employer or investor. The sectors that have grown fastest in real terms since 2000 are finance, information and professional services. The one large sector that has shrunk, manufacturing, is exposed to trade and exchange-rate risk. Both facts matter for hiring and location decisions.
For a policymaker. Output growth and job growth are different goals. Agriculture, manufacturing and finance have increased output per job; health care, construction and public services have added many jobs. Policy that targets one of these does not automatically produce the other. The shift away from goods production and towards services also changes how shocks arrive: services are less traded, so a drop in US demand matters less for them than for factories, and they depend more on domestic demand.
For a region. The industry shares in this section show how much provinces differ in what they produce. These series do not measure how much of a province's growth comes from its mix of industries. The provincial comparisons later in the report use these shares.
What the data cannot say. The series are real output and employment, not profits, wages or investment. They do not say whether the shift into services has been good or bad for living standards; they say that it has happened. The chained-dollar shares are approximate, and the latest employment month is later than the latest output month, so the two sides of each pair do not end on the same date.
What to watch
Monthly GDP by industry (next release 30 November 2026), the manufacturing survey, crude oil production, auto sector exports and the effect of tariff changes on manufacturing orders.
Prepared with AI assistance.
Follow the relationships
- Forestry, fishing, mining, quarrying, oil and gas 11 with evidence · 11 recorded Open in Studio
- Manufacturing 12 with evidence · 12 recorded Open in Studio
- Construction 10 with evidence · 10 recorded Open in Studio
- Transportation and warehousing 10 with evidence · 10 recorded Open in Studio
- Agriculture 10 with evidence · 10 recorded Open in Studio
- Finance, insurance, real estate, rental and leasing 10 with evidence · 10 recorded Open in Studio
- Crude oil production 1 with evidence · 1 recorded Open in Studio
Upcoming releases
- 2026-11-13 Monthly Survey of Manufacturing September 2026 · Statistics Canada
- 2026-11-30 Gross domestic product by industry September 2026 · Statistics Canada
Sources for this section (12 datasets, 7 documents)
Data
- Gross domestic product (GDP) at basic prices, by industry, monthly (36-10-0434-01; 17 series; latest August 2026; retrieved 2026-11-05)
- Employment by industry, monthly, seasonally adjusted and unadjusted, and trend-cycle, last 5 months (14-10-0355-01; 7 series; latest October 2026; retrieved 2026-11-07)
- Supply and disposition of crude oil and equivalent (25-10-0063-01; 2 series; latest August 2026; retrieved 2026-11-05)
- International merchandise trade by commodity, monthly (12-10-0163-01; 3 series; latest September 2026; retrieved 2026-11-05)
- Manufacturers' sales, inventories, orders and inventory to sales ratios, by industry (dollars unless otherwise noted) (16-10-0047-01; 3 series; latest August 2026; retrieved 2026-10-23)
- Investment in Building Construction (34-10-0293-01; 1 series; latest August 2026; retrieved 2026-10-23)
- Transportation Services Index, Canada level, unadjusted and seasonally adjusted, monthly (18-10-0293-01; 1 series; latest August 2026; retrieved 2026-11-05)
- Railway carloadings statistics, by total tonnage transported, monthly (23-10-0216-01; 1 series; latest August 2026; retrieved 2026-11-05)
- Non-resident visitors entering Canada, by country of residence (24-10-0050-01; 2 series; latest August 2026; retrieved 2026-10-23)
- Electric power generation, monthly generation by type of electricity (25-10-0015-01; 6 series; latest August 2026; retrieved 2026-11-05)
- Value of shipments of metallic and non-metallic minerals, monthly (16-10-0021-01; 6 series; latest August 2026; retrieved 2026-10-23)
- Copper, monthly average price (Pink Sheet (monthly prices); 3 series; latest October 2026; retrieved 2026-11-05)
Documents cited
- Statistics Canada: The Daily: Gross domestic product by industry, August 2026 (retrieved 2026-11-07)
- Bank of Canada: Rhys Mendes, Opening Statement before the House of Commons Standing Committee on Finance, 12 March 2015 (retrieved 2026-11-07)
- Statistics Canada: The Daily: Industrial product and raw materials price indexes, September 2026 (retrieved 2026-10-22)
- Statistics Canada: The Daily: Gross domestic product, income and expenditure, second quarter 2026 (retrieved 2026-10-22)
- Statistics Canada: The Daily: Gross domestic product by industry, July 2026 (retrieved 2026-10-25)
- Bank of Canada: Bank of Canada raises the policy rate by 25 basis points to 2½% (28 October 2026) (retrieved 2026-11-07)
- Bank of Canada: Bank of Canada maintains the policy rate (2 September 2026) (retrieved 2026-10-22)
Each dataset is used under its licence; attribution and series-level detail are in each chart’s “About this data” panel. Limitations: Output is real GDP at basic prices by industry (chained 2017 dollars); shares of real GDP are approximate because chained dollars are not additive. Industry categories follow NAICS; mining combines oil and gas extraction with mining and quarrying, and critical minerals, data centres, clean technology and tourism are not separately measured. Manufacturing sales are in current dollars and include price changes. Employment shares come from the Labour Force Survey and are not output shares.
How large is Canadian agriculture, how is it doing, and how much does it rely on exports?
Agriculture, forestry, fishing and hunting produce C$44.2 billion of real output a year; in August 2026 output was 7.7% below a year earlier, and in September 2026 farm, fishing and intermediate food products were 7.0% of merchandise exports
Graphic: What has happened to grain and fertilizer prices since 2019
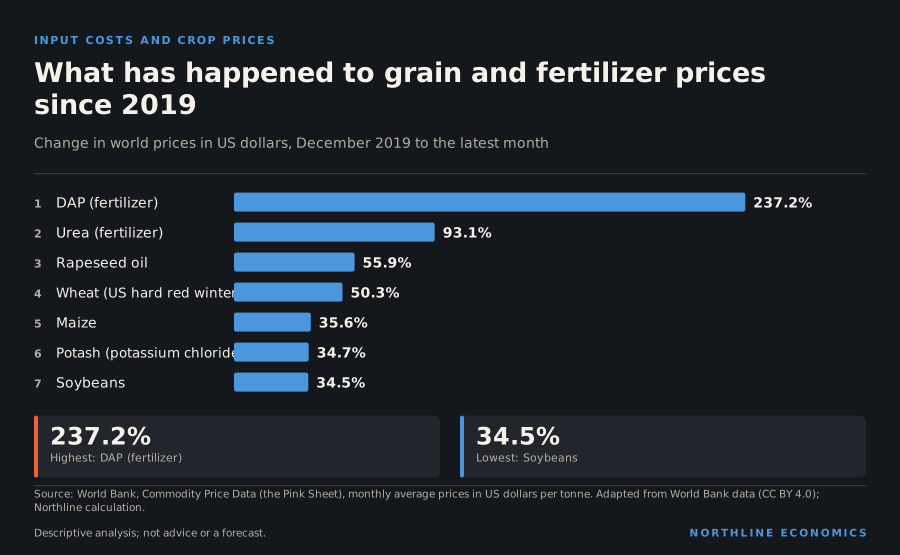
What happened
Real output of agriculture, forestry, fishing and hunting was C$44.2 billion at an annual rate in August 2026, -7.7% on a year earlier and 7.7% above its level at the end of 2019. Employment in agriculture was 222 thousand in October 2026, -3.9% over the year.
Real output by industry, indexed
Monthly real GDP at basic prices, chained 2017 dollars; start of the period = 100. Industry shares of real GDP are not additive in chained dollars.
Chart loads when it comes into view.
Latest values: Goods-producing 600,300,000,000 (2026-08); Services-producing 1,778,000,000,000 (2026-08); Mining, quarrying, oil and gas 123,400,000,000 (2026-08); Manufacturing 202,900,000,000 (2026-08); and 5 more in the data table.
Related relationships: Forestry, fishing, mining, quarrying, oil and gas · Manufacturing · Construction · Finance, insurance, real estate, rental and leasing
Merchandise exports of farm, fishing and intermediate food products were C$5.5 billion in September 2026, 7.0% of all merchandise exports and 18.9% on a year earlier.
More from fewer
The most striking thing about Canadian agriculture is how much has changed in how it is done. Real output in January 2000 was C$30.9 billion a year; it is C$44.2 billion now, up 43.3%. Employment in agriculture was 396 thousand in January 2000 and is 222 thousand, down 44.0%. On these two measures, which differ in scope, output per job is therefore more than two and a half times what it was.
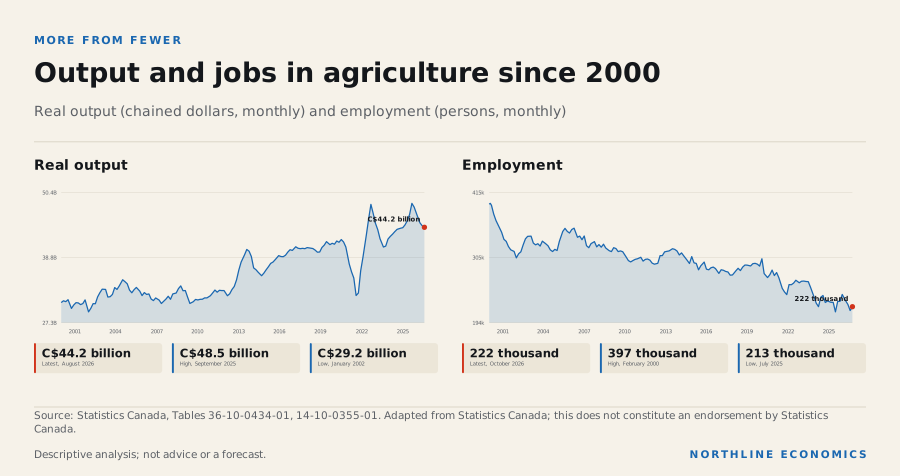
The data behind this graphic
| Panel | Shows |
|---|---|
| Real output | timeline |
| Employment | timeline |
Output swings with the weather. The monthly series reached C$48.5 billion in September 2025, when record yields were reported across the Prairies, and was C$30.6 billion in June 2007. The latest figure is 7.7% below a year earlier, a month close to that record. The long trend is the more reliable guide.
Prices on both sides of the fence
A farm’s income is the difference between what it sells and what it pays for seed, fertilizer, fuel, labour and credit. The world prices of grain and oilseeds, and of fertilizer, are available monthly in US dollars, and the comparison with 2019 is revealing.
The opening chart shows that grain and oilseed prices are well above their end-2019 levels: wheat is up 50.3%, rapeseed oil 55.9%, maize 35.6% and soybeans 34.5%. Fertilizer has risen by about as much or more: urea 93.1% and DAP, the main phosphate fertilizer, 237.2%. Potash, which Canada produces and exports, is up 34.7%, a smaller rise than for the grains. For a farm that buys phosphate fertilizer, input costs have risen faster than output prices since 2019. For a farm that grows wheat and buys potash, the reverse is true. Farms are not alike, and the national data say nothing about which type is common.
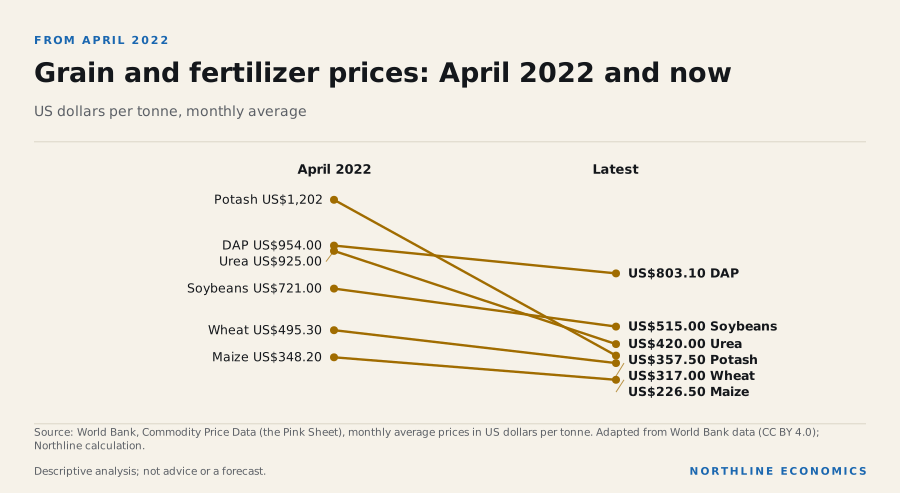
The data behind this graphic
| Item | April 2022 | Latest |
|---|---|---|
| Wheat | US$495.30 | US$317.00 |
| Maize | US$348.20 | US$226.50 |
| Soybeans | US$721.00 | US$515.00 |
| Urea | US$925.00 | US$420.00 |
| DAP | US$954.00 | US$803.10 |
| Potash | US$1,202 | US$357.50 |
Prices have come down from their 2022 highs, which came in April for maize and the three fertilizers and a month or two later for wheat and soybeans. In April 2022, wheat was US$495.30 a tonne and it is US$317.00 now. Urea fell from US$925.00 to US$420.00 and potash from US$1,202 to US$357.50, the largest fall of the group. DAP is the exception: at US$803.10 it has fallen far less than the others from its US$954.00 of April 2022. These are US-dollar prices, so Canadian dollar prices also depend on the exchange rate.
Consumer food prices, by contrast, were only 2.2% higher in September 2026 than a year earlier, compared with a peak of 10.4% in January 2023. The data do not say how farm and retail prices are linked.
A trading sector
Canadian agriculture sells more abroad than it buys. Over the last twelve months exports of farm, fishing and intermediate food products were C$61.9 billion and imports C$34.1 billion. In the latest month exports were 18.9% above a year earlier and 63.8% above December 2019. Those are current-dollar figures, so they include price changes; prices rose between 2019 and 2022 and have since eased, so part of the dollar increase is price, and the volume change cannot be read from these figures.
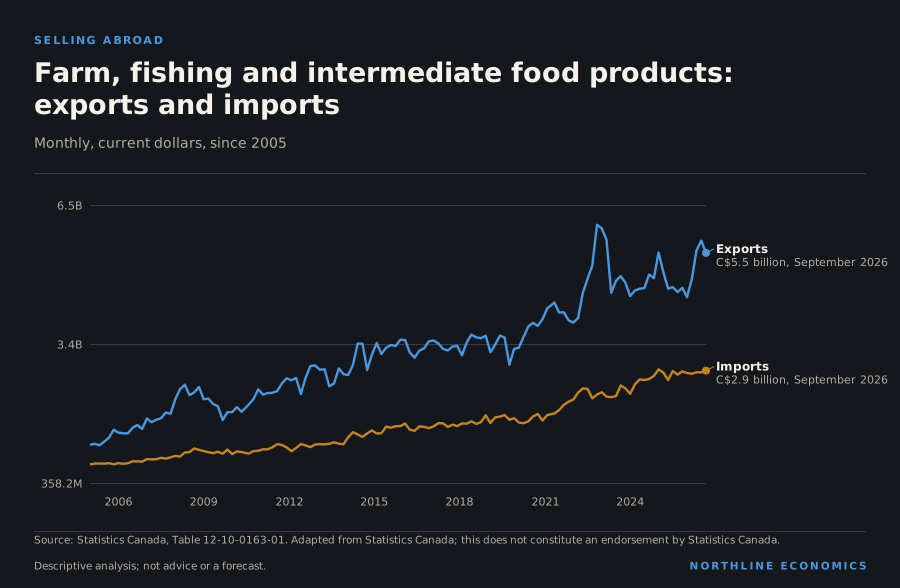
The data behind this graphic
| Series | Latest |
|---|---|
| Exports | C$5.5 billion, September 2026 |
| Imports | C$2.9 billion, September 2026 |
The monthly figure peaked at C$6.1 billion in November 2022 and is C$5.5 billion now. The category is broad: it includes crops, livestock, fish and processed intermediate foods, and the data cannot say which products are driving the change. The section on trade carries the partner detail, and the trade partners note sets out how much of Canada’s trade depends on the United States, China and others. The facts cited in the next sections show that trade restrictions on canola, one of the largest crops, have changed marketings, and that canola exports rose in July 2026.
Why it happened
Statistics Canada reports that better growing conditions pushed yields and production for several crops grown mainly in the Prairies to record highs in 2025, with wheat production at a record 40.0 million tonnes and canola at 21.8 million tonnes.
Evidence: Statistics Canada: Production of principal field crops, November 2025 (The Daily)
Statistics Canada's farm income release says that despite record yields in 2025 canola receipts declined 6.4 per cent because reduced canola exports, which it attributes to trade restrictions, led to lower marketings, that geopolitical tensions put downward pressure on grain and oilseed prices, and that livestock receipts rose 13.3 per cent on higher prices for most livestock commodities. Realized net income fell slightly to 8.3 billion dollars.
Why it matters
The sector's share of national output and of exports is given above; its importance differs by province, and it is exposed to weather, world prices and trade measures. These data cannot say how exposed any province or business is.
History
The output series starts in the national accounts' monthly industry table. Agricultural output swings with growing conditions, so a single year says little. Monthly farm, fishing and intermediate food exports peaked at C$6.1 billion in November 2022 within the past ten years and changed by 63.8% between December 2019 and September 2026; employment in agriculture changed by -23.7% between December 2019 and October 2026. Export values are in current dollars, so they include price changes.
Exports by commodity group, indexed
Monthly, balance-of-payments basis, seasonally adjusted; start of the period = 100.
Chart loads when it comes into view.
Latest values: Energy products 20,640,000,000 (2026-09); Motor vehicles and parts 7,332,000,000 (2026-09); Farm, fishing and food products 5,484,000,000 (2026-09); Forestry and building materials 3,424,000,000 (2026-09); and 4 more in the data table.
Related relationships: 2 relationships use this data as evidence
Across geographies
Provincial output in agriculture is annual and is not shown here. Employment shares are: agriculture accounted for 4.6% of employment in Saskatchewan, 2.0% in Manitoba, 3.5% in Prince Edward Island, 1.5% in Alberta, 0.8% in Ontario and 0.6% in British Columbia in the Labour Force Survey's latest annual average. The industry section charts the same shares for every province, and the share of employment is not the share of output or income.
How much of each province’s employment is in one industry
Share of provincial employment, 2025 annual average (Labour Force Survey). A measured exposure to an industry, not an estimate of how much output or income depends on it. “Resources” combines forestry, fishing, mining, quarrying and oil and gas.
Chart loads when it comes into view.
Top values: Newfoundland and Labrador 6.37%; Alberta 5.58%; Saskatchewan 3.76%.
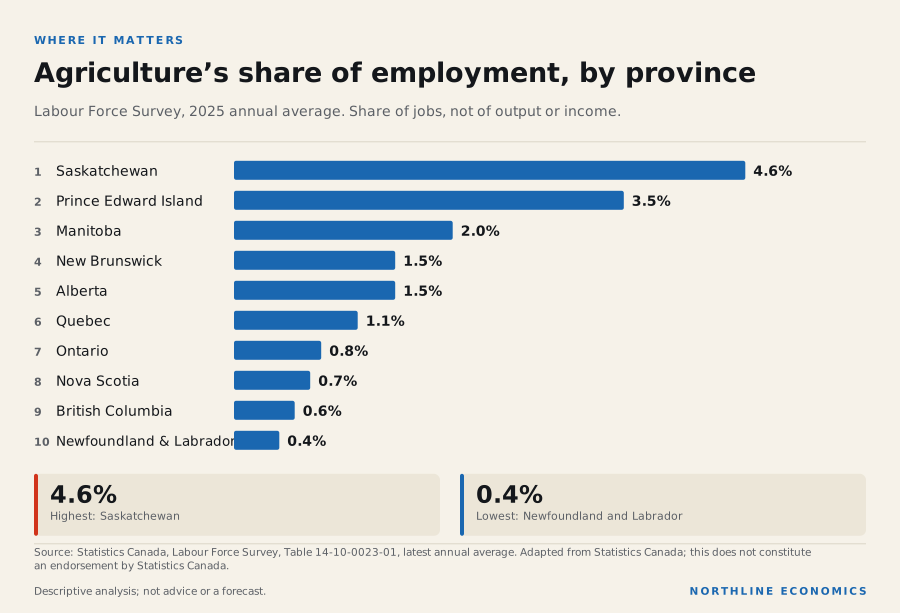
The data behind this graphic
| Item | Value |
|---|---|
| Saskatchewan | 4.6% |
| Prince Edward Island | 3.5% |
| Manitoba | 2.0% |
| New Brunswick | 1.5% |
| Alberta | 1.5% |
| Quebec | 1.1% |
| Ontario | 0.8% |
| Nova Scotia | 0.7% |
| British Columbia | 0.6% |
| Newfoundland and Labrador | 0.4% |
Saskatchewan, at 4.6%, has the largest share of its jobs in agriculture, followed by Prince Edward Island (3.5%) and Manitoba (2.0%). In the two largest provinces, Ontario and Quebec, the share is about one job in a hundred. Employment shares may understate the sector’s weight in the Prairies, because processing, transport and input supply employ people who are counted in other industries.
What it influences
Statistics Canada reports that canola exports rose 43.2 per cent in July 2026, mainly on higher shipments to China, Pakistan and Japan, and were up 32.2 per cent in the first seven months of 2026.
Evidence: Statistics Canada: Canadian international merchandise trade, July 2026 (The Daily)
Its rail releases add that, with elevated stocks of principal field crops and strong global demand, grain shipments by rail remained strong in July, and that in August loadings of wheat and canola rose sharply from a year earlier.
Evidence: Statistics Canada: Railway carloadings, July 2026 (The Daily); Statistics Canada: Railway carloadings, August 2026 (The Daily)
In February 2026 Agriculture and Agri-Food Canada said the record grain crop of 2025 should support increased marketings and crop receipts in 2026 and forecast net cash income up 3% to 20.2 billion dollars. These are different income measures from the one above and are not compared.
Evidence: Agriculture and Agri-Food Canada: Farm Income Forecast for 2025-2026
Risks
In the same February forecast Agriculture and Agri-Food Canada said uncertainty around the trade environment could have a significant impact on its 2026 forecast results.
Evidence: Agriculture and Agri-Food Canada: Farm Income Forecast for 2025-2026
Budget 2025 describes the support then in place: additional AgriStability funding, a temporary rise in the Advance Payments Program's interest-free limit for canola advances, and a Farm Credit Canada trade-disruption lending program. The latest monthly values are preliminary and are revised. Export values are in current dollars and move with prices as well as volumes. Nothing here is a Northline forecast.
Evidence: Finance Canada: Budget 2025, Chapter 2: Shifting from reliance to resilience
What it means for decisions
For a farm. The comparison of crop and input prices is a reminder that margins depend on the mix of crops grown and inputs bought. A producer of canola and wheat faces a different mix of risks from a producer of livestock; the facts cited above show that livestock receipts rose while canola receipts fell in the same year.
For a lender or insurer. Output swings with the weather and the world price. The federal support programs cited in the risks section are one response.
For an exporter or trade policymaker. Agriculture is one of the sectors where trade restrictions have a direct effect on receipts, as the canola case shows. The sector runs a surplus (C$61.9 billion of exports against C$34.1 billion of imports).
For a region. The Prairies and Prince Edward Island have the largest dependence in jobs. In the rest of the country agriculture is a small share of employment, though it feeds an industrial food-processing sector that the figures here do not measure.
What the data cannot say. The series do not show crop areas, input costs for Canadian farmers in Canadian dollars, farm debt or income by farm type. World prices are US-dollar benchmark prices, not what Canadian farms received. Nothing here is a forecast.
What to watch
The next releases of the monthly GDP by industry and of merchandise trade (see the release calendar). No other release date is assumed.
Prepared with AI assistance.
Follow the relationships
- Merchandise exports 4 with evidence · 4 recorded Open in Studio
Upcoming releases
- 2026-11-30 Gross domestic product by industry September 2026 · Statistics Canada
- 2026-12-08 Canadian international merchandise trade October 2026 · Statistics Canada
Sources for this section (5 datasets, 7 documents)
Data
- Gross domestic product (GDP) at basic prices, by industry, monthly (36-10-0434-01; 1 series; latest August 2026; retrieved 2026-11-05)
- Employment by industry, monthly, seasonally adjusted and unadjusted, and trend-cycle, last 5 months (14-10-0355-01; 1 series; latest October 2026; retrieved 2026-11-07)
- International merchandise trade by commodity, monthly (12-10-0163-01; 2 series; latest September 2026; retrieved 2026-11-05)
- Wheat, US HRW, monthly average price (Pink Sheet (monthly prices); 7 series; latest October 2026; retrieved 2026-11-05)
- Consumer Price Index, monthly, not seasonally adjusted (18-10-0004-01; 1 series; latest September 2026; retrieved 2026-10-23)
Documents cited
- Statistics Canada: Production of principal field crops, November 2025 (The Daily) (retrieved 2026-10-25)
- Statistics Canada: Farm income, 2025 (The Daily) (retrieved 2026-10-25)
- Statistics Canada: Canadian international merchandise trade, July 2026 (The Daily) (retrieved 2026-10-25)
- Statistics Canada: Railway carloadings, July 2026 (The Daily) (retrieved 2026-10-25)
- Statistics Canada: Railway carloadings, August 2026 (The Daily) (retrieved 2026-11-07)
- Agriculture and Agri-Food Canada: Farm Income Forecast for 2025-2026 (retrieved 2026-10-25)
- Finance Canada: Budget 2025, Chapter 2: Shifting from reliance to resilience (retrieved 2026-10-25)
Each dataset is used under its licence; attribution and series-level detail are in each chart’s “About this data” panel. Limitations: Output covers agriculture, forestry, fishing and hunting combined, so it is not farm output alone. Exports are the balance-of-payments category of farm, fishing and intermediate food products, which excludes finished food and does not separate the farm products. Grain and fertilizer prices are world benchmarks in US dollars, not what Canadian farms paid or received. Provincial output is annual and is not shown here. Canadian farm input costs, land values and the effects of weather and trade policy on output are not assessed. Federal support programs are as Budget 2025 described them; the agri-food measures in Budget 2026, tabled on 5 November 2026, are not assessed.
How large are Canada's technology and knowledge industries, and how does investment in research compare?
The information and communication technology sector produced 6.0% of real output in August 2026, professional, scientific and technical services employed 2.0 million people in October 2026, and research spending is 1.8% of GDP (2024) against 3.4% in the United States (2023)
Graphic: Research and development as a share of GDP, 2000 and the latest year
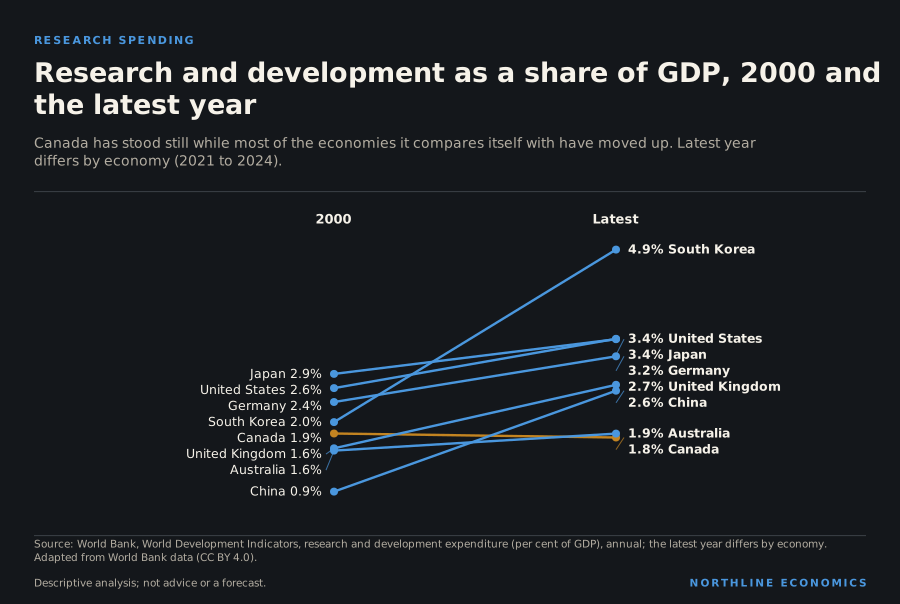
What happened
The information and communication technology sector produced C$143.1 billion of real output at an annual rate in August 2026, 6.0% of the economy, 3.0% on a year earlier and 30.5% above its end-2019 level. Professional, scientific and technical services produced C$168.3 billion, -0.1% on a year earlier, and employed 2.0 million people in October 2026, 1.2% over the year. Information, culture and recreation employed 871 thousand.
Real output by industry, indexed
Monthly real GDP at basic prices, chained 2017 dollars; start of the period = 100. Industry shares of real GDP are not additive in chained dollars.
Chart loads when it comes into view.
Latest values: Goods-producing 600,300,000,000 (2026-08); Services-producing 1,778,000,000,000 (2026-08); Mining, quarrying, oil and gas 123,400,000,000 (2026-08); Manufacturing 202,900,000,000 (2026-08); and 5 more in the data table.
Related relationships: Forestry, fishing, mining, quarrying, oil and gas · Manufacturing · Construction · Finance, insurance, real estate, rental and leasing
Employment in professional, scientific and technical services changed by 29.1% between December 2019 and October 2026, and in information, culture and recreation by 11.4%. Average hourly wages in professional, scientific and technical services were C$51.32 an hour in October 2026, 1.9% on a year earlier, against C$37.89 an hour for all industries (2.2%).
Canadian exports of electronic and electrical equipment and parts were C$3.2 billion in September 2026, 9.2% on a year earlier.
Industries that grew faster than the economy
Information and communication technology has been among the fastest-growing parts of the Canadian economy for as long as the series runs. Its real output is C$143.1 billion a year, 71.3% above January 2007, while the economy as a whole is 42.5% higher. Since the end of 2019 the gap has widened: ICT output is up 30.5% and the economy 12.4%.
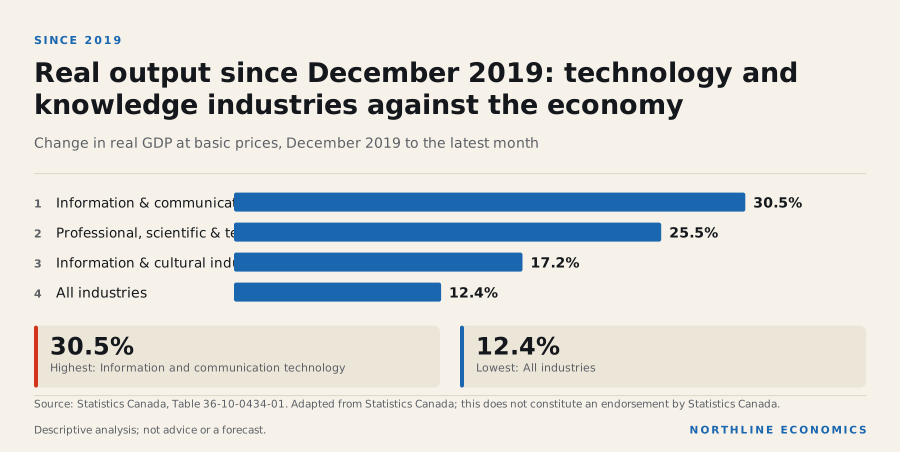
The data behind this graphic
| Item | Value |
|---|---|
| Information and communication technology | 30.5% |
| Professional, scientific and technical services | 25.5% |
| Information and cultural industries | 17.2% |
| All industries | 12.4% |
Professional, scientific and technical services, which include law, accounting, engineering, architecture, design and computer systems design, are a larger sector, at C$168.3 billion. Output is up 25.5% since December 2019 but changed by -0.1% over the latest year, and the sector employs 2.0 million people, 29.1% more than at the end of 2019. Information and cultural industries, which cover publishing, broadcasting, telecommunications and film, have grown by 17.2%, faster than the economy but more slowly than the other two. The wider information, culture and recreation group employs 871 thousand.
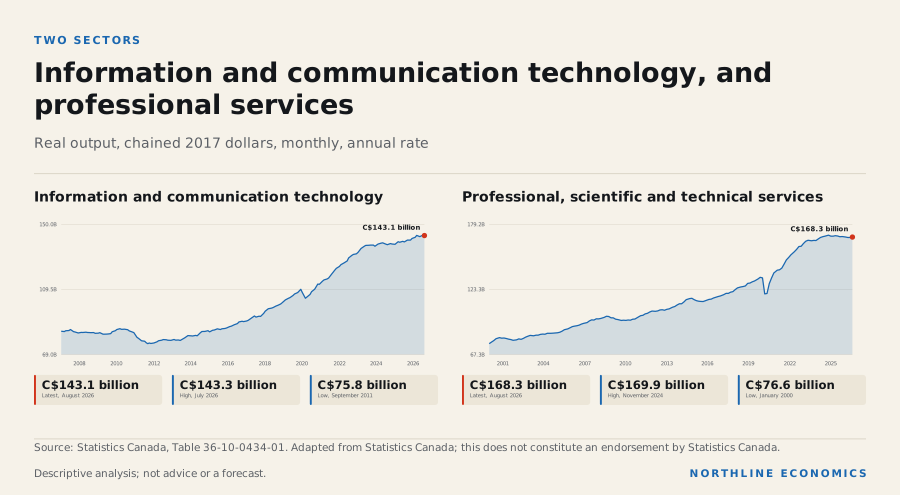
The data behind this graphic
| Panel | Shows |
|---|---|
| Information and communication technology | timeline |
| Professional, scientific and technical services | timeline |
Pay has followed. Average hourly wages in professional, scientific and technical services are C$51.32 an hour, against C$37.89 an hour across all industries, a premium of about a third, and they have grown faster than the average since December 2019 (40.2% against 32.3%; neither wage series is seasonally adjusted).
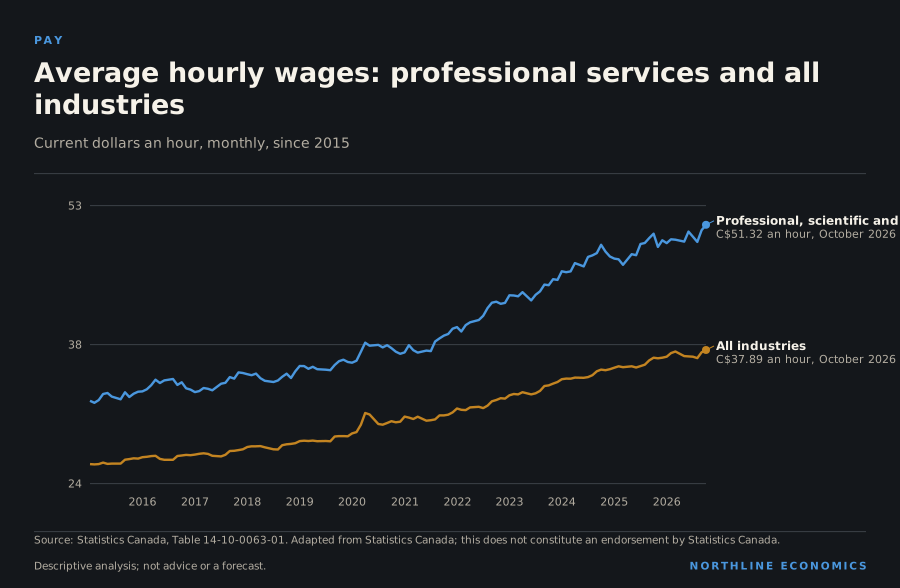
The data behind this graphic
| Series | Latest |
|---|---|
| Professional, scientific and technical services | C$51.32 an hour, October 2026 |
| All industries | C$37.89 an hour, October 2026 |
Wages in current dollars include inflation. Both lines are measured the same way, so the gap between them is a real difference, but the series say nothing about the quality or experience of the workers they cover.
Research spending: standing still
The sector’s growth stands against a measure of national effort that has not moved. Canada’s spending on research and development was 1.9% of GDP in 2000 and is 1.8% in 2024. Over the same period, the United States moved from 2.6% to 3.4%, Germany from 2.4% to 3.2% and the United Kingdom from 1.6% to 2.7%. South Korea’s share more than doubled, from 2.0% to 4.9%, and China’s nearly tripled, from 0.9% to 2.6%.
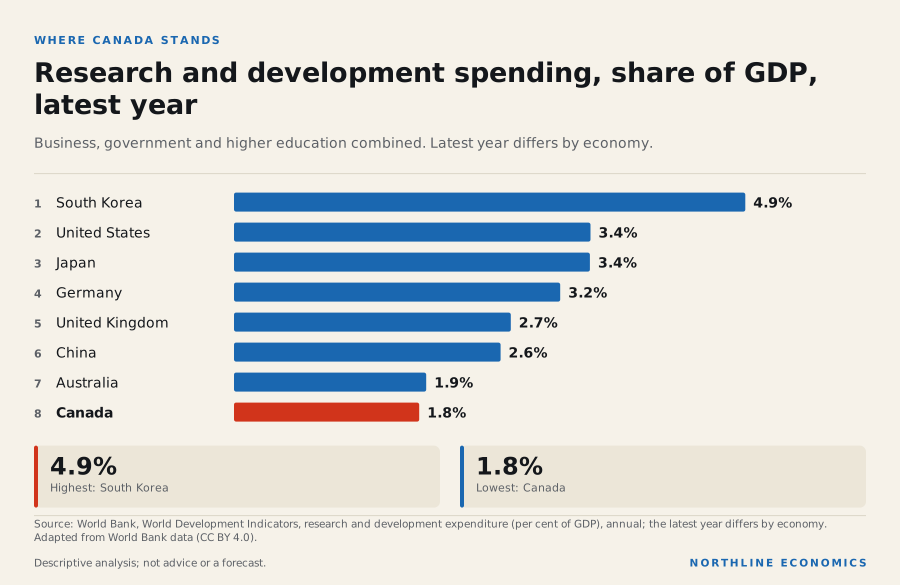
The data behind this graphic
| Item | Value |
|---|---|
| South Korea | 4.9% |
| United States | 3.4% |
| Japan | 3.4% |
| Germany | 3.2% |
| United Kingdom | 2.7% |
| China | 2.6% |
| Australia | 1.9% |
| Canada | 1.8% |
On the latest figures Canada’s share is the lowest of the eight economies shown, but Australia’s latest figure is for 2021, and in that year Canada’s share (1.9%) was about the same as Australia’s (1.9%). In 2000 Canada’s share was above those of the United Kingdom, Australia and China. The spending figure is an input, not a result: it does not say how well the money is used, how much comes from business, or how much produces patents, products or productivity. The comparison does show that the country’s share is about the same as a quarter-century ago while others have increased theirs, and the productivity section shows output per hour has grown slowly over the same period. The data cannot say whether those two facts are linked.
A deficit in things
Not all technology is software. Canada exported C$38.0 billion of electronic and electrical equipment and parts over the last twelve months and imported C$104.4 billion. Imports are more than two and a half times exports. Exports in the latest month were 9.2% above a year earlier, after a twenty-year high of C$3.8 billion in August 2026, but the balance is a reminder that the economy’s strength in services does not carry over to manufactured equipment.
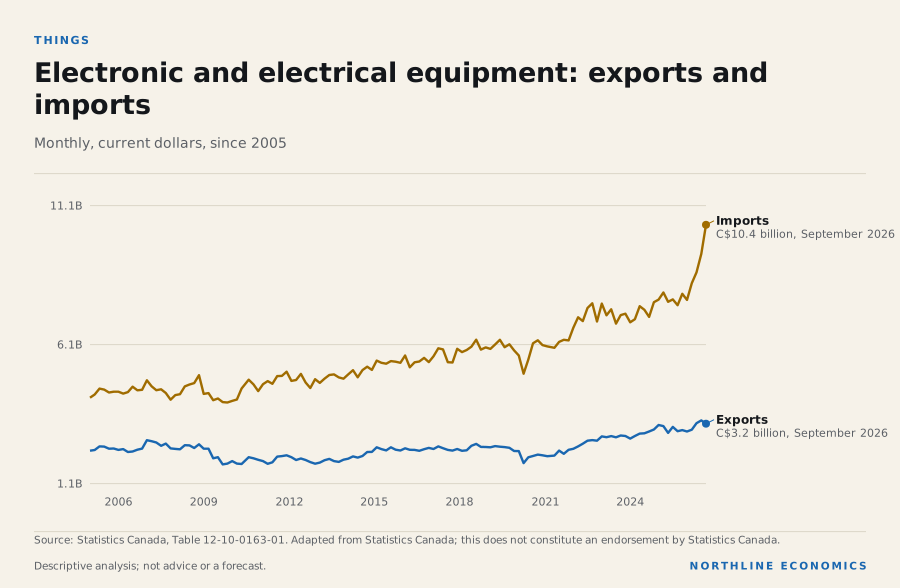
The data behind this graphic
| Series | Latest |
|---|---|
| Exports | C$3.2 billion, September 2026 |
| Imports | C$10.4 billion, September 2026 |
Why it happened
Statistics Canada reports that in the second quarter of 2026 19.2% of businesses reported using AI to produce goods or deliver services, most often in information and cultural industries, finance and insurance, and professional, scientific and technical services, and that cybersecurity or privacy concerns (13.4%) and cost were the leading barriers.
It adds that generative AI tools were used by 35.9% of workers in March 2026, and that use at work was most prevalent in professional, scientific and technical services.
A Bank of Canada speech says adoption is gaining steam but is uneven across sectors and that signs of small productivity gains are emerging.
Evidence: Bank of Canada: Productivity in the age of AI (speech summary, M. Alexopoulos)
Why it matters
Technology matters for productivity, but the national accounts show only the industries as classified, not how technology is used across all industries, and these series do not measure productivity in the sector.
A Statistics Canada study finds that AI adopters are 16.8% more productive than non-adopters but says much of the advantage reflects firm selection and broader innovation capacity and digital transformation rather than AI alone.
Evidence: Statistics Canada: Economic and Social Reports, April 2026 (The Daily)
History
Research and development spending was 1.8% of GDP in Canada (2024), 3.4% in the United States (2023), 4.9% in South Korea (2023), 3.2% in Germany and 2.7% in the United Kingdom.
Research and development spending
Percent of GDP.
Chart loads when it comes into view.
Latest values: Canada 1.791 (2024); United States 3.447 (2023); China 2.577 (2023); Japan 3.441 (2023); and 9 more in the data table.
Related relationships: United States · China · United Kingdom · Japan
Internet use reached 94.4% of the population in Canada (2024), against 94.7% in the United States, 97.9% in South Korea and 70.0% in India (2025). Labour productivity growth, which technology is often expected to raise, is covered in the productivity section; this section does not link the two.
Across geographies
In the 2021 Census, professional, scientific and technical services were 13.8% of jobs in Toronto, 12.6% in Vancouver, 10.7% in Ottawa–Gatineau and 12.9% in Calgary (May 2021, pandemic conditions; see the city pages). Technology employment as such is not available over time for provinces or metropolitan areas in the tables used here.
What it influences
A Statistics Canada study of employment says gains in coding-intensive jobs were concentrated among workers aged 30 to 49 while the number of coding professionals younger than 30 stagnated, and that it makes no attempt to quantify AI-driven job losses.
The Bank of Canada speech notes that earlier computerization affected workers and businesses in different ways but ultimately did not lead to fewer jobs.
Evidence: Bank of Canada: Productivity in the age of AI (speech summary, M. Alexopoulos)
The federal industry department says building compute infrastructure is critical to helping businesses adopt new technologies and that Canada is well positioned to attract AI infrastructure investment because of its geography, climate and energy sources. No source-backed link from technology industries to labour productivity is recorded here.
Risks
The Bank of Canada's October 2026 Monetary Policy Report says that investment related to artificial intelligence continues to support economic activity in the United States and parts of Asia, and names among the downside risks that investors could become less optimistic about earnings and productivity gains related to artificial intelligence, triggering a fall in equity prices and wider corporate spreads. Research spending is an input, not a measure of results, and the series have different latest years. Monthly industry output is revised. Nothing here is a forecast.
Evidence: Bank of Canada: Monetary Policy Report, October 2026: Global economy; Bank of Canada: Monetary Policy Report, October 2026: Risks
What it means for decisions
For a technology company. The domestic market for its services has grown faster than the economy since 2019, and wages for the workers it competes for have risen faster than average over that period. Research spending by Canadian firms and governments is not rising as a share of GDP, so a company that relies on public research support should not assume the share will increase.
For an employer in any industry. The Statistics Canada findings cited above show that AI is used most in information, finance and professional services and that cost and cybersecurity are the main barriers. The adoption gap between sectors is where the productivity effects, if they come, may show up first.
For a policymaker. The research-spending comparison is the clearest benchmark in this report: about the same share as in 2000, and on the latest figures the lowest of the eight economies shown, level with Australia when the same year is compared. How much to raise it, and in what form, are policy choices the data do not settle.
For an investor. The sector has outgrown the economy since 2019 and the pay premium has widened over that period. The Bank of Canada's October 2026 report says investment related to artificial intelligence continues to support economic activity in the United States.
Evidence: Bank of Canada: Monetary Policy Report, October 2026: Global economy
What the data cannot say. The series measure industries as classified, not technology use across all industries; there is no data here on venture capital, patents, start-ups or data centres. International research figures are for different years and are measured by the World Bank on a common definition, not Canada’s own.
What to watch
The next releases of monthly GDP by industry and of the Labour Force Survey (see the release calendar).
Prepared with AI assistance.
Follow the relationships
- Labour productivity 0 with evidence · 0 recorded Open in Studio
Upcoming releases
- 2026-11-30 Gross domestic product by industry September 2026 · Statistics Canada
- 2026-12-04 Labour Force Survey November 2026 · Statistics Canada
Sources for this section (7 datasets, 8 documents)
Data
- Gross domestic product (GDP) at basic prices, by industry, monthly (36-10-0434-01; 4 series; latest August 2026; retrieved 2026-11-05)
- Employment by industry, monthly, seasonally adjusted and unadjusted, and trend-cycle, last 5 months (14-10-0355-01; 2 series; latest October 2026; retrieved 2026-11-07)
- Employee wages by industry, monthly, unadjusted for seasonality (14-10-0063-01; 2 series; latest October 2026; retrieved 2026-11-07)
- International merchandise trade by commodity, monthly (12-10-0163-01; 2 series; latest September 2026; retrieved 2026-11-05)
- Place of work status by industry sector, work activity during the reference year, age and gender: Census metropolitan areas, tracted census agglomerations and census tracts of work (98-10-0492-01; 4 series; latest 1 January 2021; retrieved 2026-10-23)
- Research and development expenditure (% of GDP) (all economies; World Bank) (WDI GB.XPD.RSDV.GD.ZS; series; latest annual; retrieved 2026-10-23)
- Individuals using the Internet (% of population) (all economies; World Bank) (WDI IT.NET.USER.ZS; series; latest annual; retrieved 2026-10-23)
Documents cited
- Statistics Canada: Analysis on artificial intelligence use by businesses in Canada, second quarter of 2026 (retrieved 2026-10-25)
- Statistics Canada: Use of generative artificial intelligence tools among Canadian workers, March 2026 (The Daily) (retrieved 2026-10-25)
- Bank of Canada: Productivity in the age of AI (speech summary, M. Alexopoulos) (retrieved 2026-10-25)
- Statistics Canada: Economic and Social Reports, April 2026 (The Daily) (retrieved 2026-10-25)
- Statistics Canada: Canadian employment trends in the era of generative artificial intelligence: Early evidence (retrieved 2026-10-25)
- Innovation, Science and Economic Development Canada: Government of Canada and TELUS advance work to build sovereign AI infrastructure (retrieved 2026-10-25)
- Bank of Canada: Monetary Policy Report, October 2026: Global economy (retrieved 2026-11-07)
- Bank of Canada: Monetary Policy Report, October 2026: Risks (retrieved 2026-11-07)
Each dataset is used under its licence; attribution and series-level detail are in each chart’s “About this data” panel. Limitations: Technology is not a single industry in the national accounts: the ICT sector, information and cultural industries and professional services overlap and are measured separately here. Artificial intelligence, software exports, venture investment, patents, skills and data centres are not measured in these series and are not assessed. Research spending is a World Bank series with different latest years by country.
How is Canada's transportation and logistics sector doing, and what does it carry?
Transportation and warehousing produce C$108.2 billion of real output a year and employ 1.1 million people; in August 2026 the transportation services index was 92.4, up 2.0% on a year earlier, and rail carloadings were up 8.0%
Graphic: Exports in dollars have grown far faster than freight in tonnes
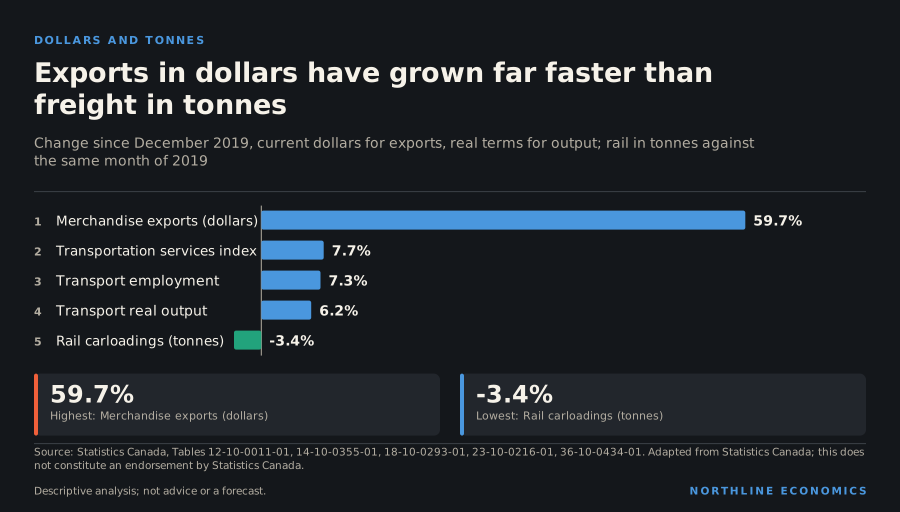
What happened
Transportation and warehousing produced C$108.2 billion of real output at an annual rate in August 2026, 5.5% on a year earlier, and employed 1.1 million people in October 2026 (1.4% over the year). Average hourly wages in the sector were C$35.22 an hour.
The Transportation Services Index, seasonally adjusted, was 92.4 in August 2026, 2.0% on a year earlier. Railway carloadings were 32.8 million tonnes in August 2026, 8.0% on a year earlier.
Employment in transportation and warehousing changed by 7.3% between December 2019 and October 2026, and average hourly wages in the sector were 2.4% higher than a year earlier, against 2.2% for all industries. Railway carloadings, which are not seasonally adjusted, changed by -3.4% from the same month of 2019.
Transportation activity
Transportation Services Index (index) is plotted alone; rail carloadings are in the data table of the next chart.
Chart loads when it comes into view.
Latest values: Transportation Services Index, seasonally adjusted 92.4 (2026-08).
Related relationships: Transportation and warehousing
Railway carloadings
Millions of tonnes per month, all traffic carried.
Chart loads when it comes into view.
Latest values: Total traffic carried 32.79 (2026-08).
Related relationships: Transportation and warehousing
A sector that has grown, carrying less by weight
Transportation and warehousing is a large industry: real output of C$108.2 billion a year and 1.1 million people. Output is at its highest in at least ten years and employment is close to its high. Output is up 6.2% since December 2019 and jobs 7.3%. Its average hourly wage is C$35.22 an hour, up 27.6% since the end of 2019, against 32.3% for all industries (neither wage series is seasonally adjusted).
The Transportation Services Index, which combines the activity of the main modes, is 92.4 (January 2018 = 100), 7.7% above its December 2019 level but still below its starting point; it was 68.0 in the pandemic month of April 2020.
Rail tells the freight story. Total tonnes carried were 32.8 million tonnes in August 2026, 3.4% below the same month of 2019. Its highest month of the past ten years was 34.8 million tonnes in October 2018, but the series is not seasonally adjusted, so months in different seasons are not comparable. A sector whose output and employment have grown has, on this measure, moved less freight by rail than it did before the pandemic.
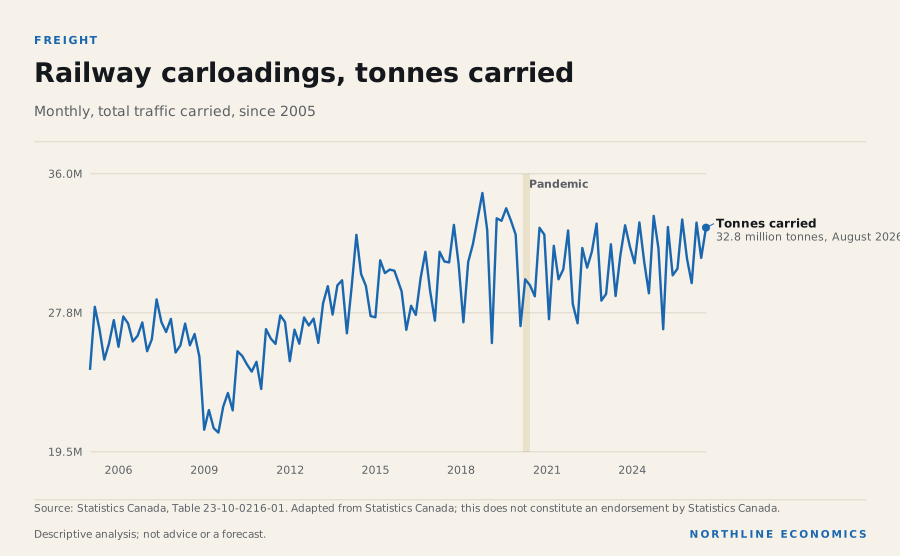
The data behind this graphic
| Series | Latest |
|---|---|
| Tonnes carried | 32.8 million tonnes, August 2026 |
That is not a contradiction. The sector carries passengers, parcels and goods by road and air, and the output index measures value added, not tonnes. But it illustrates why the national figures need care: output is in real dollars, the rail figure is in tonnes, and the two do not have to move together.
What the dollars hide
The same contrast appears in trade. Merchandise exports in current dollars are 59.7% above their December 2019 level, and 21.7% above a year earlier. Some of that is price, and these series do not separate price from volume. In the latest month energy exports (C$205.4 billion over the last twelve months) were 102.2% above December 2019, metal products (C$156.0 billion) 174.2%, and farm, fishing and intermediate food products 63.8%. These are value measures. A tonne of gold or a litre of crude oil is carried with a different amount of freight capacity than a tonne of grain, and the data held here do not give volumes for these categories.
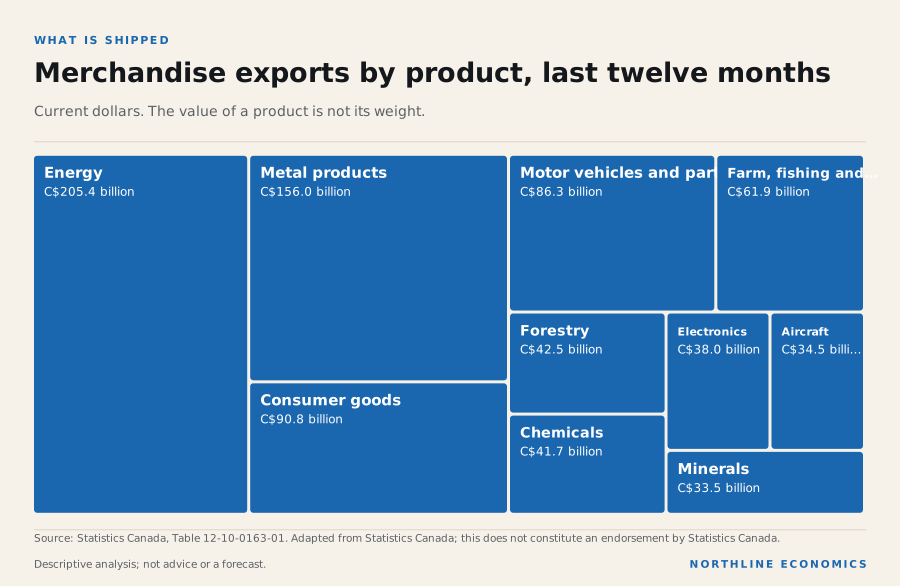
The data behind this graphic
| Item | Value |
|---|---|
| Energy | C$205.4 billion |
| Metal products | C$156.0 billion |
| Consumer goods | C$90.8 billion |
| Motor vehicles and parts | C$86.3 billion |
| Farm, fishing and intermediate food | C$61.9 billion |
| Forestry | C$42.5 billion |
| Chemicals | C$41.7 billion |
| Electronics | C$38.0 billion |
| Aircraft | C$34.5 billion |
| Minerals | C$33.5 billion |
By destination, the picture is of a United States that is still by far the largest market (C$591.3 billion of C$865.7 billion over twelve months) but that has grown more slowly than the total since December 2019. The United Kingdom (192.7%), China (109.8%) and Mexico (54.0%) have all grown faster than the United States (50.9%). The European Union's figure (-11.8%) is not comparable, because Statistics Canada's series included the United Kingdom through December 2020; since December 2021 exports to the European Union are up 33.9%.
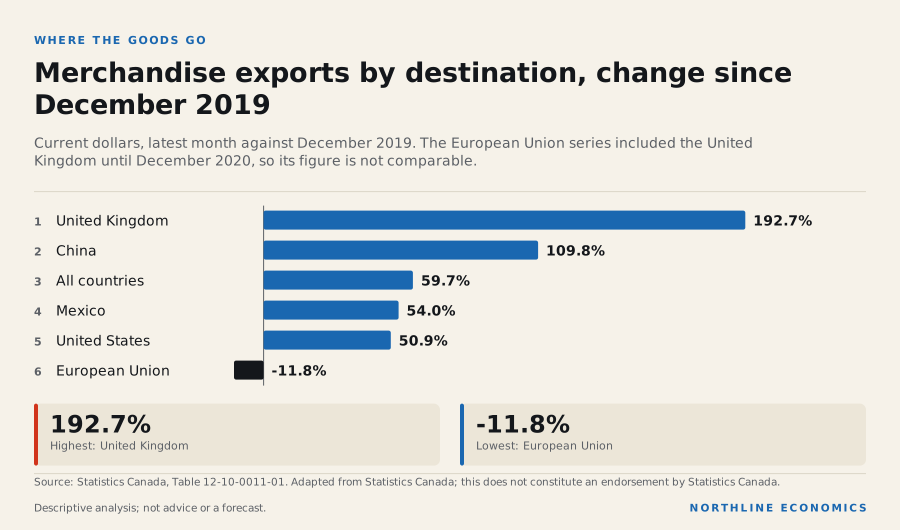
The data behind this graphic
| Item | Value |
|---|---|
| United Kingdom | 192.7% |
| China | 109.8% |
| All countries | 59.7% |
| Mexico | 54.0% |
| United States | 50.9% |
| European Union | -11.8% |
This is why transportation infrastructure for non-US markets is a policy question: Budget 2025, cited later, sets a goal of doubling non-US exports and says it requires building the infrastructure to support it, and Budget 2026 restates the goal. The data show where the new sales are growing; they do not show whether ports, rail and pipelines have the capacity to carry more, and capacity measures are not held here. The research note on trade partners sets out the shares.
Why it happened
Statistics Canada reports that Canadian railways carried 32.8 million tonnes in August 2026, up 8.0% on a year earlier, led by grain: wheat loadings rose 78.6% and canola loadings 90.0% from August 2025. In July it had said that with elevated stocks of principal field crops and strong global demand grain shipments by rail remained strong.
Evidence: Statistics Canada: Railway carloadings, August 2026 (The Daily); Statistics Canada: Railway carloadings, July 2026 (The Daily)
In August, it reported, coal loadings were lower than a year earlier and potash loadings fell for a fourth consecutive month.
Evidence: Statistics Canada: Railway carloadings, August 2026 (The Daily)
Why it matters
Transportation and logistics move goods and people within and across borders, so delays or capacity limits would matter to exporters and importers. These series show activity, not capacity or delays.
Budget 2025 says Canada's trade remains heavily concentrated with a single partner, the United States, and sets a goal of doubling non-US exports over a decade, which it says requires building the infrastructure to support it. Budget 2026 restates the goal of doubling exports to non-US markets over the next decade.
Evidence: Finance Canada: Budget 2025, Chapter 2: Shifting from reliance to resilience; Department of Finance Canada: Budget 2026, Chapter 1: Canada's Investment Supercycle
Statistics Canada reports that exports to countries other than the United States rose 7.4% in July 2026 to a record 25.6 billion dollars, 33.7% of exports, and then fell in August and September.
Evidence: Statistics Canada: Canadian international merchandise trade, July 2026 (The Daily); Statistics Canada: The Daily: Canadian international merchandise trade, September 2026
History
Rail traffic peaked at 34.8 million tonnes in October 2018 in the past ten years.
Non-resident visitors entering Canada numbered 4.2 million in August 2026, 4.6% on a year earlier, of which 3.3 million (77.8%) were residents of the United States. Visitors are a measure of cross-border travel, not of freight.
Non-resident visitors entering Canada
Visitors per month; United States residents are shown separately.
Chart loads when it comes into view.
Latest values: All non-resident visitors 4.222 (2026-08); United States residents 3.287 (2026-08).
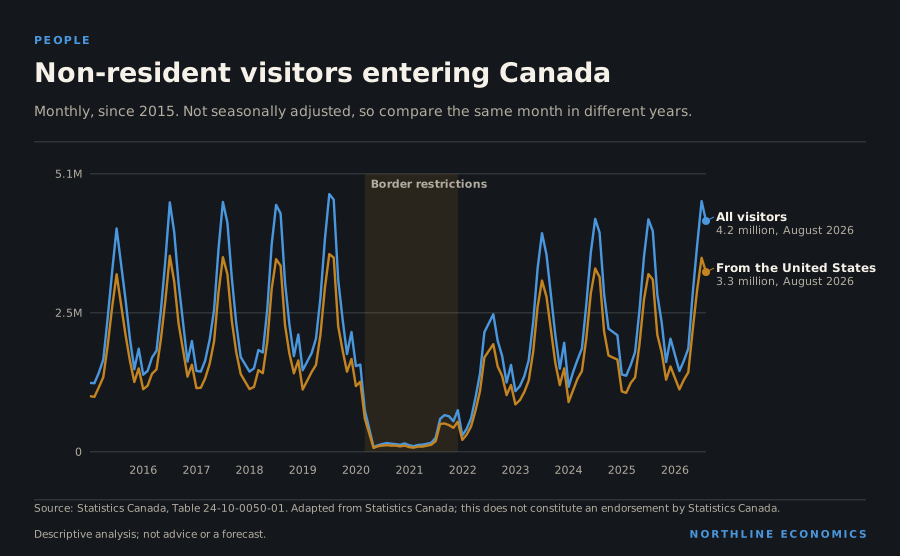
The data behind this graphic
| Series | Latest |
|---|---|
| All visitors | 4.2 million, August 2026 |
| From the United States | 3.3 million, August 2026 |
Non-resident visitors entering Canada number 4.2 million in the latest month, 4.6% on a year earlier, against 4.6 million in the same month of 2019. Visitors from the United States are 3.3 million against 3.6 million. The series is not seasonally adjusted, so only the same month in different years can be compared. The measure counts entries, which include people who cross for the day, and does not count spending or length of stay.
Across geographies
Monthly provincial and metropolitan transportation activity is not held here, and neither are Transport Canada or port data.
What it influences
Transport Canada describes the Trade Diversification Corridors Fund as a program to strengthen supply chain capacity, relieve congestion and address infrastructure gaps that limit Canada's ability to reach global markets beyond the United States, including increasing transportation capacity for bulk commodity exports.
Budget 2025 proposed 5.0 billion dollars over seven years for it, and Budget 2026 says the government has launched the fund. Any link from US trade policy to the transport industry is only an unsupported hypothesis.
Evidence: Finance Canada: Budget 2025, Chapter 2: Shifting from reliance to resilience; Department of Finance Canada: Budget 2026, Chapter 2: A more competitive and connected Canada
Risks
Statistics Canada notes that a rise in freight in April 2026 reflected a higher volume received from US railway connections rather than domestic loadings, so a total can rise without domestic activity doing so. Index values are revised. Cross-border measures and weather could change activity, but no measure of that exposure is held here.
Evidence: Statistics Canada: Railway carloadings, April 2026 (The Daily)
What it means for decisions
For an exporter. The destination data show faster percentage growth outside the United States, and the dollar data show it is concentrated in a few products whose prices have moved a great deal. A shipper’s capacity needs depend on tonnes, not dollars, and the two have diverged.
For a logistics operator. Rail volumes are below their 2018 peak while the sector’s output is at a high and employment is close to one. Growth in the sector has not come from rail freight volume, so it should not be read as a signal for rail capacity.
For an investor in infrastructure. The federal programs cited above target capacity for markets beyond the United States. Whether capacity or demand is the binding constraint is not something the series here can answer.
For a tourism business. Visitors from the United States are the large majority of visits and are still below the same month of 2019; the border-crossing series says nothing about spending.
What the data cannot say. There are no port, airport, trucking or pipeline volumes in the series held here, and no delay or capacity measures. Rail carloadings can rise from US-origin traffic without domestic loadings changing, as the Statistics Canada note above says.
What to watch
The next releases of the transportation services index and of rail carloadings, and of merchandise trade (see the release calendar).
Prepared with AI assistance.
Follow the relationships
- Transportation and warehousing 10 with evidence · 10 recorded Open in Studio
Upcoming releases
- 2026-11-30 Gross domestic product by industry September 2026 · Statistics Canada
Sources for this section (8 datasets, 9 documents)
Data
- Gross domestic product (GDP) at basic prices, by industry, monthly (36-10-0434-01; 1 series; latest August 2026; retrieved 2026-11-05)
- Employment by industry, monthly, seasonally adjusted and unadjusted, and trend-cycle, last 5 months (14-10-0355-01; 1 series; latest October 2026; retrieved 2026-11-07)
- Employee wages by industry, monthly, unadjusted for seasonality (14-10-0063-01; 2 series; latest October 2026; retrieved 2026-11-07)
- Transportation Services Index, Canada level, unadjusted and seasonally adjusted, monthly (18-10-0293-01; 1 series; latest August 2026; retrieved 2026-11-05)
- Railway carloadings statistics, by total tonnage transported, monthly (23-10-0216-01; 1 series; latest August 2026; retrieved 2026-11-05)
- International merchandise trade for all countries and by Principal Trading Partners, monthly (12-10-0011-01; 6 series; latest September 2026; retrieved 2026-11-05)
- International merchandise trade by commodity, monthly (12-10-0163-01; 3 series; latest September 2026; retrieved 2026-11-05)
- Non-resident visitors entering Canada, by country of residence (24-10-0050-01; 2 series; latest August 2026; retrieved 2026-10-23)
Documents cited
- Statistics Canada: Railway carloadings, August 2026 (The Daily) (retrieved 2026-11-07)
- Statistics Canada: Railway carloadings, July 2026 (The Daily) (retrieved 2026-10-25)
- Finance Canada: Budget 2025, Chapter 2: Shifting from reliance to resilience (retrieved 2026-10-25)
- Department of Finance Canada: Budget 2026, Chapter 1: Canada's Investment Supercycle (retrieved 2026-11-07)
- Statistics Canada: Canadian international merchandise trade, July 2026 (The Daily) (retrieved 2026-10-25)
- Statistics Canada: The Daily: Canadian international merchandise trade, September 2026 (retrieved 2026-11-06)
- Transport Canada: Government of Canada launches calls for proposals for the $5 billion Trade Diversification Corridors Fund and the $1 billion Arctic Infrastructure Fund (retrieved 2026-10-25)
- Department of Finance Canada: Budget 2026, Chapter 2: A more competitive and connected Canada (retrieved 2026-11-07)
- Statistics Canada: Railway carloadings, April 2026 (The Daily) (retrieved 2026-10-25)
Each dataset is used under its licence; attribution and series-level detail are in each chart’s “About this data” panel. Limitations: The transportation services index and rail carloadings cover parts of the sector (the index weights several modes; rail is tonnes carried), and neither separates trucking, ports, pipelines or air cargo. Port and airport capacity, freight rates, border delays, infrastructure projects and logistics costs are not held here and not assessed. Rail carloadings and visitors are not seasonally adjusted, so they are compared with the same month of another year. Visitors are people entering Canada, not trade. Federal plans are quoted from Budget 2025 and Budget 2026, tabled on 5 November 2026.
Where is the economy growing fastest, and what is being built to support it?
In October 2026 Alberta employment was up 1.6% on a year earlier and Quebec's down 2.3%, and population growth across the provinces in the year to 1 July 2026 ranged from 0.1% to 1.5%
Graphic: Three speeds: where jobs, people and unemployment stand
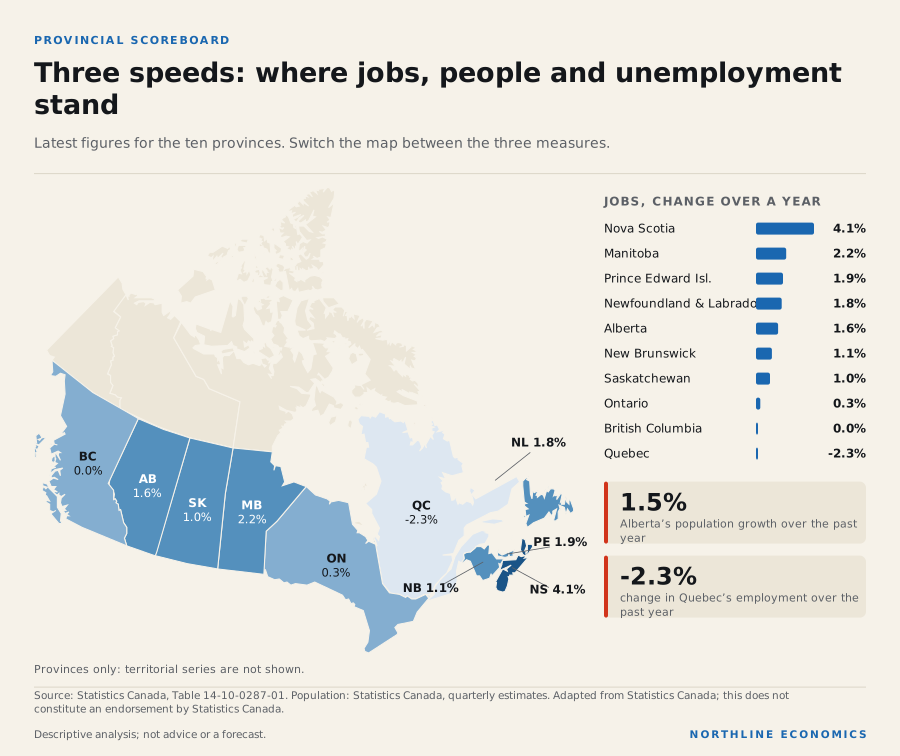
What happened
The latest provincial employment, unemployment and population figures show a country moving at different speeds. Over the year, employment changed by 1.6% in Alberta, 0.3% in Ontario, 0.0% in British Columbia and -2.3% in Quebec; unemployment rates are 7.3% in Alberta, 7.3% in Ontario, 6.3% in British Columbia, 5.7% in Quebec and 8.7% in Newfoundland and Labrador. Population grew 1.5% in Alberta, 1.0% in Saskatchewan, 0.3% in Ontario and 0.1% in British Columbia. A table of every province's latest values is at the end of this report.
Employment by province, indexed
Seasonally adjusted; start of period = 100.
Chart loads when it comes into view.
Latest values: Alberta 2,660,000 (2026-10); British Columbia 2,941,000 (2026-10); Saskatchewan 624,600 (2026-10); Manitoba 752,500 (2026-10); and 6 more in the data table.
Related relationships: Alberta · British Columbia · Saskatchewan · Manitoba · 2 relationships use this data as evidence
Real GDP by province, indexed
Annual, 2017 constant prices (not chained); start of the period = 100. Expenditure-based.
Chart loads when it comes into view.
Latest values: Alberta 382,600,000,000 (2025); British Columbia 356,100,000,000 (2025); Saskatchewan 90,590,000,000 (2025); Manitoba 79,430,000,000 (2025); and 6 more in the data table.
Statistics Canada's October labour release reported that employment decreased in Alberta and Prince Edward Island and increased in British Columbia and Newfoundland and Labrador, held steady in Quebec and was little changed in Ontario.
Evidence: Statistics Canada: Labour Force Survey, October 2026 (The Daily)
The population release reported that Alberta grew fastest among the provinces and that Ontario, Quebec and British Columbia, which receive the largest shares of international migrants, grew slowest.
Evidence: Statistics Canada: The Daily: Canada's population estimates, second quarter 2026
Three speeds
The ten provinces can be grouped by how their jobs and populations have changed. The grouping is descriptive. Provinces do not belong in groups for reasons the data can show, and a province can move between them within a year.
Energy-producing provinces. Alberta’s population grew 1.5% over the past year, the fastest, and its employment 1.6%. Saskatchewan’s population and employment both grew 1.0%, and Newfoundland and Labrador’s employment grew 1.8% with a population that grew 0.4%. The three have in common that energy is a large share of their exports, though their experiences in jobs differ.
The Atlantic provinces. Nova Scotia added jobs faster than any other province (4.1%) and Prince Edward Island also grew strongly (1.9%), with population growth of 0.8% and 0.8%. Since the end of 2019 Prince Edward Island’s population is up 16.5%, as much as Alberta’s (16.5%). Nova Scotia also gained from other provinces, by 3,863 people net over four quarters.
The three largest. Ontario’s population grew 0.3% over the year, Quebec’s 0.2% and British Columbia’s 0.1%, and employment changed by 0.3%, -2.3% and 0.0%. These are the provinces that receive the largest shares of international migrants, which Statistics Canada says leaves them more affected by changes in international migration levels. The population section covers the flows.
Evidence: Statistics Canada: The Daily: Canada's population estimates, second quarter 2026
Employment and the population move together in most provinces but not in Quebec, where unemployment (5.7%) is among the lowest and employment fell. A province can have fewer jobs and lower unemployment if its labour force shrinks, as when older workers retire or leave the labour force; the data in this section do not say which is happening in Quebec, and the labour section reports participation at the national level only.
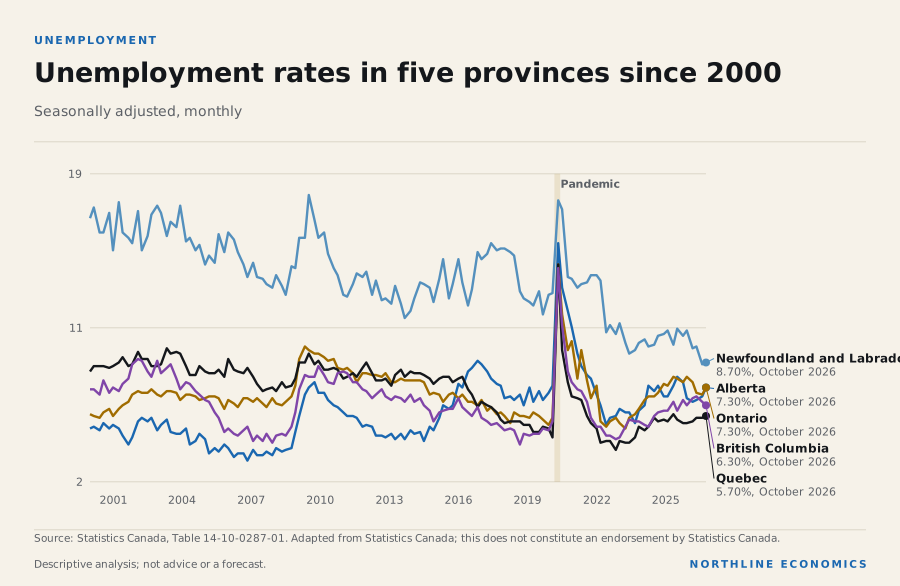
The data behind this graphic
| Series | Latest |
|---|---|
| Alberta | 7.30%, October 2026 |
| Ontario | 7.30%, October 2026 |
| Quebec | 5.70%, October 2026 |
| Newfoundland and Labrador | 8.70%, October 2026 |
| British Columbia | 6.30%, October 2026 |
The unemployment chart sets the provinces against each other over 25 years. Newfoundland and Labrador is the highest of the five now, at 8.7%. Ontario and Alberta, both at 7.3%, are above British Columbia (6.3%) and Quebec (5.7%).
Population, jobs and migration
The population map is the one that has changed most since 2019. Prince Edward Island, Alberta and New Brunswick lead over the whole period; Quebec and Newfoundland and Labrador lag.
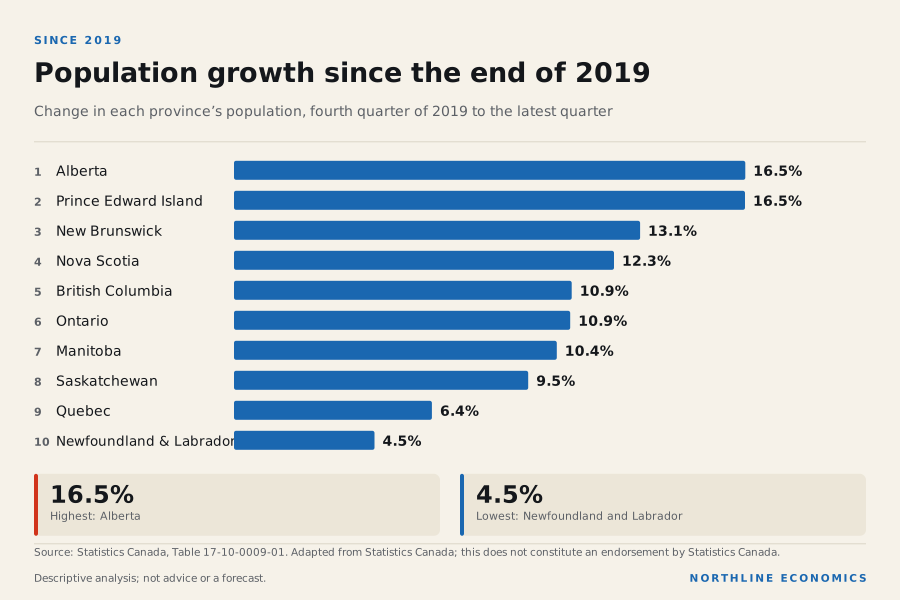
The data behind this graphic
| Item | Value |
|---|---|
| Alberta | 16.5% |
| Prince Edward Island | 16.5% |
| New Brunswick | 13.1% |
| Nova Scotia | 12.3% |
| British Columbia | 10.9% |
| Ontario | 10.9% |
| Manitoba | 10.4% |
| Saskatchewan | 9.5% |
| Quebec | 6.4% |
| Newfoundland and Labrador | 4.5% |
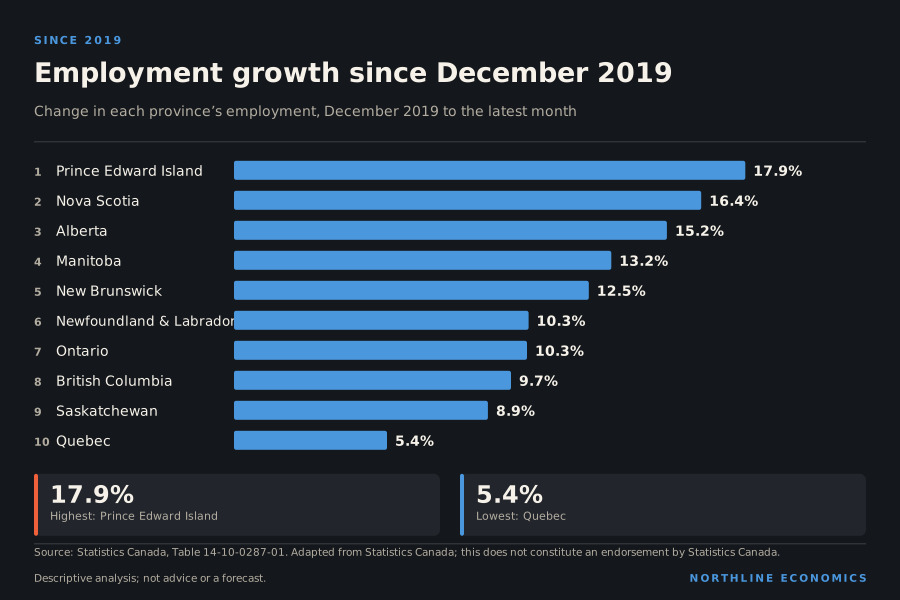
The data behind this graphic
| Item | Value |
|---|---|
| Prince Edward Island | 17.9% |
| Nova Scotia | 16.4% |
| Alberta | 15.2% |
| Manitoba | 13.2% |
| New Brunswick | 12.5% |
| Newfoundland and Labrador | 10.3% |
| Ontario | 10.3% |
| British Columbia | 9.7% |
| Saskatchewan | 8.9% |
| Quebec | 5.4% |
Jobs have followed population but the order differs. Prince Edward Island is first on jobs, with employment up 17.9% since December 2019, and level with Alberta on population. Nova Scotia (16.4%), Alberta (15.2%) and Manitoba (13.2%) follow. Quebec (5.4%) and Saskatchewan (8.9%) are lowest, though both are above their 2019 levels.
People moving between provinces add a further layer. Alberta is the largest gainer by a wide margin, with 22 thousand net arrivals over four quarters, and Ontario the largest loser, with 18 thousand net departures. British Columbia also gained (6,928), so British Columbia’s slow population growth does not come from losing people to other provinces; it comes from the other flows. The population note on flows by province has the city-level detail.
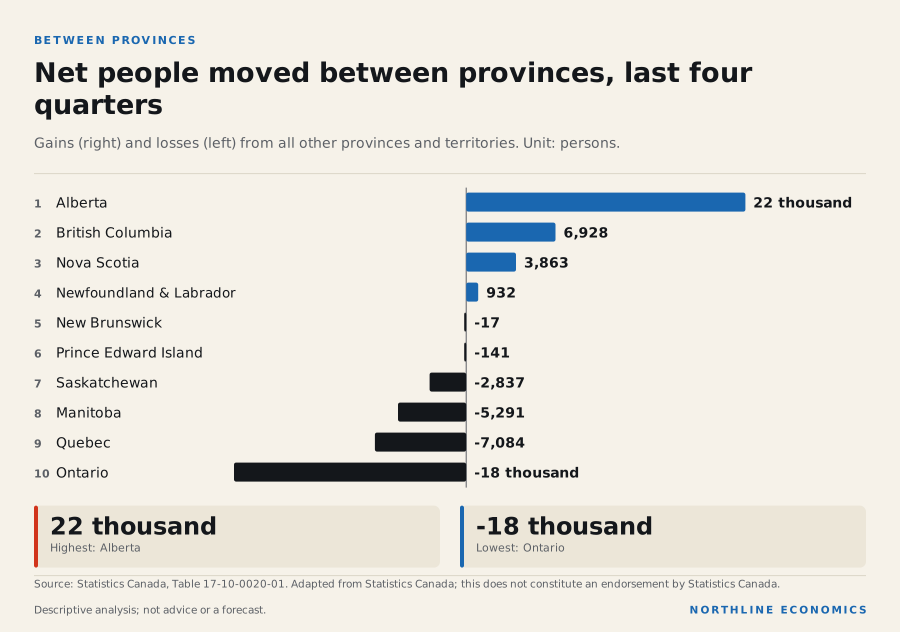
The data behind this graphic
| Item | Value |
|---|---|
| Alberta | 22 thousand |
| British Columbia | 6,928 |
| Nova Scotia | 3,863 |
| Newfoundland and Labrador | 932 |
| New Brunswick | -17 |
| Prince Edward Island | -141 |
| Saskatchewan | -2,837 |
| Manitoba | -5,291 |
| Quebec | -7,084 |
| Ontario | -18 thousand |
A decade of output
Population and jobs are the recent story. Real output over the last ten years tells another one, because a decade is long enough to cover an oil-price cycle.
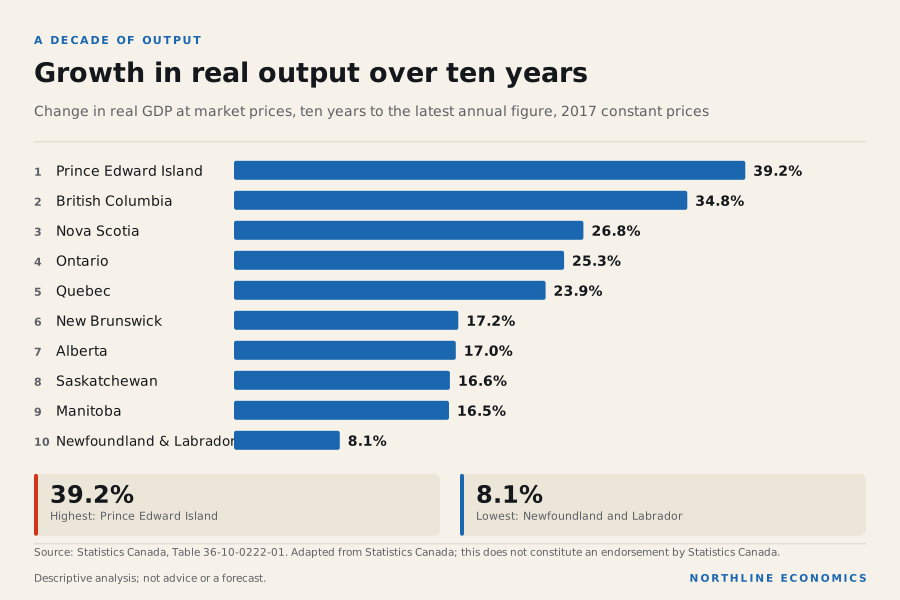
The data behind this graphic
| Item | Value |
|---|---|
| Prince Edward Island | 39.2% |
| British Columbia | 34.8% |
| Nova Scotia | 26.8% |
| Ontario | 25.3% |
| Quebec | 23.9% |
| New Brunswick | 17.2% |
| Alberta | 17.0% |
| Saskatchewan | 16.6% |
| Manitoba | 16.5% |
| Newfoundland and Labrador | 8.1% |
Prince Edward Island (39.2%) and British Columbia (34.8%) grew most. Ontario (25.3%), Nova Scotia (26.8%) and Quebec (23.9%) were in the middle. Newfoundland and Labrador (8.1%) grew least, well behind Manitoba (16.5%), Saskatchewan (16.6%), Alberta (17.0%) and New Brunswick (17.2%), which were close together. Alberta’s ten-year figure starts in 2015, just after the oil-price peak of 2014, and its population growth, the fastest of any province now, is a recent development.
Why it happened
Regional differences in the data line up with differences in industry structure and migration exposure. Provinces whose exports and revenues depend on energy prices (Alberta, Saskatchewan, Newfoundland and Labrador) are exposed to higher oil prices; provinces whose populations depend most on international migration are seeing the slowdown in population growth. Net interprovincial migration added 22 thousand to Alberta's population over the last four quarters and removed 18 thousand from Ontario. These are co-occurrences in the data, not an attribution; the explorer records the exposure relationships with their evidence class.
Evidence: relationship: World oil price (WTI) and Alberta; relationship: World oil price (WTI) and Newfoundland and Labrador; relationship: World oil price (WTI) and Saskatchewan; Statistics Canada: The Daily: Canada's population estimates, second quarter 2026
In the latest month, Alberta's investment in new building construction changed by -1.7% from a year earlier, Ontario's by 3.6%, Quebec's by 2.4% and British Columbia's by 1.5%.
Why it matters
Regional divergence matters for migration, housing demand, public finances and the stance of national policy: a single policy rate or tariff regime affects provinces and cities unevenly. The map and the compare tool let readers put any two geographies side by side on the same definition.
History
Over the ten years to 2025, real output rose 34.8% in British Columbia, 25.3% in Ontario and 17.0% in Alberta. The earlier sections give the national history.
Across geographies
Metropolitan areas are the unit for city reports, and their series are not comparable with provincial series: unemployment rates, for example, are three-month averages. The latest metropolitan unemployment rates are 6.6% in Calgary, 7.1% in Edmonton, 7.1% in Toronto, 6.7% in Vancouver and 6.9% in Montréal. Units under construction changed over the year by -4.2% in Toronto and 4.0% in Edmonton.
Unemployment rate by metropolitan area
Percent, three-month moving average, seasonally adjusted. Census metropolitan areas only; do not compare with provincial monthly rates (different smoothing).
Chart loads when it comes into view.
Latest values: Calgary 6.6 (2026-10); Edmonton 7.1 (2026-10); Toronto 7.1 (2026-10); Vancouver 6.7 (2026-10); and 2 more in the data table.
Related relationships: Calgary · Edmonton · Toronto · Vancouver
Housing under construction by metropolitan area
Units under construction at month end, total units; CMHC data distributed by Statistics Canada.
Chart loads when it comes into view.
Latest values: Calgary 26,250 (2026-09); Edmonton 18,490 (2026-09); Toronto 88,110 (2026-09); Vancouver 61,680 (2026-09); and 2 more in the data table.
Related relationships: Calgary · Edmonton · Toronto · Vancouver
Infrastructure and major projects
Not assessed here: major infrastructure projects (ports, airports, rail, pipelines, transmission, LNG, mines and industrial developments), corridor capacity and public infrastructure programs. The research note on Canada's open project registers covers what those registers hold. The activity measures available are rail carloadings, the Transportation Services Index, investment in non-residential building construction and government investment in fixed capital, shown elsewhere in this report. Real government investment in fixed capital is 23.5% higher than at the end of 2019.
What it influences
Regional performance feeds national averages, migration flows and the geographic spread of the effects of national shocks. The explorer's province and city nodes link to the data used here.
Risks
Finance Canada describes Equalization as the transfer program for addressing fiscal disparities among provinces, supporting those with lower than average fiscal capacity, and says it reduces but does not eliminate those disparities; for natural resources it assesses fiscal capacity from partial inclusion of the revenue a province actually collects.
Evidence: Finance Canada: Equalization Program
Statistics Canada reported in May 2026 that in 2025 Alberta contributed almost as much to national growth as Ontario and that manufacturing output decreased in ten jurisdictions, a significant drag in Quebec among others. Its revised provincial accounts of 5 November 2026 show GDP rising in every province in 2025, fastest in Newfoundland and Labrador and slowest in Quebec.
Evidence: Statistics Canada: The Daily: Gross domestic product by industry: Provinces and territories, 2025; Statistics Canada: The Daily: Provincial and territorial economic accounts, 2025
Federal, provincial and territorial ministers responsible for internal trade agreed in August 2026 to accelerate efforts toward model mutual-recognition legislation to create a common Canadian market and support labour mobility.
Regional dependence on one commodity or one export market concentrates risk. The measured exposures (energy share and US share of each province's exports) are in the trade section. Not assessed: the capacity of regional infrastructure (housing, transit, ports, power) to support continued growth in the fastest-growing provinces.
What it means for decisions
For a business choosing where to expand. The scoreboard shows where demand is being added: Alberta, the Atlantic provinces and Manitoba have the faster growth in people and jobs. It also shows where it is not, which includes the three largest markets. The three largest are still the largest absolute markets and the slowdown in them is recent.
For a policymaker. A single policy rate or tariff does not land evenly. The provinces with the fastest population growth may face more pressure on housing and infrastructure; those with the slowest may see labour supply grow more slowly. The measures that fit one may not fit the other.
For an investor. The ten-year view and the one-year view point to different places. Population growth is now concentrated in a small number of provinces, and a decade of output growth was concentrated in others. A reader who weighs both should look at the sector detail in the industry section and the provincial research notes, not at the aggregate.
For a household deciding where to live. Jobs, unemployment and migration are only part of the picture. Housing costs, which differ widely, are in the housing section. Net migration shows where people are choosing to go, not whether they are better off.
What the data cannot say. The provincial series are not all measured on the same basis; employment is from a household survey, population from administrative estimates and output from the national accounts. Unemployment and employment are noisy at the provincial level, and the migration figures are net, so they hide two-way flows.
What to watch
Monthly provincial labour data, quarterly population estimates, monthly building construction investment by province, and the city reports (Calgary, Edmonton and the others) for local detail.
Prepared with AI assistance.
| Province | Unemployment | Employment rate | Participation | CPI, 12 mo. | Population, 4 qtrs | Weekly earnings | Job vacancy rate |
|---|---|---|---|---|---|---|---|
| Alberta | 7.3% | 63.8% | 68.8% | 3.6% | 1.5% | $1,410 | 3.5% |
| British Columbia | 6.3% | 60.7% | 64.7% | 3.0% | 0.1% | $1,366 | 3.1% |
| Saskatchewan | 5.9% | 63.1% | 67.0% | 3.3% | 1.0% | $1,303 | 3.2% |
| Manitoba | 5.0% | 63.1% | 66.5% | 4.4% | 0.6% | $1,248 | 3.0% |
| Ontario | 7.3% | 59.9% | 64.6% | 2.5% | 0.3% | $1,394 | 2.6% |
| Quebec | 5.7% | 60.0% | 63.6% | 3.1% | 0.2% | $1,297 | 3.0% |
| New Brunswick | 7.4% | 55.8% | 60.3% | 5.0% | 1.0% | $1,266 | 2.4% |
| Nova Scotia | 6.2% | 58.5% | 62.4% | 5.6% | 0.8% | $1,223 | 3.3% |
| Prince Edward Island | 7.4% | 60.8% | 65.7% | 5.7% | 0.8% | $1,162 | 4.1% |
| Newfoundland and Labrador | 8.7% | 52.4% | 57.4% | 4.7% | 0.4% | $1,314 | 2.3% |
The relationship explorer shows measured exposures and sourced mechanisms that bear on why outcomes differ; the table itself explains nothing. Job vacancy rates for Prince Edward Island and Nunavut are suppressed or unavailable in the latest release and are not shown.
Compare provinces and cities on the same indicator → · Province data profiles · City reports
Follow the relationships
- Alberta 14 with evidence · 17 recorded Open in Studio
- Ontario 9 with evidence · 12 recorded Open in Studio
- Quebec 9 with evidence · 11 recorded Open in Studio
- British Columbia 10 with evidence · 12 recorded Open in Studio
- Employment 0 with evidence · 0 recorded Open in Studio
- Population growth 0 with evidence · 0 recorded Open in Studio
Upcoming releases
- 2026-11-19 Investment in building construction September 2026 · Statistics Canada
- 2026-12-04 Labour Force Survey November 2026 · Statistics Canada
Sources for this section (8 datasets, 6 documents)
Data
- Labour force characteristics, monthly, seasonally adjusted and trend-cycle (14-10-0287-01; 14 series; latest October 2026; retrieved 2026-11-07)
- Population estimates, quarterly (17-10-0009-01; 8 series; latest 1 July 2026; retrieved 2026-10-23)
- Estimates of the components of interprovincial migration, quarterly (17-10-0020-01; 4 series; latest Q2 2026; retrieved 2026-10-23)
- Gross domestic product, expenditure-based, provincial and territorial, annual (36-10-0222-01; 10 series; latest 2025; retrieved 2026-11-07)
- Investment in Building Construction (34-10-0293-01; 4 series; latest August 2026; retrieved 2026-10-23)
- Labour force characteristics by census metropolitan area, three-month moving average, seasonally adjusted (14-10-0459-01; 5 series; latest October 2026; retrieved 2026-11-07)
- Canada Mortgage and Housing Corporation, housing starts, under construction and completions in selected census metropolitan areas, monthly (34-10-0154-01; 2 series; latest September 2026; retrieved 2026-10-23)
- Gross domestic product, expenditure-based, Canada, quarterly (36-10-0104-01; 1 series; latest Q2 2026; retrieved 2026-10-23)
Documents cited
- Statistics Canada: Labour Force Survey, October 2026 (The Daily) (retrieved 2026-11-07)
- Statistics Canada: The Daily: Canada's population estimates, second quarter 2026 (retrieved 2026-11-07)
- Finance Canada: Equalization Program (retrieved 2026-10-25)
- Statistics Canada: The Daily: Gross domestic product by industry: Provinces and territories, 2025 (retrieved 2026-10-25)
- Statistics Canada: The Daily: Provincial and territorial economic accounts, 2025 (retrieved 2026-11-07)
- Committee on Internal Trade (Canadian Free Trade Agreement secretariat): Communique, August 27, 2026, Committee on Internal Trade meeting (retrieved 2026-11-07)
Each dataset is used under its licence; attribution and series-level detail are in each chart’s “About this data” panel. Limitations: Provincial and metropolitan definitions differ and are never combined. This section names no major project. Port, airport, rail and pipeline capacity and public-infrastructure programs are not held here. Rankings are for the latest period only and are sensitive to survey sampling error.
How has the Canadian economy changed over the past thirty-five years, and how does that compare with its peers?
Canada's GDP per person at purchasing-power parity is 43.3% higher than in 1990 and the United States' is 73.3% higher, so Canada's level has moved from 91% to 75% of the US level
Graphic: GDP per person, 1990 and now
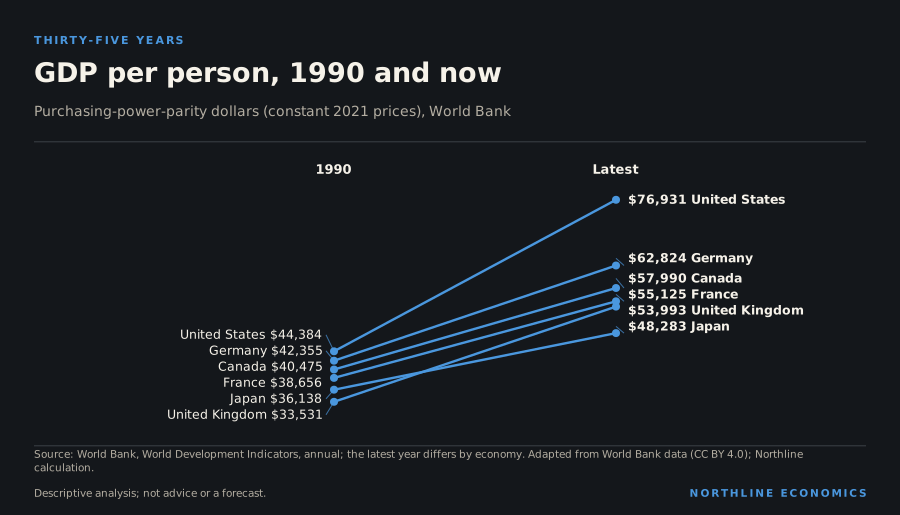
What happened
GDP per person at purchasing-power parity rose in Canada from $40,475 in 1990 to $57,990 in 2025, a rise of 43.3%. Over the same period it rose from $44,384 to $76,931 in the United States (73.3%), from $33,531 to $53,993 in the United Kingdom (61.0%) and from $42,355 to $62,824 in Germany (48.3%). Canada's level was 91% of the US level in 1990 and is 75% of it now.
Living standards: GDP per capita at purchasing-power parity
Constant 2021 international dollars per person.
Chart loads when it comes into view.
Latest values: Canada 57,990 (2025); United States 76,930 (2025); China 25,070 (2025); Japan 48,280 (2025); and 9 more in the data table.
Related relationships: United States · China · United Kingdom · Japan
Output per worker, a rougher productivity measure, rose 36.7% in Canada between 1991 and 2025 and 70.2% in the United States; Canada's output per worker is 72% of the US level now.
Output per worker
GDP per person employed, constant 2021 PPP US dollars.
Chart loads when it comes into view.
Latest values: Canada 113,600 (2025); United States 157,000 (2025); China 48,130 (2025); Japan 87,890 (2025); and 9 more in the data table.
Related relationships: United States · China · United Kingdom · Japan
Thirty-five years in six comparisons
A single year can distort a long comparison, so this section sets Canada beside its peers on six measures, each from the World Bank’s annual data. The comparisons are descriptive; none identifies a cause.
GDP per person. In 1990 GDP per person at purchasing-power parity was $40,475 in Canada, $44,384 in the United States, $42,355 in Germany, $38,656 in France, $36,138 in Japan and $33,531 in the United Kingdom. Canada was third of the six, behind the United States and Germany. Today it is $57,990, still ahead of the United Kingdom ($53,993), France ($55,125) and Japan ($48,283), and behind Germany ($62,824) and the United States ($76,931).
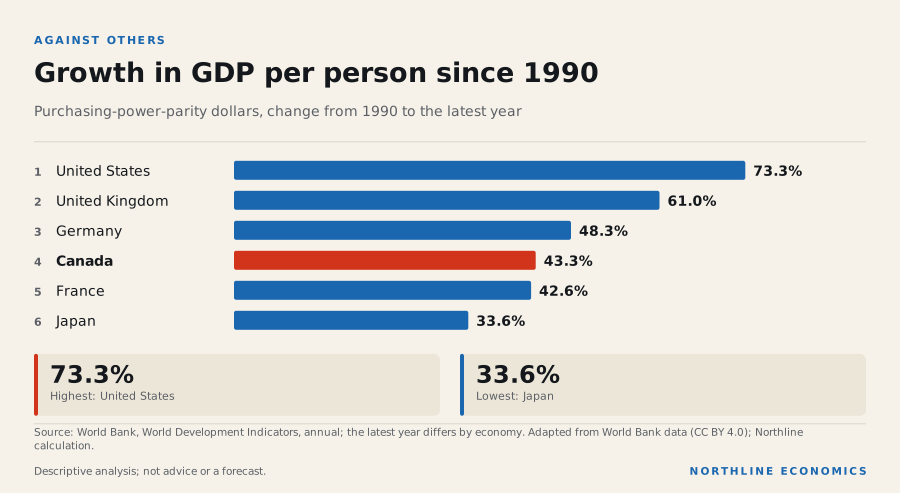
The data behind this graphic
| Item | Value |
|---|---|
| United States | 73.3% |
| United Kingdom | 61.0% |
| Germany | 48.3% |
| Canada | 43.3% |
| France | 42.6% |
| Japan | 33.6% |
The ranking has therefore not changed much, but the distances have. Canada’s growth since 1990 (43.3%) was similar to that of France (42.6%) and a little below Germany’s (48.3%), well below that of the United Kingdom (61.0%) and far below that of the United States (73.3%). The difference with the United States is where the story is.
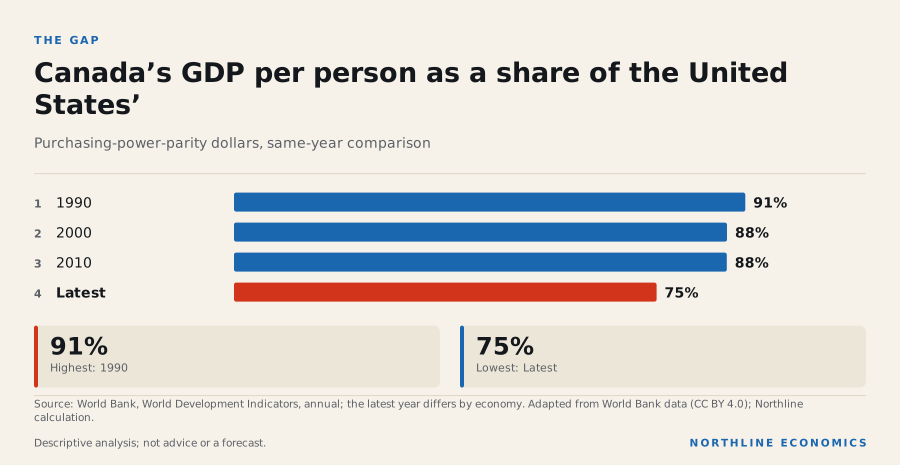
The data behind this graphic
| Item | Value |
|---|---|
| 1990 | 91% |
| 2000 | 88% |
| 2010 | 88% |
| Latest | 75% |
Canada’s GDP per person was 91% of the United States’ in 1990, 88% in 2000 and 88% in 2010. The big step down came after 2010: it is 75% now. For output per worker, a rougher measure of productivity, the figures are 90% in 1991, 90% in 2000 and 72% now. On both measures Canada stayed fairly close to the United States for the first decade or two and has fallen away since.
Openness. Canada has always traded more, relative to its size, than the United States. Exports plus imports were 50.0% of GDP in 1990, rose to 82.8% in 2000 and are 63.5% now. The United States’ share rose from 19.8% to 25.0% in 2024. Germany’s is now 78.5% and has passed Canada’s. Of the three dates shown, Canada’s trade intensity was highest in 2000 and is lower now.
The data behind this graphic
| Item | 2000 | Latest |
|---|---|---|
| Canada | 82.8% | 63.5% |
| United States | 25.1% | 25.0% |
| United Kingdom | 52.3% | 62.5% |
| Germany | 59.2% | 78.5% |
| Japan | 19.3% | 44.9% |
Public debt. Canada’s central government debt was 61.8% of GDP in 1990, 58.7% in 2000, 53.1% in 2010 and 64.1% in 2024. The United States’ went from 40.9% to 115.8% and the United Kingdom’s from 30.2% to 130.7%. Canada is the only one of the three whose central government debt is not far above its 1990 level. Provincial and municipal debt is not included, and in Canada it is large; the government section covers it.
The data behind this graphic
| Item | 1990 | Latest |
|---|---|---|
| Canada | 61.8% | 64.1% |
| United States | 40.9% | 115.8% |
| United Kingdom | 30.2% | 130.7% |
Factories. Manufacturing was 16.2% of Canada’s GDP in 1997 and was 9.3% in 2022, the latest year held. Germany’s share has stayed high (19.9% then, 17.6% now), Japan’s too (23.3% then, 18.8%), while the United States’ (16.1% then, 10.5%) and the United Kingdom’s (15.0% then, 7.7%) fell with Canada’s (latest years differ by economy). The industry section shows the Canadian decline in jobs and in real output.
The data behind this graphic
| Item | 1997 | Latest |
|---|---|---|
| Canada | 16.2% | 9.3% |
| United States | 16.1% | 10.5% |
| United Kingdom | 15.0% | 7.7% |
| Germany | 19.9% | 17.6% |
| Japan | 23.3% | 18.8% |
Ageing. People aged 65 and over were 11.2% of Canada’s population in 1990, 14.1% in 2010 and are 20.3% now. The rise since 2010 is more than twice as large as the rise in the twenty years before it. Japan is far ahead at 30.0%; the United States, at 18.4%, is slightly younger than Canada. Population growth was 1.5% a year in 1990, rose to 3.0% in 2024 and was 0.9% in 2025, and Canada’s growth rate is still above that of the United States (0.5%), the United Kingdom (0.3%) and Japan (-0.5%).
The data behind this graphic
| Item | 1990 | Latest |
|---|---|---|
| Canada | 11.2% | 20.3% |
| United States | 12.3% | 18.4% |
| United Kingdom | 15.9% | 19.7% |
| Germany | 14.9% | 23.7% |
| Japan | 12.2% | 30.0% |
Why it happened
These series show that living standards and output per worker grew more slowly in Canada than in the United States over the period; they do not show why on their own.
A Bank of Canada speech says that if Canada's productivity growth since 2000 had been similar to that of the other G7 countries its GDP today would be about 9% higher, almost $7,000 per person, and that Canada's affordability problem is really a productivity problem.
Evidence: Bank of Canada: Toward a virtuous circle for productivity (speech, N. Vincent)
Statistics Canada's study of the business-sector gap with the United States between 2002 and 2019 says the gap is partly explained by Canada's higher share of small firms and their greater productivity disadvantage relative to large firms.
Evidence: Statistics Canada: The role of firm size in the Canada–U.S. labour productivity gap since 2000
Why it matters
GDP per person and output per worker are broad annual measures of the material standard of living and of productive capacity. A persistent gap with the largest trading partner shapes wages, public revenue and the pull of other places for workers and firms, but these series cannot say how much of any of that follows from the gap.
History
Trade matters more to Canada than to the United States: exports plus imports were 50.0% of GDP in Canada in 1990 and 63.5% in 2025, against 19.8% and 25.0% (2024) in the United States.
Trade openness: exports plus imports
Percent of GDP.
Chart loads when it comes into view.
Latest values: Canada 63.51 (2025); United States 25.02 (2024); China 37.96 (2025); Japan 44.85 (2024); and 10 more in the data table.
Related relationships: United States · China · United Kingdom · Japan
Government debt tells a different story from living standards. Central government debt was 61.8% of GDP in Canada in 1990 and 64.1% in 2024; in the United States it rose from 40.9% to 115.8%. These are central-government figures only and exclude provincial and local debt, which in Canada is large.
The labour market: the unemployment rate was 10.3% in 1991 and 6.9% in 2025 in Canada, and 6.8% and 4.2% in the United States (modelled estimates on a common definition, not the national headline rates).
Across geographies
Manufacturing was 16.2% of Canada's GDP in 1997 and 9.3% in 2022, against 16.1% and 10.5% in the United States, 19.9% and 17.6% in Germany and 23.3% and 18.8% in Japan (latest years differ by economy).
Manufacturing value added
Percent of GDP.
Chart loads when it comes into view.
Latest values: Canada 9.324 (2022); United States 10.53 (2021); China 24.73 (2025); Japan 18.82 (2024); and 9 more in the data table.
Related relationships: United States · China · United Kingdom · Japan
The population is ageing: people aged 65 and over were 11.2% of Canada's population in 1990 and are 20.3% now, against 12.3% and 18.4% in the United States and 12.2% and 30.0% in Japan. Population growth was 1.5% a year in 1990 and 0.9% in 2025.
What it influences
The federal government said Budget 2025 would tackle structural issues holding back the economy: internal trade barriers, burdensome regulation and weak competition intensity. Budget 2026 says it continues the same approach, and names regulatory burden, uncertain approvals and internal trade barriers as constraints that can reduce competition and investment.
Evidence: Finance Canada: Budget 2025, Chapter 1: Productivity and Competitiveness; Department of Finance Canada: Budget 2026, Economic and fiscal overview
The Competition Bureau's study says additional gains could be realized by reducing barriers to trade within Canada, making it easier for workers to move between provinces and attracting greater investment from abroad, and describes its estimated boost to GDP as conservative. No source-backed link from these long-run differences to another variable is recorded here.
Risks
Long-run comparisons depend on the price base and on revisions to old data; a single year at either end can distort a thirty-five-year comparison. Nothing here is a forecast, and a historical gap is not a prediction that it will persist.
What it means for decisions
For a household. GDP per person is a broad measure of material living standards, not of income. Canada is ahead of most of the peers shown on it. The productivity section, the investment section and the Bank of Canada’s speech cited above treat output per hour as a central issue.
For a business. The decline in manufacturing’s share and the lower trade intensity since 2000 describe the economy firms operate in: more domestic services, less goods trade. The firms that export operate in a smaller share of the economy than in the early 2000s, though they remain a large one.
For a public-sector planner. Ageing is the change with the clearest consequences for budgets, because it is known years in advance. The share of people aged 65 and over has risen from 11.2% in 1990 and 14.1% in 2010 to 20.3% in 2025. The timing of its effect on health and pensions spending is not estimated here.
For an investor. The comparison between the government debt of Canada, the United States and the United Kingdom shows how different the paths have been. Canada’s central government debt is not far above its 1990 level, which is a strength; the debt of its provinces is not in the series.
What the data cannot say. The comparisons are of levels and changes on common definitions. They do not show causes, and the productivity gap with the United States depends on the price base used for purchasing-power parity. Nothing here is a forecast.
What to watch
The World Bank's annual updates, and Statistics Canada's productivity and national accounts releases covered in the other sections (see the release calendar).
Prepared with AI assistance.
Follow the relationships
- Labour productivity 0 with evidence · 0 recorded Open in Studio
- United States 12 with evidence · 12 recorded Open in Studio
Sources for this section (8 datasets, 5 documents)
Data
- GDP per capita, PPP (constant 2021 international $) (all economies; World Bank) (WDI NY.GDP.PCAP.PP.KD; series; latest annual; retrieved 2026-10-23)
- GDP per person employed (constant 2021 PPP $) (all economies; World Bank) (WDI SL.GDP.PCAP.EM.KD; series; latest annual; retrieved 2026-10-23)
- Trade (% of GDP) (all economies; World Bank) (WDI NE.TRD.GNFS.ZS; series; latest annual; retrieved 2026-10-23)
- Central government debt, total (% of GDP) (all economies; World Bank) (WDI GC.DOD.TOTL.GD.ZS; series; latest annual; retrieved 2026-10-23)
- Manufacturing, value added (% of GDP) (all economies; World Bank) (WDI NV.IND.MANF.ZS; series; latest annual; retrieved 2026-10-23)
- Population ages 65 and above (% of total population) (all economies; World Bank) (WDI SP.POP.65UP.TO.ZS; series; latest annual; retrieved 2026-10-23)
- Population growth (annual %) (all economies; World Bank) (WDI SP.POP.GROW; series; latest annual; retrieved 2026-10-23)
- Unemployment, total (% of total labor force) (modeled ILO estimate) (all economies; World Bank) (WDI SL.UEM.TOTL.ZS; series; latest annual; retrieved 2026-10-23)
Documents cited
- Bank of Canada: Toward a virtuous circle for productivity (speech, N. Vincent) (retrieved 2026-10-25)
- Statistics Canada: The role of firm size in the Canada–U.S. labour productivity gap since 2000 (retrieved 2026-10-25)
- Finance Canada: Budget 2025, Chapter 1: Productivity and Competitiveness (retrieved 2026-10-25)
- Department of Finance Canada: Budget 2026, Economic and fiscal overview (retrieved 2026-11-07)
- Competition Bureau Canada: Study finds Canada could unlock major economic gains through stronger competition (retrieved 2026-10-25)
Each dataset is used under its licence; attribution and series-level detail are in each chart’s “About this data” panel. Limitations: Annual World Bank series with different latest years by economy (each value shows its year). Purchasing-power comparisons use a 2021 price base, which changes when the base is revised. Levels in 1990 may be on different statistical bases from today's and some series start later (manufacturing, 1997). Differences between economies reflect many things these series do not separate. Only the sources cited here address the long-run differences, and they do not explain them fully. The federal government's statements are quoted from Budget 2025 and Budget 2026, tabled on 5 November 2026.
What could change the picture over the next year, what would show it first, and where might there be room to grow?
Inflation at 3.1% in September 2026 reflects energy, growth is uneven and the main risks are trade policy and energy prices; Northline publishes no forecast
Graphic: Canada’s economy at the latest reading
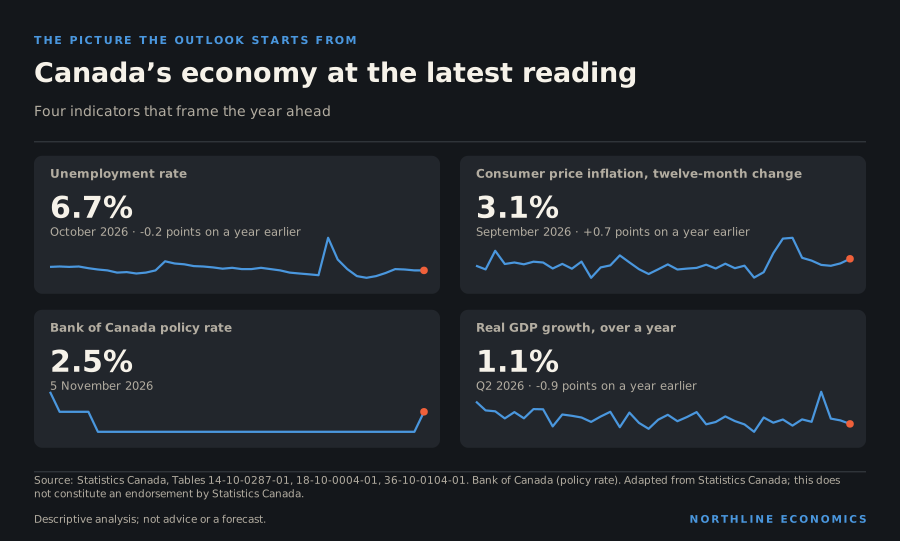
What happened
The economy rebounded in the second quarter (0.8% from the first quarter) after four uneven quarters, the unemployment rate is 6.7% with falling participation, inflation is 3.1% largely because of energy prices while core measures sit near 1.8%, and the Bank of Canada raised its policy rate to 2.50% on 28 October, the first increase since July 2023. Exports to the United States are 70.2% of the total, population growth is 0.5% a year and housing starts are near their decade average. The earlier sections give the evidence for each statement.
Five questions the next year will answer
An outlook is more useful as a list of questions with measuring sticks than as a number. The five below are the ones on which the evidence in this report turns. For each, the figure that frames it and the indicator that would show the answer first are given. They are not forecasts, and each has more than one possible answer.
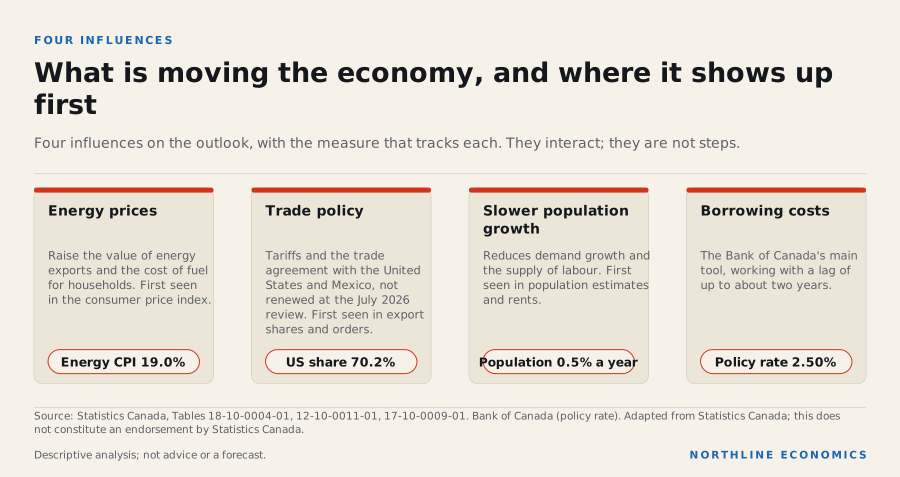
The data behind this graphic
| Step | What happens |
|---|---|
| Energy prices | Raise the value of energy exports and the cost of fuel for households. First seen in the consumer price index. |
| Trade policy | Tariffs and the trade agreement with the United States and Mexico, not renewed at the July 2026 review. First seen in export shares and orders. |
| Slower population growth | Reduces demand growth and the supply of labour. First seen in population estimates and rents. |
| Borrowing costs | The Bank of Canada's main tool, working with a lag of up to about two years. |
1. Does inflation fall back to the target once energy prices stop rising? The consumer price index is 3.1% on a year earlier, against a ten-year average of 2.7% and a peak of 8.1% in June 2022. The headline reflects energy, which is up 19.0%, while the core measures CPI-trim (1.8%) and CPI-median (1.9%) are lower. On 28 October the Bank of Canada raised its rate to reduce the risk that continuing high energy prices spread broadly to other prices. The first indicator is whether the core measures move up. If they stay near their present level, the headline is mainly an energy story.
Evidence: Bank of Canada: Bank of Canada raises the policy rate by 25 basis points to 2½% (28 October 2026)
2. Does the labour market absorb its slack? The unemployment rate is 6.7%, down 0.2 percentage points over the year. That is close to its ten-year average (6.6%), well below the pandemic peak (14.2% in May 2020) and above its ten-year low (4.8% in July 2022). Participation is falling, and employment fell 115 thousand over three months, so the lower rate over the year is consistent with fewer people looking for work. The first indicator is the employment rate, not the unemployment rate.
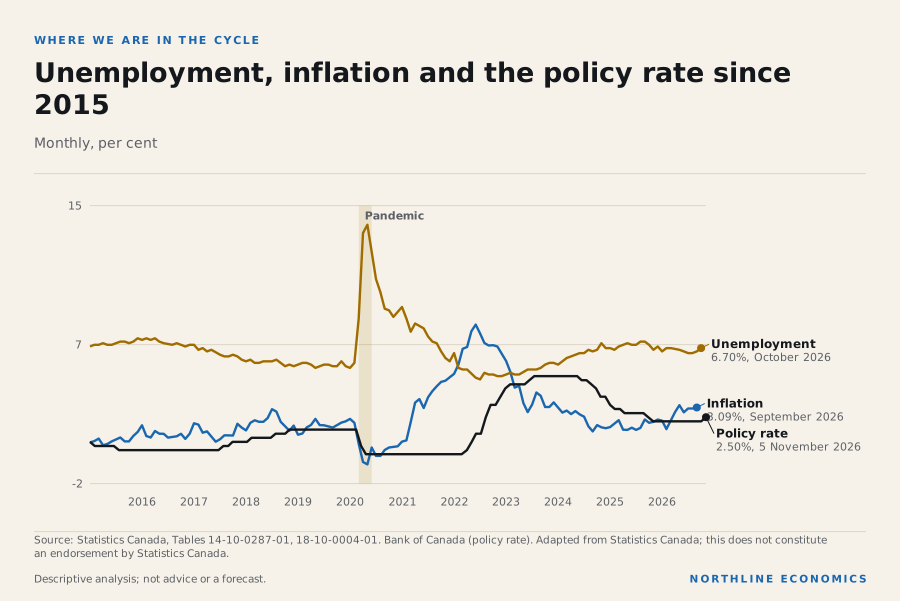
The data behind this graphic
| Series | Latest |
|---|---|
| Inflation | 3.09%, September 2026 |
| Unemployment | 6.70%, October 2026 |
| Policy rate | 2.50%, 5 November 2026 |
3. How much does trade policy change who Canada sells to? The United States buys 70.2% of merchandise exports. That is below the twenty-year high of 79.6% reached in February 2025, but well above the low of 64.7% in April 2020, early in the pandemic. At the joint review on 1 July 2026 the United States did not agree to renew the Canada-United States-Mexico Agreement, which remains in force until 2036 and can be renewed at any time. The trade sections give the shares by province and partner. The first indicator is whether exports to non-US markets grow from their small base.
Evidence: Office of the United States Trade Representative: Ambassador Greer Issues Statement on the USMCA Joint Review; Global Affairs Canada: Statement by Minister LeBlanc following trilateral CUSMA joint review meeting
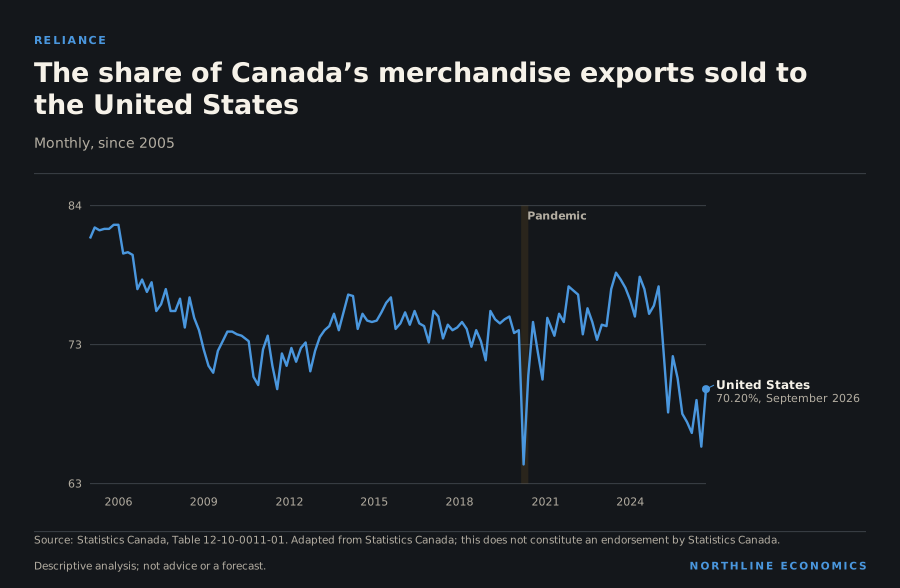
The data behind this graphic
| Series | Latest |
|---|---|
| United States | 70.20%, September 2026 |
4. How do household balance sheets cope with the cost of borrowing? The five-year posted mortgage rate is 6.19%, down from 7.04% on 4 October 2023 but still high by the standards of the past decade. The mortgage debt service ratio is 7.7% of household income, 8.2% at its peak in Q1 2023. Household debt is 176.4% of disposable income, 1.0 percentage points lower than a year earlier. The first indicator is the debt service ratio as fixed-rate mortgages written at lower rates come up for renewal.
5. Does population growth restart, and does output per person rise? Population grew 0.5% over the past year, down sharply from the surge described in the population section, and real GDP per person is 1.5% above its end-2019 level. The first indicators are arrivals under the federal immigration levels plan for 2027 to 2029, released on 5 November 2026, which shapes the population path, and the productivity series, which shows what each hour worked produces.
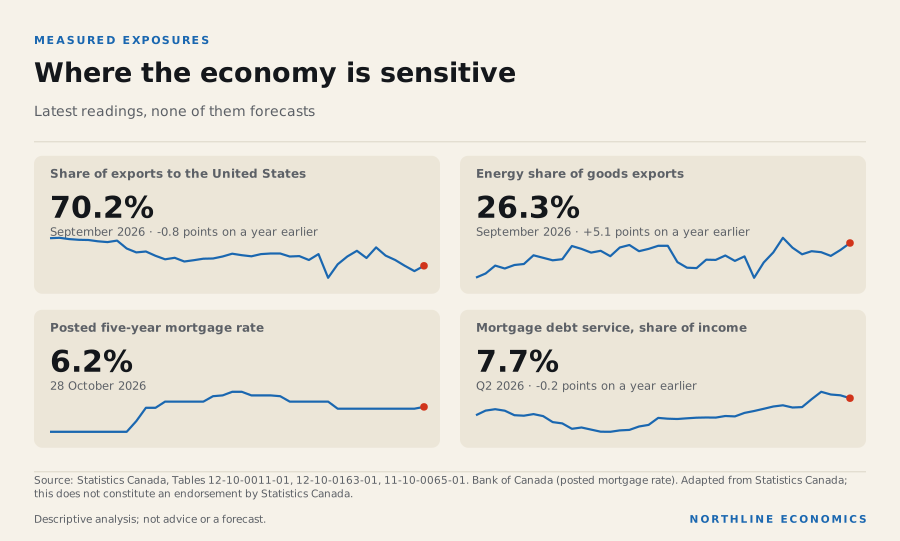
The data behind this graphic
| Indicator | Place | Latest | Period | Change |
|---|---|---|---|---|
| Share of exports to the United States | Canada | 70.2% | September 2026 | -0.8 points on a year earlier |
| Energy share of goods exports | Canada | 26.3% | September 2026 | +5.1 points on a year earlier |
| Posted five-year mortgage rate | Canada | 6.2% | 28 October 2026 | |
| Mortgage debt service, share of income | Canada | 7.7% | Q2 2026 | -0.2 points on a year earlier |
How the forces interact
Each question can be answered separately; they cannot be answered independently. Higher energy prices raise the value of energy exports, and so the income of producing provinces, while pushing inflation up, which can keep interest rates higher, as the 28 October increase shows, and debt service high for households. Tariff uncertainty weakens business investment, which weakens productivity, which makes wage growth harder to sustain without raising unit labour costs. Slower population growth lowers total demand, which cools rents and house prices, which eases inflation but also reduces construction. These are plausible chains of cause and effect, not estimates. The report records the direction of each link where there is a sourced relationship, and says so where a link is only a hypothesis.
Why it happened
The picture is consistent with three forces visible in the data: an energy-price shock raising headline inflation and the value of energy exports, trade-policy uncertainty and tariffs, which can shape the timing of exports and imports, and a sharp slowdown in population growth, which could reshape labour supply and housing demand. The sections on prices, trade and population set out the evidence and its limits.
Why it matters
These forces pull in different directions: higher energy prices raise Canadian income from exports while raising costs for households, tariffs raise costs for some businesses, and slower population growth reduces total demand growth while raising output per person only if productivity improves. The policy rate is the Bank of Canada's main tool, and its transmission takes up to about two years.
History
Not assessed: the track record of past forecasts. Comparing official projections made in earlier years with what happened requires the vintages of those projections, which are not held in this report. The history of the underlying indicators is in the earlier sections.
Across geographies
Not assessed: regional outlooks. No provincial or city forecasts are held here. What is measured regionally is exposure: each province's share of exports sold to the United States and the share that is energy are in the trade section, and each province's employment mix is in the industry section.
What it influences
The outlook for energy prices, trade policy and population feeds into the policy rate, mortgage costs, business investment, government revenues and regional growth. Those links rest on different evidence: the Bank of Canada's mechanisms (rates to mortgages, spending and inflation), sourced links from oil prices to energy investment, national income, consumer energy prices and exports, and hypotheses for tariffs and population.
The global risks documented in the sources cited (the Middle East conflict and energy prices, the Canada–US trade dispute and tighter financial conditions) are collected in the Global report's risks section, with the indicators that would show each.
What forecasters say
In its 28 October announcement the Bank of Canada expected the Canadian economy to grow 1% in 2026 and 2% in 2027 and 2028, with growth slowing in the fourth quarter because of new US tariffs before picking up in 2027, and CPI inflation, which has been around 3% since April, rising to about 3½% by the end of the year. It said that, in the outlook, inflation is higher and more persistent than in the July Report. These are the Bank's projections, not Northline's.
Evidence: Bank of Canada: Bank of Canada raises the policy rate by 25 basis points to 2½% (28 October 2026)
In its October 2026 Monetary Policy Report, published the same day, the Bank projects US GDP to grow by 2½% in 2027 and 2028, and global GDP growth to pick up in the second half of 2026 and stabilize at around 3% through 2028. These are the Bank's projections, not Northline's.
Evidence: Bank of Canada: Monetary Policy Report, October 2026: Global economy
In September the Bank said that the economy and inflation were evolving broadly as forecast in July, that upside risks to its inflation forecast had increased and that it was prepared to adjust monetary policy as needed.
Evidence: Bank of Canada: Bank of Canada maintains the policy rate (2 September 2026)
Risks
Named by the Bank of Canada:
In its October report, the evolution of energy prices and Canada's trade relationship with the United States, which it says remain the two most important risks to the outlook for inflation; further supply disruptions that could push fuel prices higher than projected; and global financial conditions that could tighten more than expected.
Evidence: Bank of Canada: Monetary Policy Report, October 2026: Risks
On 28 October, new US tariffs, which are expected to slow growth in the fourth quarter of 2026, and the risk that continuing high energy prices spread broadly to the prices of other goods and services.
Evidence: Bank of Canada: Bank of Canada raises the policy rate by 25 basis points to 2½% (28 October 2026)
Visible in the data: Canada's exports are 70.2% to the United States; energy is 26.3% of exports; the five-year posted mortgage rate is 6.19%; the federal interest bill took 10.5% of federal revenue in the latest quarter; and employment fell 115 thousand over three months. Each is a measured exposure, not a forecast.
Opportunities
Not forecasts; observations from the data of where capacity or momentum exists.
- Energy exports are 26.3% of goods exports and crude oil production is close to the high for the available history (154.0 million barrels in August 2026, against 156.5 million barrels in December 2025), with Alberta producing 84.8% of it.
- Export diversification: in the latest month, exports to the United Kingdom changed 52.9%, to China 67.3% and to the European Union 3.9% from a year earlier, and the US share (70.2%) is below its twenty-year high of 79.6%. One month against the same month a year earlier is a noisy measure.
- In August 2026, electricity generation was 54.8% hydro and 12.4% nuclear, and wind output changed by 1.0% and solar by -7.0% from a year earlier.
- Business investment in machinery and equipment is rising (6.3% over the year) and intellectual property investment is 39.7% above its end-2019 level, the kind of investment that aims to raise productivity.
- Household finances: the household debt-to-income ratio has fallen 1.0 percentage points over the year.
Domestic and international pressures
Domestic: a falling participation rate, public-sector job losses, an aging population, unit labour cost growth of 3.2% a year and weak business investment in structures. International: tariff uncertainty, energy-market volatility and tighter financial conditions. The domestic pressures are measured in earlier sections; the international ones are named by the Bank of Canada and not measured here.
Policy decisions to watch
The Bank of Canada's next rate announcement on 9 December 2026 and its next Monetary Policy Report in January 2027; changes to US tariffs and Canadian countermeasures; federal and provincial budget and fiscal updates; and what follows the July 2026 review of the Canada-United States-Mexico Agreement. Release dates are in the release calendar.
Alternative scenarios
Scenario pathways are qualitative, not forecasts, and appear on the scenarios page as they are completed. Each lists the relationships that are documented, the ones that are only hypotheses, and what is not measured. Northline does not publish probabilities.
What to watch
The October CPI on 16 November; third-quarter GDP on 30 November; the November jobs report on 4 December; the October trade data on 8 December; the Bank of Canada's 9 December decision; and oil prices.
Prepared with AI assistance.
Follow the relationships
- Canada 12 with evidence · 22 recorded Open in Studio
- US tariff announcements and Canadian counter-measures (2026) 0 with evidence · 0 recorded Open in Studio
- Middle East conflict and disrupted energy shipping (2026) 1 with evidence · 1 recorded Open in Studio
- Bank of Canada policy rate 8 with evidence · 8 recorded Open in Studio
- World oil price (WTI) 16 with evidence · 16 recorded Open in Studio
Upcoming releases
- 2026-11-16 Consumer Price Index October 2026 · Statistics Canada
- 2026-12-04 Labour Force Survey November 2026 · Statistics Canada
- 2026-12-09 Bank of Canada interest rate announcement · Bank of Canada
- 2027-01-27 Bank of Canada interest rate announcement and Monetary Policy Report · Bank of Canada
Sources for this section (15 datasets, 7 documents)
Data
- Gross domestic product, expenditure-based, Canada, quarterly (36-10-0104-01; 4 series; latest Q2 2026; retrieved 2026-10-23)
- Labour force characteristics, monthly, seasonally adjusted and trend-cycle (14-10-0287-01; 2 series; latest October 2026; retrieved 2026-11-07)
- Consumer Price Index, monthly, not seasonally adjusted (18-10-0004-01; 2 series; latest September 2026; retrieved 2026-10-23)
- Consumer Price Index (CPI) statistics, measures of core inflation and other related statistics - Bank of Canada definitions (18-10-0256-01; 2 series; latest September 2026; retrieved 2026-10-23)
- Bank of Canada target for the overnight rate (business daily) (V39079; 1 series; latest 5 November 2026; retrieved 2026-11-07)
- International merchandise trade for all countries and by Principal Trading Partners, monthly (12-10-0011-01; 4 series; latest September 2026; retrieved 2026-11-05)
- Population estimates, quarterly (17-10-0009-01; 1 series; latest 1 July 2026; retrieved 2026-10-23)
- Conventional 5-year mortgage rate (posted) (V80691335; 1 series; latest 28 October 2026; retrieved 2026-11-03)
- Debt service indicators of households, national balance sheet accounts (11-10-0065-01; 1 series; latest Q2 2026; retrieved 2026-10-25)
- Household sector credit market summary table, seasonally adjusted estimates (38-10-0238-01; 1 series; latest Q2 2026; retrieved 2026-10-23)
- International merchandise trade by commodity, monthly (12-10-0163-01; 1 series; latest September 2026; retrieved 2026-11-05)
- Statement of government operations and balance sheet, government finance statistics, quarterly (10-10-0015-01; 1 series; latest Q2 2026; retrieved 2026-10-23)
- Supply and disposition of crude oil and equivalent (25-10-0063-01; 2 series; latest August 2026; retrieved 2026-11-05)
- Electric power generation, monthly generation by type of electricity (25-10-0015-01; 4 series; latest August 2026; retrieved 2026-11-05)
- Indexes of business sector labour productivity, unit labour cost and related measures, seasonally adjusted (36-10-0206-01; 1 series; latest Q2 2026; retrieved 2026-10-23)
Documents cited
- Bank of Canada: Bank of Canada raises the policy rate by 25 basis points to 2½% (28 October 2026) (retrieved 2026-11-07)
- Office of the United States Trade Representative: Ambassador Greer Issues Statement on the USMCA Joint Review (retrieved 2026-11-06)
- Global Affairs Canada: Statement by Minister LeBlanc following trilateral CUSMA joint review meeting (retrieved 2026-11-06)
- Immigration, Refugees and Citizenship Canada: Supplementary Information for the 2027-2029 Immigration Levels Plan (retrieved 2026-11-06)
- Bank of Canada: Monetary Policy Report, October 2026: Global economy (retrieved 2026-11-07)
- Bank of Canada: Bank of Canada maintains the policy rate (2 September 2026) (retrieved 2026-10-22)
- Bank of Canada: Monetary Policy Report, October 2026: Risks (retrieved 2026-11-07)
Each dataset is used under its licence; attribution and series-level detail are in each chart’s “About this data” panel. Limitations: Northline does not forecast. The Bank of Canada projections quoted are those in its 28 October 2026 announcement, which gives headline growth and the near-term inflation path only, and the US and world growth projections in the global economy section of its October 2026 Monetary Policy Report; the full Monetary Policy Report tables (inflation by year, output gap, the oil and tariff assumptions) are not used here. Opportunities listed are observations from the data, not predictions or recommendations. Scenario pathways are qualitative and unquantified except for one published sensitivity.
Canada → province → metropolitan area → city report
Choose a layer, then a province or city. Cities link to their own pages.
Canada: latest value of one provincial indicator
Natural Earth boundaries (public domain); Statistics Canada data. City circles are approximate city centres, not boundaries.
Large circles are the six large cities (select one for its panel). Small hollow marks open the data profiles of eight more metropolitan areas (the Winnipeg and Halifax profiles link on to their city pages): Winnipeg, Halifax, Québec, Hamilton, Kitchener–Cambridge–Waterloo, London, Saskatoon, Regina.
The map loads when it comes into view.
Data table for this layer (keyboard and screen-reader alternative)
How the world reaches Canada’s provinces and cities
Documented exposures, sourced mechanisms, observed correlations and hypotheses, each labelled.
Open the explorer at Canada → · oil price · policy rate · Alberta · Calgary · Edmonton · Industry reference pages
Scenarios are not forecasts
Qualitative pathways with assumptions, and one numerical sensitivity where a published estimate exists. The historical explorer is the Compare tool.
How to read this report
Statistics Canada Open Licence; Bank of Canada terms; CMHC data distributed by Statistics Canada carry a CMHC notice.
Provincial and metropolitan geographies are never substituted for one another: metropolitan series are three-month moving averages (labour) or CMA-level (population, starts); CPI for Ottawa–Gatineau is the Ontario part only. Full inventory, source terms, the retired-table map (26 of 52 Calgary-report series now verified against successor tables) and withheld data: Methodology and sources.