GlobalCanadaCities

Atlas · YHZ · Nova Scotia

Halifax

544,834 people, July 2025. Metropolitan area measures, beside the 13 other cities Northline covers.

Map of Canada with provincial boundaries. The 14 cities Northline covers are listed in the text.

Unemployment rateHalifax among 14 cities

Measure
2021202220232024202520264.0%6.0%8.0%10.0%12.0%7.1%Edmonton6.7%Vancouver6.6%Calgary5.4%Halifax

Pin up to four cities

    Three-month moving average, seasonally adjusted. Statistics Canada, Labour Force Survey.

    Table view
    Latest value for each city.
    CityLatestPeriod
    London8.1%Oct 2026
    Hamilton7.6%Oct 2026
    Toronto7.1%Oct 2026
    Ottawa–Gatineau7.1%Oct 2026
    Edmonton7.1%Oct 2026
    Kitchener–Waterloo7.1%Oct 2026
    Montréal6.9%Oct 2026
    Vancouver6.7%Oct 2026
    Calgary6.6%Oct 2026
    Saskatoon5.9%Oct 2026
    Regina5.9%Oct 2026
    Halifax5.4%Oct 2026
    Winnipeg5.0%Oct 2026
    Québec4.5%Oct 2026

    Vital signs

    Halifax in eight numbers

    Vital signs for Halifax
    MeasureLatestPeriod and rank among 14 citiesContextTrend
    Unemployment rate5.4%Oct 2026, twelfth highest of 14Nova Scotia 6.2%, Canada 6.7% (monthly measures)
    Employment rate65.0%Oct 2026, fourth highest of 14
    Consumer prices, 12-month change5.4%Sep 2026, highest of 11Nova Scotia 5.6%, Canada 3.1%
    Population544,834July 2025
    Population growth1.6%Year to July 2025, sixth highest of 14
    Housing starts, last 12 months5,107To Sep 2026, ninth highest of 14
    Average two-bedroom rentC$1,828October 2025, fourth highest of 14
    Rental vacancy rate2.6%October 2025, twelfth highest of 14

    City figures are metropolitan-area measures. National and provincial unemployment rates are monthly, so they are close to but not the same measure as the three-month city averages.

    What it is built on

    Jobs by industry

    1. Health care and social assistance14.7% vs 13.5%
    2. Retail trade11.9% vs 11.6%
    3. Public administration11.8% vs 7.1%
    4. Professional and technical services10.3% vs 11.4%
    5. Educational services8.9% vs 8.3%
    6. Finance and insurance5.9% vs 6.3%
    7. Accommodation and food5.2% vs 4.9%
    8. Manufacturing5.0% vs 8.4%
    9. Administrative and support4.0% vs 3.3%

    Share of jobs by place of work, 2021 Census. The tick marks the 14 cities combined. Total jobs counted: 203,510.

    See Halifax’s skyline in the Field

    Rates and housing here

    Where the ripple reaches Halifax

    A reading path through recorded links, not a forecast. Effects along a chain are never added or multiplied.

    Follow the ripple

    Where to go next

    ServicesGet a full profileA sourced profile of Halifax for a lender, board or council. AtlasCompare placesSet Halifax beside other cities and provinces. StudioOpen in StudioA workspace prepared from these measures, with the gaps stated.
    YHZ · Halifax CMA · city dashboard

    The Halifax economy: strong growth on construction and migration, with population growth slowing

    Halifax's output grew faster than most comparable cities in 2025, the Halifax Partnership reports, and close to a record number of homes are under construction; population growth has slowed, largely because fewer international students are arriving. It does not cover wages by city or resale prices; the page lists what is missing.

    Analyze Halifax in Intelligence Studio

    Opens a workspace prepared from the published Halifax measures above, with the gaps stated.

    Halifax versus Calgary in Studio → · Choose other places to compare →

    30 secondsRead the vital signs above; each measure links to its chart or section. Go to the indicators
    5 minutesRead the findings at the top, then the sourced story of what drives this economy. Go to the outlook
    20 minutesRead the local-economy section, then work through the charts and the relationships that reach the city. Go to the charts
    Halifax at a glance

    What are the main things to know about Halifax's economy right now?

    Halifax had 303 thousand workers in October 2026, with unemployment at 5.4%; its housing, prices and population are covered in the sections below

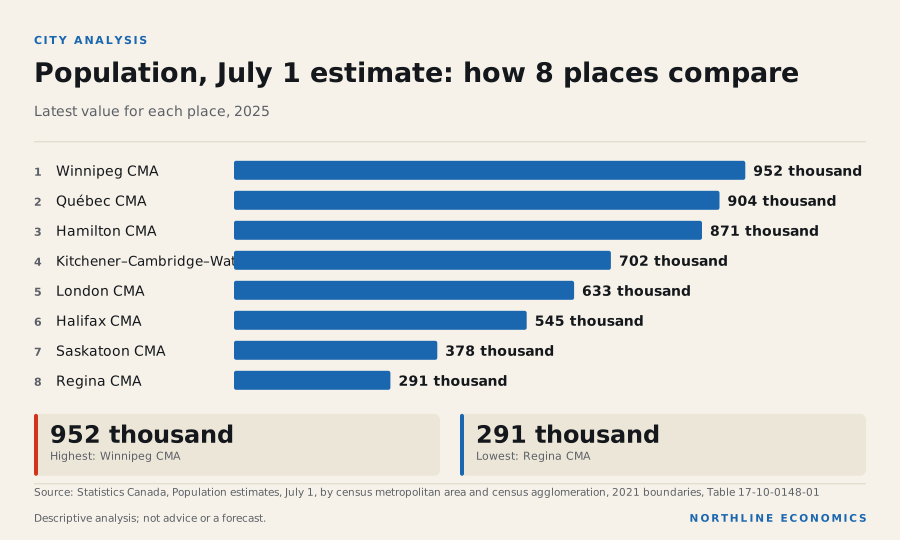
    Graphic: Population, July 1 estimate: how 8 places comparePopulation, July 1 estimate: how 8 places compare. Winnipeg CMA 952 thousand; Québec CMA 904 thousand;…

    Halifax: a building boom on top of a growing population

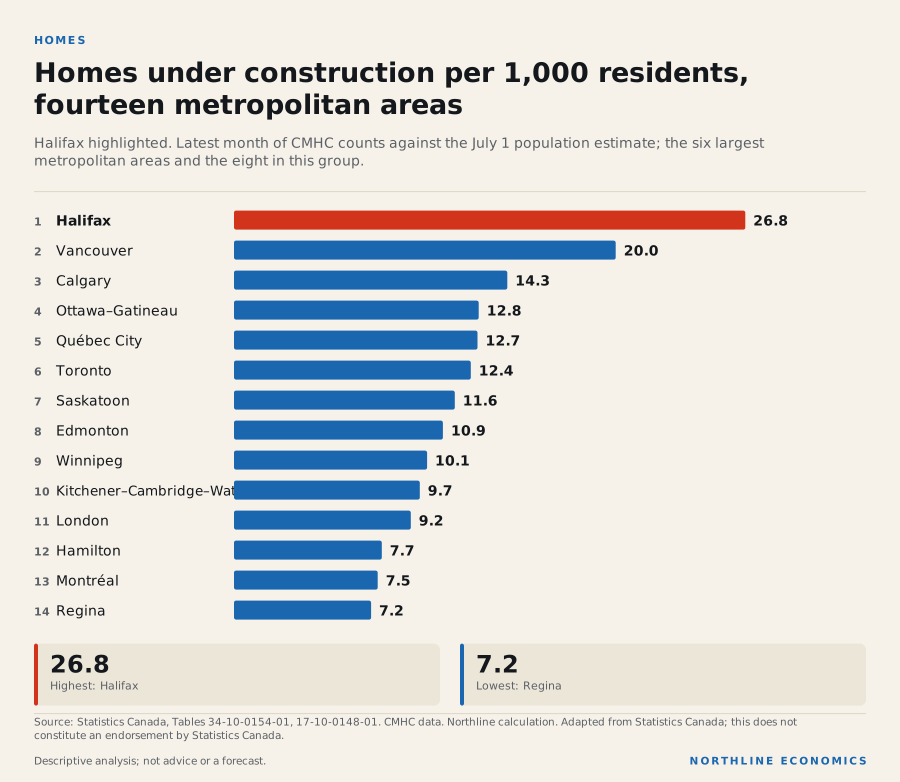
    Halifax is building more than any comparable metropolitan area. 14,573 homes were under construction in September 2026, which is 26.8 for every 1,000 residents, the highest of the fourteen metropolitan areas for which Northline holds the counts and well ahead of Vancouver's 20.0. Builders also began 388 homes in the latest month, third among the eight metropolitan areas in this group.

    Homes under construction per 1,000 residents, fourteen metropolitan areasHomes under construction per 1,000 residents, fourteen metropolitan areas. Halifax 26.8; Vancouver 20.0; Calgary 14.3; Ottawa–Gatineau 12.8; Québec City 12.7; Toronto 12.4; Saskatoon 11.6; Edmonton 10.9.HOMESHomes under construction per 1,000 residents,fourteen metropolitan areasHalifax highlighted. Latest month of CMHC counts against the July 1 population estimate; the six largestmetropolitan areas and the eight in this group.1Halifax26.82Vancouver20.03Calgary14.34Ottawa–Gatineau12.85Québec City12.76Toronto12.47Saskatoon11.68Edmonton10.99Winnipeg10.110Kitchener–Cambridge–Waterloo9.711London9.212Hamilton7.713Montréal7.514Regina7.226.8Highest: Halifax7.2Lowest: ReginaSource: Statistics Canada, Tables 34-10-0154-01, 17-10-0148-01. CMHC data. Northline calculation. Adapted from Statistics Canada; this does notconstitute an endorsement by Statistics Canada.NORTHLINE ECONOMICSDescriptive analysis; not advice or a forecast.
    The data behind this graphic
    Homes under construction per 1,000 residents, fourteen metropolitan areas
    ItemValue
    Halifax26.8
    Vancouver20.0
    Calgary14.3
    Ottawa–Gatineau12.8
    Québec City12.7
    Toronto12.4
    Saskatoon11.6
    Edmonton10.9
    Winnipeg10.1
    Kitchener–Cambridge–Waterloo9.7
    London9.2
    Hamilton7.7
    Montréal7.5
    Regina7.2

    Download this graphic (SVG, with source)

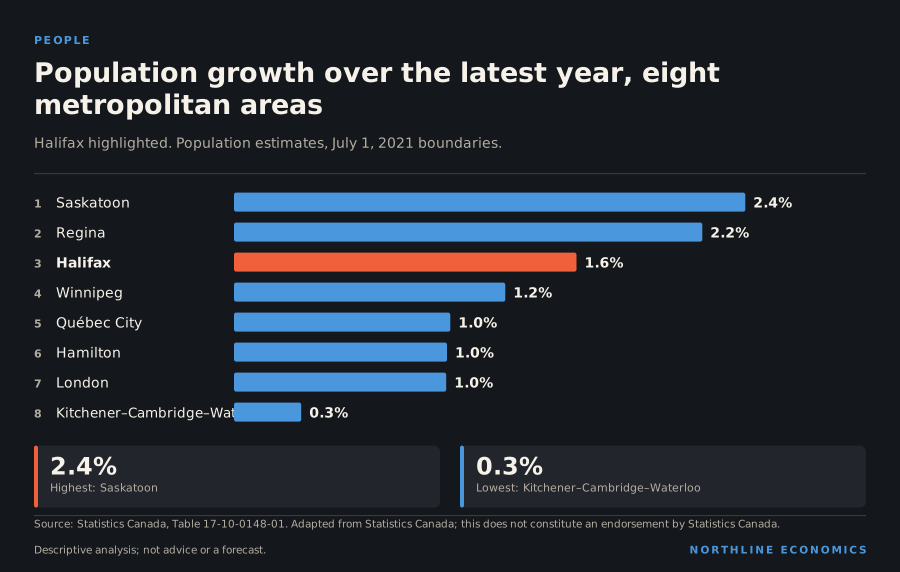
    The population is also growing. It grew 1.6% in the year to July 2025, third among the eight, and Halifax was one of only two of them to gain residents from other provinces: net interprovincial migration was 1,098, the largest. Immigrants numbered 8,207, and net non-permanent residents changed -788, so the non-permanent outflow seen in Toronto and Vancouver has also reached Halifax, though at a smaller scale.

    Population growth over the latest year, eight metropolitan areasPopulation growth over the latest year, eight metropolitan areas. Saskatoon 2.4%; Regina 2.2%; Halifax 1.6%; Winnipeg 1.2%; Québec City 1.0%; Hamilton 1.0%; London 1.0%; Kitchener–Cambridge–Waterloo 0.3%.PEOPLEPopulation growth over the latest year, eightmetropolitan areasHalifax highlighted. Population estimates, July 1, 2021 boundaries.1Saskatoon2.4%2Regina2.2%3Halifax1.6%4Winnipeg1.2%5Québec City1.0%6Hamilton1.0%7London1.0%8Kitchener–Cambridge–Waterloo0.3%2.4%Highest: Saskatoon0.3%Lowest: Kitchener–Cambridge–WaterlooSource: Statistics Canada, Table 17-10-0148-01. Adapted from Statistics Canada; this does not constitute an endorsement by Statistics Canada.NORTHLINE ECONOMICSDescriptive analysis; not advice or a forecast.
    The data behind this graphic
    Population growth over the latest year, eight metropolitan areas
    ItemValue
    Saskatoon2.4%
    Regina2.2%
    Halifax1.6%
    Winnipeg1.2%
    Québec City1.0%
    Hamilton1.0%
    London1.0%
    Kitchener–Cambridge–Waterloo0.3%

    Download this graphic (SVG, with source)

    Low unemployment and fast-rising prices

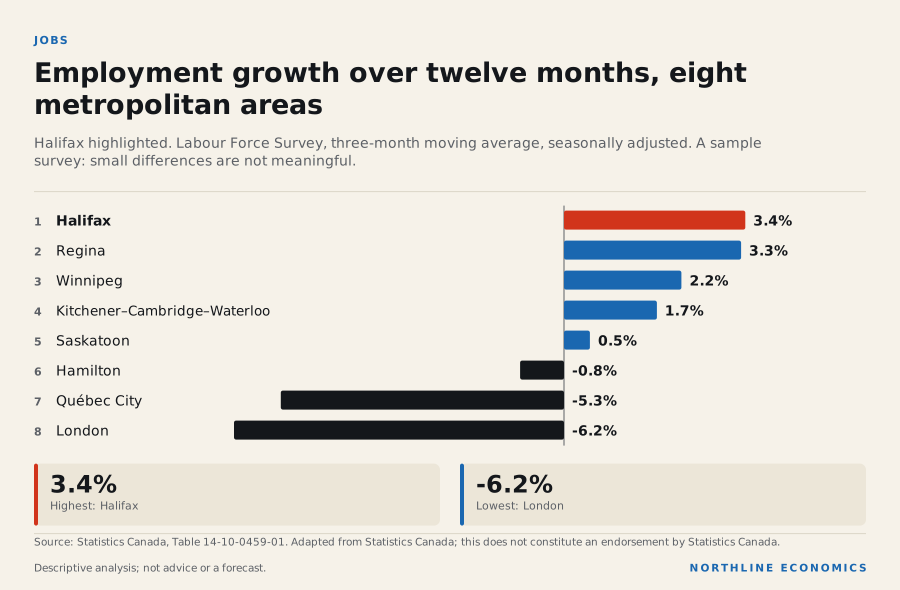
    Unemployment was 5.4% in October 2026, the third lowest of the eight, and down from the 5.8% of a year earlier. Employment grew 3.4%, the largest rise of the eight, and the employment rate of 65.0% is third of the eight.

    Prices are the unusual feature. Consumer prices rose 5.4% in the twelve months to September 2026, the highest of the five cities in the group with an index and well above the 3.1% national rate, even though new-home prices rose only 0.6%. The two measures do not cover the same things, and the index is held here for all items only, so the data do not say which components drive Halifax's inflation.

    Employment growth over twelve months, eight metropolitan areasEmployment growth over twelve months, eight metropolitan areas. Halifax 3.4%; Regina 3.3%; Winnipeg 2.2%; Kitchener–Cambridge–Waterloo 1.7%; Saskatoon 0.5%; Hamilton -0.8%; Québec City -5.3%; London -6.2%.JOBSEmployment growth over twelve months, eightmetropolitan areasHalifax highlighted. Labour Force Survey, three-month moving average, seasonally adjusted. A samplesurvey: small differences are not meaningful.1Halifax3.4%2Regina3.3%3Winnipeg2.2%4Kitchener–Cambridge–Waterloo1.7%5Saskatoon0.5%6Hamilton-0.8%7Québec City-5.3%8London-6.2%3.4%Highest: Halifax-6.2%Lowest: LondonSource: Statistics Canada, Table 14-10-0459-01. Adapted from Statistics Canada; this does not constitute an endorsement by Statistics Canada.NORTHLINE ECONOMICSDescriptive analysis; not advice or a forecast.
    The data behind this graphic
    Employment growth over twelve months, eight metropolitan areas
    ItemValue
    Halifax3.4%
    Regina3.3%
    Winnipeg2.2%
    Kitchener–Cambridge–Waterloo1.7%
    Saskatoon0.5%
    Hamilton-0.8%
    Québec City-5.3%
    London-6.2%

    Download this graphic (SVG, with source)

    Output

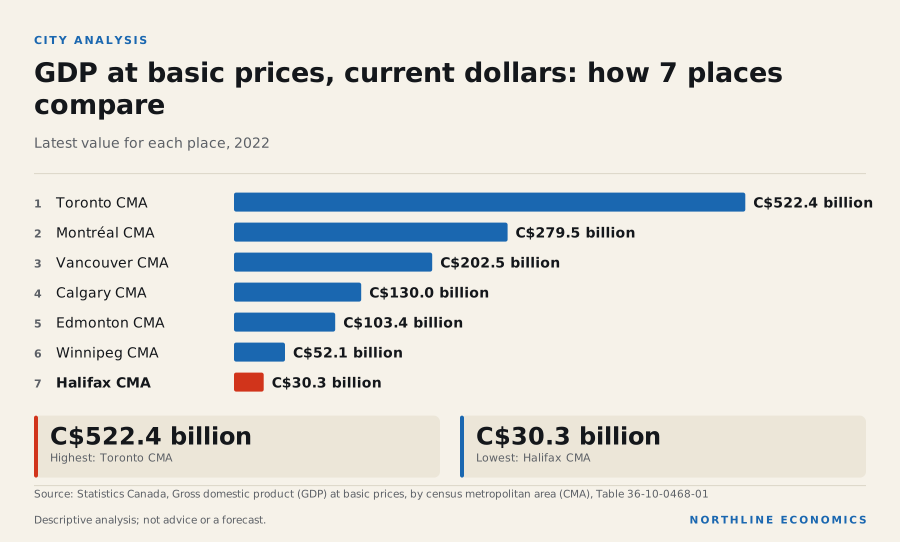
    Gross domestic product at basic prices was C$30.3 billion in 2022, 38.1% more than five years earlier in current dollars, the fastest of the eight; because current dollars include inflation, this overstates real growth.

    What it means for decisions

    For a builder or lender, Halifax's pipeline is large for the city's size, and flat new-home prices alongside it are a reason to watch absorption rather than assume demand. For an employer, unemployment is lower than in Ontario's southwestern cities and higher than in Québec City or Winnipeg. For a household, the inflation figure is the thing to understand before moving.

    What the data cannot say: the counts do not show how many of the homes are rental or ownership, when they will complete, or who will occupy them. Labour figures are from a sample survey; output is about four years old. Nothing here is a forecast.

    1. Jobs: 303 thousand people are employed, 3.4% against a year ago; unemployment is 5.4%. The employment rate, 65.0%, is 3rd of 8 among the eight metropolitan areas in this group. Labour
    1. Prices: inflation is 5.4%, against 3.1% for Canada. The city index is held here for all items only. Prices
    1. People: the population changed 1.6% in the year to July 2025. Net non-permanent residents changed -788 in the latest demographic year. Population
    1. Housing: new-home prices changed +0.6% in the twelve months to September 2026, with 14,573 homes under construction. Housing
    1. Output: the economy produced C$30.3 billion in 2022. Output The industry mix from the 2021 Census is in Industry.
    1. Connections: the links that reach Halifax are national or provincial, and none is measured for the city. Connections

    Prepared with AI assistance.

    Follow the relationships

    Sources for this section (7 datasets, 0 documents)

    Data

    Each dataset is used under its licence; attribution and series-level detail are in each chart’s “About this data” panel. Limitations: Metropolitan labour series are sample-survey estimates, three-month averages, and move more than provincial ones. Output is annual, in current dollars and about four years old; population is the July 1 estimate and migration series cover the twelve months from July 1 of the year shown. Rankings compare only the eight metropolitan areas in this group (and fourteen for homes under construction per 1,000 residents). Consumer price indices exist for five of the eight and are held here for all items only. No wages, resale prices, rents on the whole housing stock or commercial real estate data are held.

    0.5 · Output and economic size

    How large is the Halifax economy and how has its output changed?

    The Halifax economy produced C$30.3 billion of output in 2022, 74.4% more in current dollars than in 2009

    Graphic: GDP at basic prices, current dollars: how 7 places compareGDP at basic prices, current dollars: how 7 places compare. Toronto CMA C$522.4 billion; Montréal CMA…

    What happened

    At basic prices and in current dollars, the Halifax economy produced C$30.3 billion of output in 2022, the latest reference year in Statistics Canada's table. Measured in current dollars, output was 74.4% higher in 2022 than in 2009 and 25.8% higher than in 2019. Over the same period since 2009 Winnipeg grew 64.8%, Calgary 72.4%, Edmonton 54.6%, Toronto 85.0%, Vancouver 98.1% and Montréal 75.3%. Nova Scotia's real GDP was 16.8% higher in 2025 than in 2019; that is a different measure (market prices at 2017 constant prices, province) and is not comparable with the metropolitan current-dollar figures.

    GDP at basic prices: eight more metropolitan areas, indexed

    Annual, current dollars; start of period = 100. Statistics Canada table 36-10-0468-01; the reference year lags the present by about three and a half years.

    Chart loads when it comes into view.

    Latest values: Halifax CMA 30,310,000,000 (2022); Winnipeg CMA 52,090,000,000 (2022); Québec CMA 59,040,000,000 (2022); Hamilton CMA 44,090,000,000 (2022); and 4 more in the data table.

    Why it happened

    Not assessed. The table is in current dollars, so these changes include price increases, and it is not divided by population, so the figures do not separate growth in the number of people from growth in output per person. This section reports the data; attributed explanations of the differences are in the economic story and local-economy sections of this page.

    Why it matters

    GDP at basic prices is the broadest measure of local production that Statistics Canada publishes for metropolitan areas. It shows how large the local economy is, but not who earns the income, what is produced, or how the economy is doing now.

    History

    The series starts in 2009 and ends in 2022. A fall in output in any year in between would show in the chart; no year-by-year explanation is offered here.

    Across geographies

    The metropolitan series are comparable with each other because they come from one table with one definition and one price basis. Levels depend on city size; use growth rates for comparison.

    What it influences

    Not assessed. No relationship in the recorded graph links metropolitan output to another variable.

    Risks

    The table ends in 2022 and describes nothing since; it cannot show the effects of recent changes in interest rates, trade policy, population or commodity prices on Halifax.

    What to watch

    Statistics Canada's next release of table 36-10-0468-01. No release date for it is in the calendar this site holds, and none is assumed.

    Prepared with AI assistance.

    Follow the relationships

    Sources for this section (2 datasets, 0 documents)

    Data

    Each dataset is used under its licence; attribution and series-level detail are in each chart’s “About this data” panel. Limitations: GDP at basic prices for metropolitan areas is in current dollars, so changes include price increases, and the reference year lags the present by almost four years. The provincial total on the same basis is not held for this province, so no provincial share is stated.

    0.5 · The Halifax economy: strong growth on construction and migration, with population growth slowing

    What has driven Halifax's strong recent growth, how durable is it, and what are the constraints?

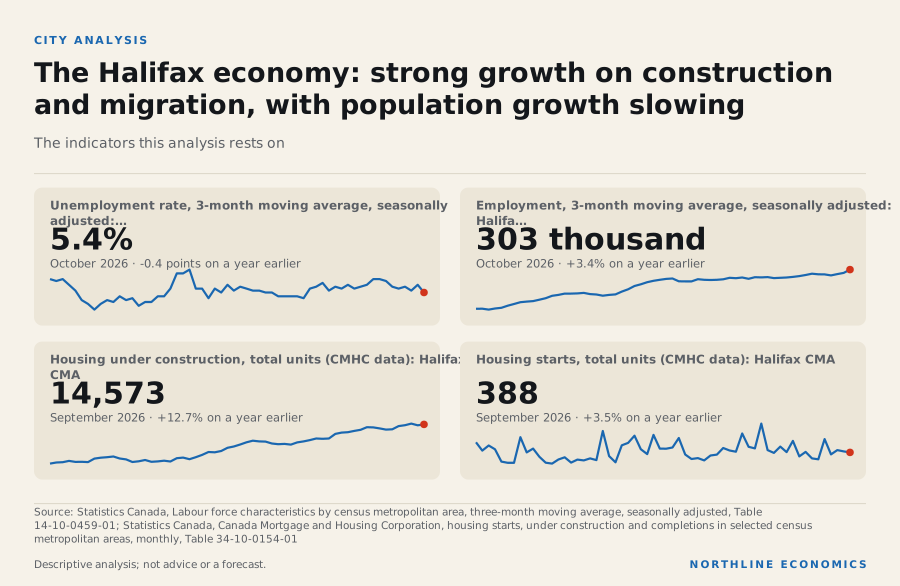
    Halifax's output grew faster than most comparable cities in 2025, the Halifax Partnership reports, and close to a record number of homes are under construction; population growth has slowed, largely because fewer international students are arriving

    Graphic: The Halifax economy: strong growth on construction and migration, w…The Halifax economy: strong growth on construction and migration, with population growth slowing.…

    What happened

    Halifax's unemployment rate was 5.4% in October 2026 and employment was 303 thousand, 3.4% on a year earlier. The metropolitan area had 14,573 homes under construction at the end of September 2026, 12.7% against a year earlier, and started 5,107 over twelve months. The average two-bedroom rent in purpose-built rental structures of three or more units was C$1,828 in the October 2025 survey, 7.0% higher than a year earlier, with a vacancy rate of 2.6%. The net change in non-permanent residents in the latest demographic year was -788, against 5,093 the year before.

    Why it happened

    Statistics Canada's revised industry accounts of 5 November 2026 show Nova Scotia's real output at basic prices 2.7% higher in 2025 than in 2024. Construction grew 10.2%, faster than any other industry shown in these series, and construction (C$316 million), real estate (C$276 million) and health care and social assistance (C$192 million) added the most output.

    Historical context

    A Halifax Regional Municipality staff report says Halifax accounted for 93 per cent of provincial GDP growth from 2024 to 2025; it uses the Halifax Index's definition of Halifax.

    Evidence: Halifax Regional Municipality: Development of the Next Economic Strategy (staff report, CPED Standing Committee)

    Historical context

    The Halifax Partnership's 2026 Index, in its press release, reports that Halifax's real GDP growth in 2025 was the second highest among its benchmark cities, and that population growth slowed from 2.4 per cent in 2024 to a lower rate in 2025 largely because of a significant drop in international students.

    Evidence: Halifax Partnership: Halifax Among Canada's Top Cities for Growth as Pressures Rise (Halifax Index 2026 release)

    Historical context

    The HRM report says net immigration declined but remained positive while fewer non-permanent residents, notably international students, made a net negative contribution.

    Evidence: Halifax Regional Municipality: Development of the Next Economic Strategy (staff report, CPED Standing Committee)

    Historical context

    Statistics Canada adds that in Atlantic Canada large urban centres had seen higher gains from interprovincial migration since 2018/2019 but those have moderated or become net losses.

    Evidence: Statistics Canada: The Daily: Canada's population estimates: Subprovincial areas, 2025

    Why it matters

    Historical context

    CMHC's fall 2026 Housing Supply Report says that because of stronger population growth completions have not kept up with demand, that units under construction reached a record 14,400 in the first half of 2026 against fewer than 5,900 in 2021, that rental units account for 78 per cent of starts and 89 per cent of units under construction, and that record apartment completions are contributing to rising vacancy rates and more moderate rent growth.

    Evidence: Canada Mortgage and Housing Corporation: Fall 2026 Housing Supply Report

    Historical context

    CMHC's January 2026 outlook says it expects easing in the rental market to reflect record completions, many units under construction and weaker demand because of fewer non-resident immigrants.

    Evidence: CMHC: Housing Market Outlook 2026 (winter edition; forecasts as of January 15, 2026)

    Historical context

    The Government of Nova Scotia says that starting January 1, 2026 rent can only increase by up to 5% a year and that the cap remains in place until December 31, 2027.

    Evidence: Government of Nova Scotia: Residential Tenancies Program: legislative changes

    Historical context

    CMHC says rent caps may also reduce the overall rental stock as some units are removed from the market and converted to other uses, mostly condominiums.

    Evidence: CMHC: Housing Market Outlook 2026 (winter edition; forecasts as of January 15, 2026)

    History

    Halifax's unemployment rate has ranged from 4.5% (June 2022) to 12.1% (June 2020) over ten years, and the metropolitan population grew 26.0% over ten years.

    Statistics Canada's industry series shows Nova Scotia's real output falling in 2012 and 2013 (-0.9% and -0.3%), the only declines between 2008 and 2019; over those two years manufacturing output fell 10.9% and public administration 3.0%.

    Across geographies

    In August 2026 Nova Scotia's average weekly earnings were 90.2% of the national average and 3.6% higher than a year earlier, against 3.8% nationally (not seasonally adjusted, so each month is compared with the same month a year before).

    Historical context

    In October 2026 the metropolitan area's unemployment rate (three-month average) was 5.4% and its participation rate 68.7%; the province's Labour Force Survey release for that month puts the rest of Nova Scotia at 7.2 per cent and 55.7 per cent.

    Evidence: Government of Nova Scotia, Finance and Treasury Board (summarizing Statistics Canada LFS): Labour Market Trends, October 2026

    What it influences

    Historical context

    The federal government says it has committed 100 million dollars to advance offshore wind development in Nova Scotia, that the Atlantic Energy Strategy was referred to the Major Projects Office in September 2025, and describes a skilled offshore workforce from the region's oil and gas history.

    Evidence: Natural Resources Canada: Canada advances Wind West to bring major new clean power to Atlantic Canada

    Historical context

    The Department of National Defence estimates the River-class destroyer contract at 719.3 million dollars a year of national GDP; that is a national figure for ships built at Halifax Shipyard, not a Halifax estimate.

    Evidence: National Defence, Government of Canada: Government of Canada announces contract award for the construction of the River-class destroyers

    Risks

    Historical context

    CMHC says infrastructure limitations related to water, waste management and transport are limiting project sizes and creating risks for future supply growth, and that the largest risk to Halifax's long-term affordability outlook is the ability to maintain housing production once the current pipeline is completed.

    Evidence: Canada Mortgage and Housing Corporation: Fall 2026 Housing Supply Report

    Historical context

    The province's September 2026 budget update reports a deficit of $1.4 billion for 2025-26 and projects $1.4 billion for 2026-27.

    Evidence: Government of Nova Scotia (Finance and Treasury Board): News release: First Budget 2026-27 Update, Public Accounts for 2025-26 Released (24 September 2026)

    Historical context

    The HRM report says provincial funding changes in 2026-27 included the removal of support for investment attraction.

    Evidence: Halifax Regional Municipality: Development of the Next Economic Strategy (staff report, CPED Standing Committee)

    What to watch

    Historical context

    The Halifax Regional Municipality's staff report forecasts growth of 1.5 per cent in 2026 and 1.8 per cent a year through 2030; the Atlantic Canada Opportunities Agency says average real GDP growth across the region ranges from 1.2 to 1.6 per cent in 2026. These are the publishers' forecasts, not Northline's. Statistics Canada's quarterly provincial estimates of non-permanent residents and its next metropolitan population estimates show whether the slowdown in international students is deepening, and CMHC's autumn Rental Market Survey shows how rental demand is responding (release calendar).

    Evidence: Halifax Regional Municipality: Development of the Next Economic Strategy (staff report, CPED Standing Committee); Atlantic Canada Opportunities Agency: 2026-27 Departmental Plan: Operating context

    Prepared with AI assistance.

    Follow the relationships

    Sources for this section (8 datasets, 11 documents)

    Data

    Documents cited

    Each dataset is used under its licence; attribution and series-level detail are in each chart’s “About this data” panel. Limitations: Every explanation here is a statement by the named organisation. Statements from the Halifax Regional Municipality and the Halifax Partnership use the Halifax Index's definition of Halifax, which may differ from the census metropolitan area; Nova Scotia statements describe the province; Atlantic statements describe the region; each is said where it is used. The Halifax Partnership's 2026 Index is cited from its press release. Metropolitan wages, productivity levels and port volumes are not held; annual employment by industry is a Labour Force Survey sample estimate, noisy for small groups. Forecasts are the publishers' and are not Northline forecasts.
    0.6 · Halifax's local economy: a navy-and-shipyard, hospital, university and port city whose big projects are public and whose strategy is being re-set

    Who and what are the local drivers of the Halifax economy, which large projects are under way, and where do the sources describe only Nova Scotia?

    Halifax's economy rests on public-sector anchors (the navy, a shipyard building warships for the federal government, hospitals, universities) and on a port and logistics cluster; the GDP target in the municipality's strategy was met early, but funding for investment attraction was cut and international-student numbers are falling

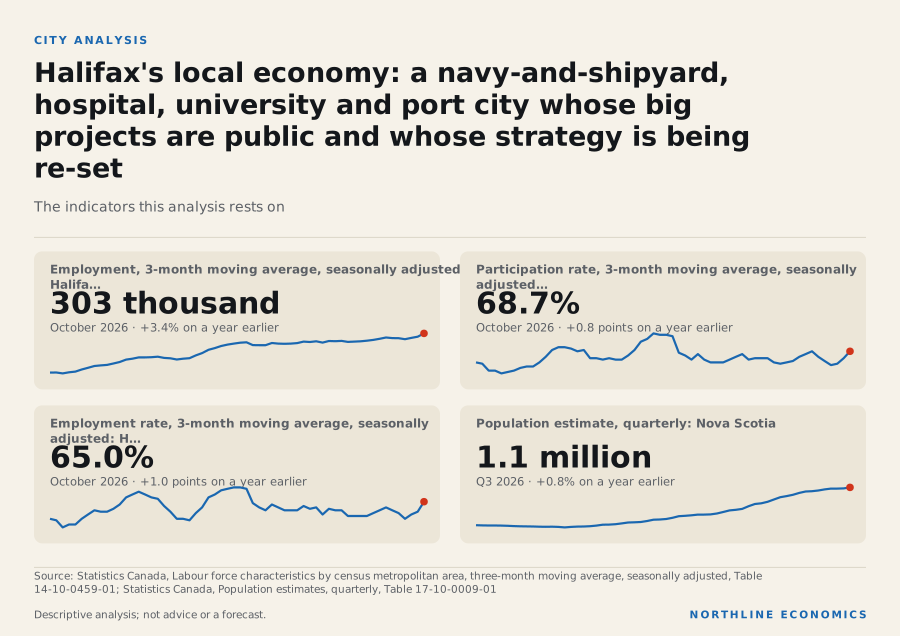
    Graphic: Halifax's local economy: a navy-and-shipyard, hospital, university …Halifax's local economy: a navy-and-shipyard, hospital, university and port city whose big projects are…

    What happened

    In the 2021 Census, 204 thousand jobs were located in the Halifax metropolitan area. Health care and social assistance accounted for 14.7% of them, retail trade 11.9% and public administration 11.8%. Educational services were 8.9%, professional, scientific and technical services 10.3%, finance and insurance 5.9%, construction 3.9% and transportation and warehousing 3.7%. In October 2026 303 thousand residents of the metropolitan area were employed (Labour Force Survey, three-month average; it counts people where they live, so it is not comparable with the census count of jobs located there), the participation rate was 68.7% and the employment rate 65.0%.

    Those census shares are a 2021 snapshot of where people work, not a ranking of employers; the rest of this section uses organisations' own statements to say what sits behind them.

    Why it happened

    Shipbuilding, defence and the navy

    Historical context

    Irving Shipbuilding, which builds at the Halifax Shipyard, says it has invested more than $400 million in the shipyard since being selected under the National Shipbuilding Strategy in 2011 and that it has a team of more than 2,400 shipbuilders; these are the company's own figures.

    Evidence: Irving Shipbuilding (company): Irving Shipbuilding home page

    Historical context

    The Department of National Defence puts the cost to build and deliver the first three River-class destroyers at 22.2 billion dollars (excluding taxes), and estimates the implementation contract at 5,250 jobs a year nationally over 2025 to 2039.

    Evidence: National Defence, Government of Canada: Government of Canada announces contract award for the construction of the River-class destroyers

    Historical context

    Invest Nova Scotia, a provincial agency, describes the Irving work as an $84 billion contract. That figure and the Department's initial contract value ($8 billion for the first six years) describe different things and are not reconciled here.

    Evidence: Invest Nova Scotia (provincial agency): Our High-Growth Sectors: Aerospace and Defence

    Historical context

    The Royal Canadian Navy says the military has become one of Halifax's largest employers and gives about 10 700 military and civilian personnel for Maritime Forces Atlantic; the page carries a 2021 date and the figure may have changed.

    Evidence: Royal Canadian Navy: Maritime Forces Atlantic

    Health care and universities

    Historical context

    The Government of Nova Scotia says the total cost of the Halifax Infirmary expansion from the agreement to 2061 will be 7.4 billion dollars under an agreement that includes construction of the tower and its maintenance over 30 years, and that the tower will add 216 beds.

    Evidence: Government of Nova Scotia: QEII Halifax Infirmary Expansion Enters Main Construction Phase

    Historical context

    The Dalhousie Gazette, a student newspaper, reports from a preliminary survey of the Association of Atlantic Universities that Dalhousie had 2,713 full-time international students on October 1, 2025, a 20.9 per cent decrease from the year before, and quotes Dalhousie's president on international students falling from one in four of its students four years ago to close to one in six last year.

    Evidence: Dalhousie Gazette (student newspaper): International enrolment continues to decline, putting financial strain on Dalhousie

    Opinion

    The census shares above show health care and education as large sources of jobs, but no source held here measures university or hospital employment or spending in Halifax today. A 2011 consultant study of Dalhousie's impact is not cited, so no university economic-impact figure is given.

    Ocean technology, finance and technology

    Historical context

    Invest Nova Scotia says the province has more than 300 ocean-related companies, that the COVE hub on Halifax Harbour is home to over 70 organizations, and that Canada's Ocean Supercluster is headquartered in Halifax. This is a promotional page about the province.

    Evidence: Invest Nova Scotia (provincial agency): Our High-Growth Sectors: Ocean Technology

    Historical context

    The same agency says Nova Scotia has more than 81,000 business-related occupations and a third-lowest operating cost for financial services operations in Canada; it gives no Halifax-only figure.

    Evidence: Invest Nova Scotia (provincial agency): Our High-Growth Sectors: Financial Services

    Historical context

    It says the province's information and communications technology sector employs over 38,000 professionals.

    Evidence: Invest Nova Scotia (provincial agency): Our High-Growth Sectors: Technology

    Port, logistics and industrial land

    Historical context

    Container News, reporting the Port of Halifax's annual release, says containerized cargo reached 502,000 TEU in 2025, a 1.4 per cent decline attributed to a lack of one-off vessel diversions, and that Halifax is the only port in Eastern Canada able to berth the largest container ships. The port's own release is not cited.

    Evidence: Container News (reporting the Port of Halifax release): Port of Halifax reports 2025 cargo results

    Historical context

    The municipality says Burnside industrial park has almost 1,400 enterprises and approximately 30,000 employees and the largest concentration of truck transportation in Atlantic Canada; the "largest" claims are the municipality's own marketing.

    Evidence: Halifax Regional Municipality: Burnside industrial park

    Tourism

    Historical context

    Tourism Nova Scotia's 2025 table lists 2,070 thousand enplanements at Halifax Stanfield International Airport and 357 thousand cruise passenger visits to Halifax. No figure for visitor spending in Halifax alone is given.

    Evidence: Tourism Nova Scotia: Nova Scotia Visitation Indicators, January to December 2025

    Why it matters

    Historical context

    A Halifax Regional Municipality staff report says the Halifax Partnership is the municipality's designated economic development organization, and that its 2022 strategy set targets to grow GDP to $26 billion and the labour force to 310,000 by 2027; the report counts the GDP target as already achieved.

    Evidence: Halifax Regional Municipality: Development of the Next Economic Strategy (staff report, CPED Standing Committee)

    Historical context

    The report says the Partnership supported five companies locating or expanding in Halifax, representing 238 anticipated jobs in 2025/26.

    Evidence: Halifax Regional Municipality: Development of the Next Economic Strategy (staff report, CPED Standing Committee)

    Historical context

    It also says that significant changes to provincial funding in 2026-27, including the removal of support for investment attraction and the absence of funding for business retention and expansion in urban and suburban areas, have reduced capacity to deliver core services that drive GDP growth, job creation and tax revenue.

    Evidence: Halifax Regional Municipality: Development of the Next Economic Strategy (staff report, CPED Standing Committee)

    Historical context

    The municipality's operating grant to the Partnership is $2,243,500 in 2026-27; the budget left out the customary annual increase, which the report describes as effectively a funding freeze.

    Evidence: Halifax Regional Municipality: Development of the Next Economic Strategy (staff report, CPED Standing Committee)

    Historical context

    The accompanying presentation quotes an economist from the University of Calgary's School of Public Policy saying that reducing internal trade barriers in Atlantic Canada is a low-cost, high-impact policy lever with potential to boost wages, productivity and growth; it is a quoted view, not a finding of the report.

    Evidence: Halifax Regional Municipality / Halifax Partnership: Halifax's Economic Strategy: Progress Update (presentation to CPED, June 18, 2026)

    History

    Historical context

    The municipality calls the Cogswell District, which replaces the Cogswell Interchange with a mixed-use neighbourhood on 16 acres of road infrastructure, the biggest city-building project in Halifax's history, with an expected gross cost of about $138.1 million and space for 2,500 people; the page says Phase II is underway.

    Evidence: Halifax Regional Municipality: Cogswell District Project Overview

    Historical context

    The 2022 strategy's long-term vision was to grow the economy to $34 billion and the population to 650,000 by 2037.

    Evidence: Halifax Regional Municipality: Development of the Next Economic Strategy (staff report, CPED Standing Committee)

    Across geographies

    Historical context

    Statistics Canada revised its population estimates in September 2026. Its current series shows Nova Scotia's population 0.8% higher on 1 April 2026 than a year earlier, and 8,262 people (0.8%) higher on 1 July 2026 than a year earlier, the smallest July-to-July gain since 2016. Neither is a Halifax figure.

    Evidence: Statistics Canada: The Daily: Canada's population estimates, second quarter 2026

    Historical context

    The Halifax Index press release gives 2024 population growth as 2.4 per cent, while the municipal staff report describes 3%+ growth in 2022 to 2024; the sources differ on the 2024 figure and neither is reconciled here.

    Evidence: Halifax Partnership: Halifax Among Canada's Top Cities for Growth as Pressures Rise (Halifax Index 2026 release); Halifax Regional Municipality: Development of the Next Economic Strategy (staff report, CPED Standing Committee)

    Historical context

    The Index says Halifax's real GDP per capita rose 1.2 per cent in 2025, the highest among its benchmark cities.

    Evidence: Halifax Partnership: Halifax Among Canada's Top Cities for Growth as Pressures Rise (Halifax Index 2026 release)

    Historical context

    The staff report ranks Halifax 15th of 41 census metropolitan areas for population growth.

    Evidence: Halifax Regional Municipality: Development of the Next Economic Strategy (staff report, CPED Standing Committee)

    What it influences

    Historical context

    The municipality puts the Windsor Street Exchange redevelopment, next to the port and trade corridors, at about $180 million, to be substantially complete by the end of 2029, with the municipality contributing $85.75 million and Halifax Water $60 million; Transport Canada's contribution is $23.5 million.

    Evidence: Halifax Regional Municipality: Windsor Street Exchange project: details

    Historical context

    Housing, Infrastructure and Communities Canada announced an additional $28 million for wastewater capacity linked to the project, which it says is intended to enable growth.

    Evidence: Housing, Infrastructure and Communities Canada: Building Canada strong by investing in the Windsor Street Exchange Redevelopment Project in Halifax

    Historical context

    Under a $79.3 million Housing Accelerator Fund agreement with CMHC, the municipality aims to create 2,600 net new units, part of a total target of 15,467 new units between 2023 and 2026, and says its initiatives are on track.

    Evidence: Halifax Regional Municipality: Housing Accelerator Fund

    Historical context

    The municipality's Rapid Transit Strategy proposes four bus rapid transit lines and three new ferry routes, with an investment total for the bus network of $189M to $217M over 7-8 Years.

    Evidence: Halifax Regional Municipality: Rapid Transit Strategy

    Historical context

    The 2026/27 municipal budget includes a capital budget of $316.7 million and a 7.5 per cent increase to the average residential and commercial property tax bill.

    Evidence: Halifax Regional Municipality: Regional Council approves 2026/27 municipal budget

    Risks

    Historical context

    The Halifax Partnership says rising costs, persistent productivity challenges and growing public debt are shaping a more complex outlook, and that housing affordability, productivity and fiscal sustainability remain defining challenges.

    Evidence: Halifax Partnership: Halifax Among Canada's Top Cities for Growth as Pressures Rise (Halifax Index 2026 release)

    Historical context

    The staff report says the Business Confidence Index rose to 28.3 in 2026 from 23.1, the first gain since 2022.

    Evidence: Halifax Regional Municipality: Development of the Next Economic Strategy (staff report, CPED Standing Committee)

    Opinion

    Much of what the sources describe as large and growing is financed or led by governments: a federal shipbuilding contract, a provincial hospital contract, a municipal interchange and neighbourhood, and federal and provincial infrastructure grants. The sources do not measure how much of Halifax's output depends on these projects, and the provincial budget says only that its outlook is sensitive to assumptions about major project spending; this is a reading of the sources, not a finding.

    What to watch

    Historical context

    The municipality's staff report and presentation set out a three-year strategy for 2027 to 2030, with a framework to be drafted in November 2026 and Council approval in March 2027. Statistics Canada's annual population estimates, the next Halifax Index, and Tourism Nova Scotia and the Port of Halifax's annual releases would show whether international-student and port volumes recover.

    Evidence: Halifax Regional Municipality: Development of the Next Economic Strategy (staff report, CPED Standing Committee); Halifax Regional Municipality / Halifax Partnership: Halifax's Economic Strategy: Progress Update (presentation to CPED, June 18, 2026)

    Not covered by the sources cited, and so not described here: the Nova Scotia Growth Plan, a Halifax-only list of the largest employers, wages by industry for the metropolitan area, Centre Plan outcomes, Africville, Wind West effects on Halifax, and the Bank of Canada or Conference Board regional outlooks.

    Prepared with AI assistance.

    Follow the relationships

    Sources for this section (3 datasets, 22 documents)

    Data

    Documents cited

    Each dataset is used under its licence; attribution and series-level detail are in each chart’s “About this data” panel. Limitations: Every explanation here is a statement by the named organisation. Several sources are promotional (Invest Nova Scotia describes Nova Scotia, not Halifax; Irving Shipbuilding is a company; Burnside figures are the municipality's own marketing), and are labelled as such. Port volumes come from a trade-press republication of the port's release, not from the Port of Halifax itself, and the Halifax Index is cited from its press release, not the full Index. Census industry shares are for 2021 and describe jobs by place of work. Halifax Index and municipal staff-report statements use the Index's definition of Halifax, which may differ from the census metropolitan area. No Halifax-specific employer ranking, wage series, university economic-impact study or Nova Scotia Growth Plan text is cited. Forecasts are the publishers' and are not Northline forecasts.
    1 · Labour market

    Is Halifax's labour market keeping pace with the large metropolitan areas?

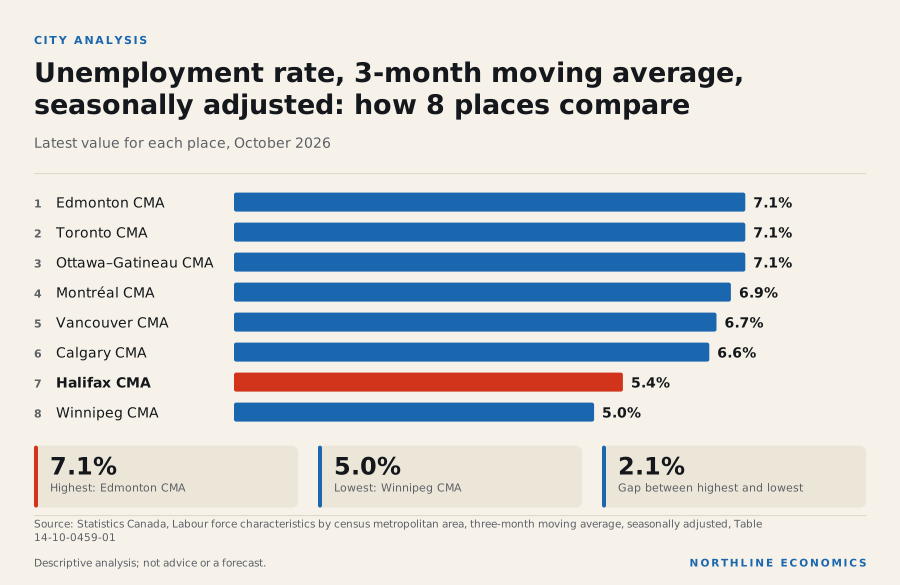
    In October 2026, Halifax had 303 thousand workers, employment had changed 3.4% over the year and unemployment was 5.4%, with 65.0% of adults employed

    Graphic: Unemployment rate, 3-month moving average, seasonally adjusted: how…Unemployment rate, 3-month moving average, seasonally adjusted: how 8 places compare. Edmonton CMA 7.1%;…

    What happened

    Halifax's seasonally adjusted unemployment rate (three-month average) was 5.4% in October 2026, from 5.8% a year earlier. For comparison, Winnipeg's was 5.0%; among the six large metropolitan areas: Calgary's 6.6%, Edmonton's 7.1%, Toronto's 7.1%, Vancouver's 6.7%, Montréal's 6.9%, Ottawa–Gatineau's 7.1%. Employment of 303 thousand changed 3.4% over the year, against 6.2% in Calgary, 1.9% in Toronto and 1.2% in Vancouver.

    Unemployment rate: eight more metropolitan areas

    Percent, three-month moving average, seasonally adjusted (same table as the six large cities).

    Chart loads when it comes into view.

    Latest values: Halifax CMA 5.4 (2026-10); Winnipeg CMA 5 (2026-10); Québec CMA 4.5 (2026-10); Hamilton CMA 7.6 (2026-10); and 4 more in the data table.

    Employment, indexed: Halifax, other mid-size cities and the six large cities

    Three-month moving average, seasonally adjusted; start of period = 100.

    Chart loads when it comes into view.

    Latest values: Halifax CMA 303,200 (2026-10); Winnipeg CMA 523,000 (2026-10); Québec CMA 478,100 (2026-10); Hamilton CMA 444,600 (2026-10); and 10 more in the data table.

    The participation rate is 68.7% and the employment rate 65.0%, against 66.7% in Calgary, 62.2% in Toronto and 63.4% in Vancouver. Among the eight smaller metropolitan areas covered here (Winnipeg, Halifax, Québec, Hamilton, Kitchener, London, Saskatoon, Regina) its employment rate ranks 3rd of 8.

    Employment rate: eight more metropolitan areas

    Percent of the population aged 15 and over, three-month moving average, seasonally adjusted.

    Chart loads when it comes into view.

    Latest values: Halifax CMA 65 (2026-10); Winnipeg CMA 64.3 (2026-10); Québec CMA 63.4 (2026-10); Hamilton CMA 60.7 (2026-10); and 4 more in the data table.

    Participation rate: Halifax, other mid-size cities and the six large cities

    Percent of the population aged 15 and over, three-month moving average, seasonally adjusted.

    Chart loads when it comes into view.

    Latest values: Halifax CMA 68.7 (2026-10); Winnipeg CMA 67.8 (2026-10); Québec CMA 66.4 (2026-10); Hamilton CMA 65.7 (2026-10); and 10 more in the data table.

    By industry, Statistics Canada's annual Labour Force Survey estimates (table 14-10-0468-01, annual averages, not seasonally adjusted) put average employment in Halifax at 294 thousand in 2025, a change of 1.1% on the year before and of 20.4% since 2019. Goods-producing industries account for 14.5% of employed persons and services-producing industries for 85.4%; among the individual groups, health care and social assistance 14.8%, wholesale and retail trade 13.8% and public administration 8.4% of employment. The table counts people by the industry of their main job and by where they live, so it is a measure of employment, not of output, wages or the number of businesses. Estimates for a single industry group in one metropolitan area come from a small survey sample and are less steady than the total: Statistics Canada suppresses some cells, and the table is annual, so a one-year move in a small group should not be read as a trend. No sampling-error range is held with these series, so none is quoted; the monthly metropolitan rates above are three-month averages and are noisier than the annual figures. Wages for the metropolitan area are not held here; the Statistics Canada wage tables used cover provinces and Canada.

    Employment in Halifax: goods and services, indexed

    Annual average of employed persons, Labour Force Survey (Statistics Canada table 14-10-0468-01); first year shown = 100. Goods-producing and services-producing sectors against all industries. Annual estimates, not seasonally adjusted.

    Chart loads when it comes into view.

    Latest values: All industries 293,900 (2025); Goods-producing sector 42,700 (2025); Services-producing sector 251,100 (2025).

    Employment by industry group in fourteen metropolitan areas, 2025

    Share of employed persons living in each metropolitan area who work in each group (annual average, Labour Force Survey; the survey classifies jobs by the industry of the person’s main job, not by where the employer sits). Single-sector estimates for one metropolitan area rest on small samples; a city is left out of a chart where Statistics Canada suppresses the estimate. Shares are computed by this project from Statistics Canada table 14-10-0468-01.

    Chart loads when it comes into view.

    Top values: Kitchener–Cambridge–Waterloo 25.3%; Edmonton 20.8%; Calgary 20%.

    Why it happened

    The data show where Halifax stands, not why. Since the end of 2019 employment has changed 24.1% in Halifax, 16.4% in Winnipeg, 27.1% in Calgary and 10.9% in Toronto; the data held here cannot say why those paths differ.

    Historical context

    Statistics Canada reports that in October employment fell in Alberta and Prince Edward Island and rose in British Columbia and Newfoundland and Labrador. That is the provincial picture; it does not name Nova Scotia and is not a statement about Halifax.

    Evidence: Statistics Canada: Labour Force Survey, October 2026 (The Daily)

    Why it matters

    Jobs matter for household income and housing demand. The employment rate says more than the unemployment rate about how much of the adult population is working, because people who stop looking for work leave the unemployment count.

    History

    Over ten years Halifax's unemployment rate has averaged 6.3%, with a high of 12.1% in June 2020 and a low of 4.5% in June 2022. The Labour Force Survey series for the metropolitan area start in 2011 for employment and participation (earlier months are not held).

    Across geographies

    Halifax's rate minus Winnipeg's is 0.4 percentage points. As context, on a different definition (monthly, province-wide), Nova Scotia's unemployment rate is 6.2% and Canada's 6.7%; these must not be read against the metropolitan three-month averages.

    What it influences

    Jobs matter for household income and housing demand in the region. No link from Halifax's employment to another variable is measured here.

    Risks

    Not assessed: the exposure of Halifax's employment to particular industries or to US demand over time, beyond what the annual industry employment shown above describes; that table does not measure exposure to US demand.

    What to watch

    Statistics Canada's Labour Force Survey (release dates in the calendar).

    Prepared with AI assistance.

    Follow the relationships

    Sources for this section (3 datasets, 1 documents)

    Data

    Documents cited

    Each dataset is used under its licence; attribution and series-level detail are in each chart’s “About this data” panel. Limitations: Metropolitan rates are three-month moving averages from the Labour Force Survey and are noisier than national figures. They are not comparable with provincial or national monthly rates and are never charted with them. Wages and demographic breakdowns for the metropolitan area are not included; annual employment by industry group (Labour Force Survey, annual averages, with suppressed cells and small-sample variability) is held, but it is not seasonally adjusted and is not output or wages; the 2021 Census industry mix is in a separate section.

    2 · Prices and inflation

    How fast are prices rising in Halifax?

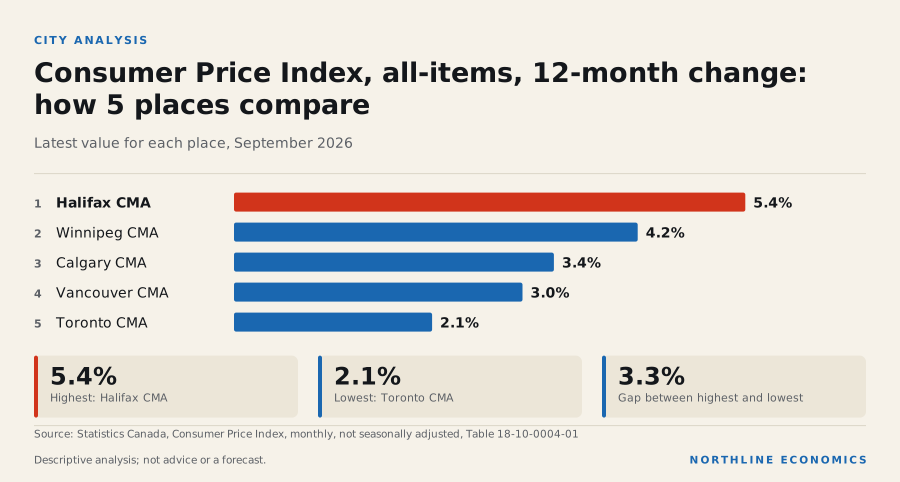
    Halifax's consumer prices were 5.4% higher in September 2026 than a year earlier, against 3.1% for Canada

    Graphic: Consumer Price Index, all-items, 12-month change: how 5 places compareConsumer Price Index, all-items, 12-month change: how 5 places compare. Halifax CMA 5.4%; Winnipeg CMA…

    What happened

    Halifax's consumer prices were 5.4% higher in September 2026 than a year earlier (from 2.8% a year before), against 4.2% in Winnipeg, 3.4% in Calgary, 2.1% in Toronto and 3.0% in Vancouver, and 3.1% for Canada.

    Consumer price inflation: Halifax, other mid-size cities and the six large cities

    12-month change in the all-items CPI, the mid-size cities with a published index against the six large cities (derived from the index). Ottawa–Gatineau is the Ontario part only.

    Chart loads when it comes into view.

    Latest values: Halifax CMA 5.37 (2026-09); Winnipeg CMA 4.24 (2026-09); Québec CMA 3.3 (2026-09); Saskatoon CMA 3.09 (2026-09); and 7 more in the data table.

    Why it happened

    Historical context

    Statistics Canada reports that national headline inflation accelerated in September, led by gasoline, and that excluding gasoline the CPI rose less. Only the city's all-items index is held here, so this report cannot say what lies behind Halifax's rate. For the province, the same release says that excluding energy, inflation was higher in Nova Scotia than nationally, and that the September increase in fuel oil prices had a greater impact on consumers in Atlantic Canada, where fuel oil is more widely used.

    Evidence: Statistics Canada: The Daily: Consumer Price Index, September 2026

    Why it matters

    The CPI measures changes in prices, not their level, so a rate of change says nothing about how expensive the city is. A rate that is falling or rising against its own recent past tells more than a comparison with one other city: a year earlier Halifax's rate was 2.8%. Because the index covers all items together, it cannot show whether housing, food or energy explains a difference.

    History

    Halifax's rate has averaged 2.9% over ten years and peaked at 9.1% in June 2022.

    Across geographies

    Halifax's rate minus Canada's is 2.3 percentage points, and minus Winnipeg's is 1.1 percentage points, both computed before the rates are rounded.

    What it influences

    Inflation bears on wage bargaining, the policy rate and mortgage renewals; those links are national and not measured for the city.

    Risks

    The risks that published sources attribute to Halifax specifically are in the local-economy section of this page; the national risks are energy prices and tariffs (see the Canada report).

    What to watch

    Statistics Canada's monthly Consumer Price Index release (calendar).

    Prepared with AI assistance.

    Follow the relationships

    Sources for this section (1 datasets, 1 documents)

    Data

    Documents cited

    Each dataset is used under its licence; attribution and series-level detail are in each chart’s “About this data” panel. Limitations: The metropolitan index is held here for all items only: Statistics Canada also publishes shelter and its parts for Halifax (not food or energy), but they are not included here. The CPI measures changes in prices, not levels.

    3 · Population and growth

    How quickly is Halifax growing, and where is the growth coming from?

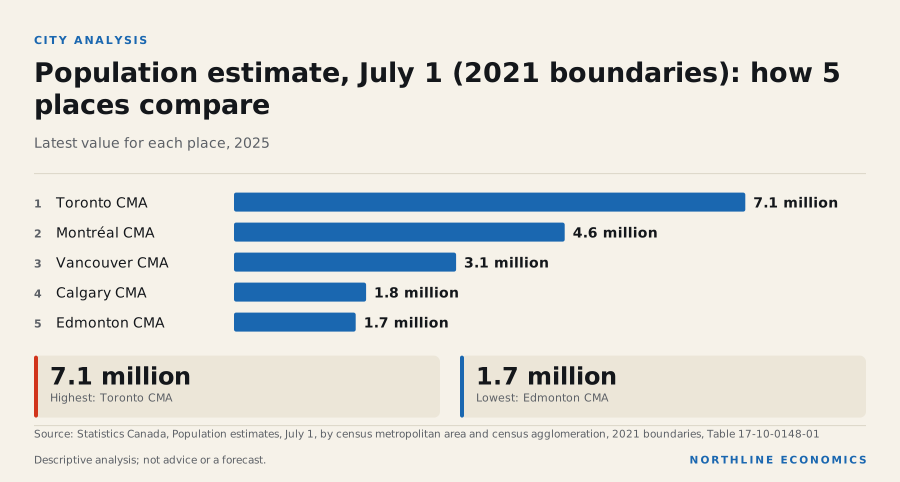
    Halifax's population grew 1.6% in the year to July 2025; Nova Scotia's grew 0.8% in the more recent four quarters to 1 July 2026

    Graphic: Population estimate, July 1 (2021 boundaries): how 5 places comparePopulation estimate, July 1 (2021 boundaries): how 5 places compare. Toronto CMA 7.1 million; Montréal CMA…

    What happened

    The Halifax metropolitan area had 545 thousand residents on July 1, 2025, 1.6% more than a year earlier. Over five years it grew 15.0%, against 11.6% in Winnipeg, 20.1% in Calgary and 9.5% in Toronto. In the latest year the growth rates were 2.9% in Calgary, 3.1% in Edmonton, 0.0% in Toronto, 0.2% in Vancouver and 0.5% in Montréal. Among the eight smaller metropolitan areas covered here it ranks 6th of 8 by population.

    Population: eight more metropolitan areas, indexed

    July 1 estimates, 2021 boundaries; start of period = 100.

    Chart loads when it comes into view.

    Latest values: Halifax CMA 544,800 (2025); Winnipeg CMA 951,800 (2025); Québec CMA 903,600 (2025); Hamilton CMA 871,100 (2025); and 4 more in the data table.

    Why it happened

    Historical context

    Statistics Canada reports that from July 1, 2025, to July 1, 2026, national population growth continued to slow to its lowest since 1944/1945, that the number of non-permanent residents fell by the largest annual amount on record with study-permit holders accounting for most of the decline, and that Ontario, Quebec and British Columbia, which receive the largest shares of international migrants, grew slowest among the provinces. The same release places Nova Scotia among the provinces whose population grew faster than the country as a whole; it does not discuss Halifax.

    Evidence: Statistics Canada: The Daily: Canada's population estimates, second quarter 2026

    Historical context

    Statistics Canada's January 2026 release on subprovincial estimates reports that the population growth rate from July 2024 to July 2025 was lower for all 41 census metropolitan areas than in the previous year. It reports that in Atlantic Canada large urban centres had seen higher gains from interprovincial migration since 2018/2019, but those have moderated or become net losses.

    Evidence: Statistics Canada: The Daily: Canada's population estimates: Subprovincial areas, 2025

    In the demographic year that began in July 2024, the Halifax metropolitan area recorded 4,249 births and 4,011 deaths, 8,207 immigrants, a net change of -788 non-permanent residents, net interprovincial migration of 1,098 and net intraprovincial migration (movement to and from the rest of the province) of 498. The year before, immigrants numbered 11 thousand and the net change in non-permanent residents was 5,093. Net non-permanent residents averaged 1,946 a year over the latest five demographic years.

    Where Halifax's population change came from

    Persons over the twelve months from July 1 of the year shown (so 2024 is July 2024 to June 2025), 2021 boundaries. Net movements: negative = net outflow. Statistics Canada table 17-10-0149-01.

    Chart loads when it comes into view.

    Latest values: Immigrants 8,207 (2024); Net non-permanent residents -788 (2024); Net interprovincial migration 1,098 (2024); Net intraprovincial migration 498 (2024).

    Why it matters

    Population growth adds workers and households. A fast-growing metropolitan area can need more housing, schools and services, and it also gains consumers. Over five years Halifax's growth was 15.0%.

    History

    Over ten years Halifax's population grew 26.0%, and since 2001 it has grown 39.1%. The components of change are available from 2001.

    Across geographies

    The provincial population grew 0.8% in the four quarters to 1 July 2026; net interprovincial migration for Nova Scotia over the four quarters to Q2 2026 was 3,863. The metropolitan area's own net interprovincial migration is among the components above.

    What it influences

    Population growth bears on housing demand, labour supply and public service needs. Those links are national and not measured for the city.

    Risks

    Hypothesis, not established

    The 2026 fall in non-permanent residents could reduce demand for rental and starter housing in cities that host many international students. The metropolitan change in non-permanent residents to June 2025 is among the components above; it does not cover the 2026 fall.

    Evidence: Statistics Canada: The Daily: Canada's population estimates, second quarter 2026

    What to watch

    Statistics Canada's next annual metropolitan population estimates and quarterly provincial estimates.

    Prepared with AI assistance.

    Follow the relationships

    Sources for this section (4 datasets, 2 documents)

    Data

    Documents cited

    Each dataset is used under its licence; attribution and series-level detail are in each chart’s “About this data” panel. Limitations: City population is an annual July 1 estimate on 2021 boundaries and ends a year before the latest provincial figures. Components of change come from a separate table (17-10-0149-01) whose demographic year runs from July 1 to June 30; each is labelled by the year in which that year starts, so the latest covers July 2024 to June 2025. They describe how much each component contributed and do not explain why. Net emigration, returning emigrants and the table's residual are not shown, so the components shown need not add to the total change.

    4 · Housing supply and prices

    Is Halifax building homes, and what is happening to new-home prices?

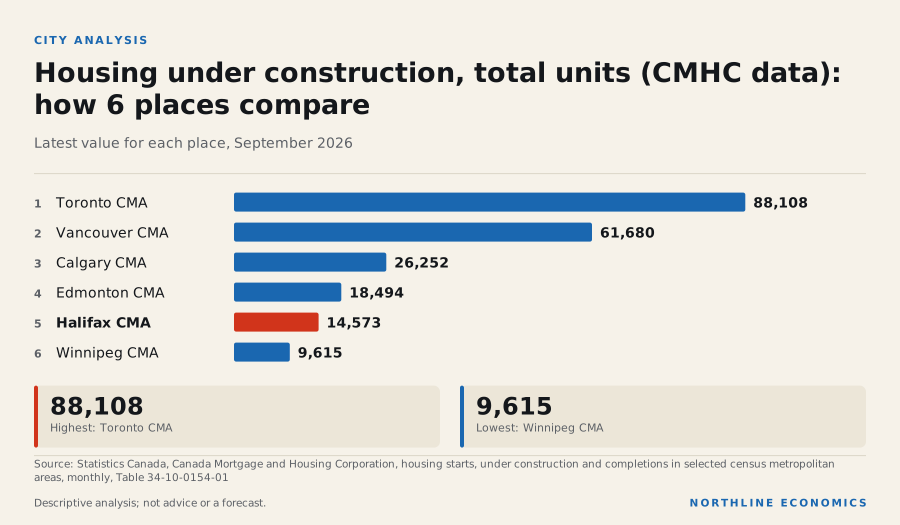
    Halifax's new-home prices changed +0.6% in the twelve months to September 2026, with 14,573 homes under construction and 5,107 started over the twelve months to September 2026

    Graphic: Housing under construction, total units (CMHC data): how 6 places c…Housing under construction, total units (CMHC data): how 6 places compare. Toronto CMA 88,108; Vancouver…

    What happened

    Halifax started 5,107 homes over the past twelve months and completed 3,445. At the end of September 2026, 14,573 were under construction, 12.7% against a year earlier (Winnipeg 9,615, Toronto 88,108, Vancouver 61,680, Calgary 26,252).

    Housing starts (12-month total): Halifax, other mid-size cities and the six large cities

    Total units started over the previous 12 months; CMHC data distributed by Statistics Canada. Levels differ with city size.

    Chart loads when it comes into view.

    Latest values: Halifax CMA 5,107 (2026-09); Winnipeg CMA 6,920 (2026-09); Québec CMA 9,293 (2026-09); Hamilton CMA 2,334 (2026-09); and 10 more in the data table.

    Housing under construction: Halifax, other mid-size cities and the six large cities

    Units under construction at month end, total units; CMHC data distributed by Statistics Canada.

    Chart loads when it comes into view.

    Latest values: Halifax CMA 14,570 (2026-09); Winnipeg CMA 9,615 (2026-09); Québec CMA 11,520 (2026-09); Hamilton CMA 6,733 (2026-09); and 10 more in the data table.

    The New Housing Price Index for Halifax is 128.0, 0.6% on a year ago and 8.7% since February 2022. Winnipeg's index changed 2.1% over the year, Vancouver's -2.1% and Toronto's -4.9%. Index levels are not comparable across cities because each is indexed to its own base.

    New housing price index, rebased: Halifax, other mid-size cities and the six large cities

    Each city is indexed to its own base, so levels are not comparable; start of period = 100.

    Chart loads when it comes into view.

    Latest values: Halifax CMA 128 (2026-09); Winnipeg CMA 148.6 (2026-09); Québec CMA 144.2 (2026-09); Hamilton CMA 106.4 (2026-09); and 10 more in the data table.

    The value of building permits (all types, seasonally adjusted, current dollars) over the twelve months to August 2026 was C$1.8 billion, -20.9% on the twelve months before; the series starts in 2018.

    Value of building permits (12-month total): Halifax, other mid-size cities and the large cities

    Seasonally adjusted, current dollars, all types of building and work; 12-month total. Ottawa–Gatineau is published only for its Ontario and Quebec parts and is not shown.

    Chart loads when it comes into view.

    Latest values: Halifax CMA 1.769 (2026-08); Winnipeg CMA 3.714 (2026-08); Québec CMA 3.917 (2026-08); Hamilton CMA 2.219 (2026-08); and 9 more in the data table.

    In the October 2025 Rental Market Survey the average rent for a two-bedroom unit in purpose-built rental structures of three or more units in Halifax was C$1,828 a month, 7.0% higher than a year earlier (CMHC's same-sample figure, for structures surveyed in both years, is 6.7%) and 45.8% higher than five years earlier, ranking 4th of 14 among fourteen cities (highest = 1); the same measure was C$1,908 in Calgary, C$2,045 in Toronto, C$2,364 in Vancouver. The vacancy rate was 2.6%, from 2.1% a year earlier (against 2.6% in Regina, 4.9% in Calgary, 3.0% in Toronto, 3.7% in Vancouver). The table covers purpose-built rental structures only; condominium, house and basement-suite rentals, and the asking rents on new listings, are not in it.

    Average rent, two-bedroom units: fourteen cities

    Current dollars per month, October survey each year; row and apartment structures of three units and over only (condominium, house and basement-suite rentals are not in this table). CMHC data distributed by Statistics Canada.

    Chart loads when it comes into view.

    Latest values: Halifax CMA 1,828 (2025); Calgary 1,908 (2025); Edmonton 1,598 (2025); Toronto 2,045 (2025); and 10 more in the data table.

    Rental vacancy rate: fourteen cities

    Percent of units vacant, October survey each year; row and apartment structures of three units and over. CMHC data distributed by Statistics Canada.

    Chart loads when it comes into view.

    Latest values: Halifax CMA 2.6 (2025); Calgary 4.9 (2025); Edmonton 3.8 (2025); Toronto 3 (2025); and 10 more in the data table.

    Why it happened

    The data show how much is being built and what is happening to new-home prices; they do not separate demand, land and construction costs, interest rates and incomes. Posted mortgage rates are national. Since the first week of January 2026 the posted five-year rate has changed by +0.10 percentage points and the posted one-year rate by -0.35 percentage points, to 6.19% and 5.49% in the week of 28 October 2026 (see the Canada report).

    Interpretation

    CMHC's national assessment is that supply is not keeping up with what is needed for affordability; the data held here cannot say how far that holds for Halifax specifically.

    Evidence: Canada Mortgage and Housing Corporation: Housing starts and construction data, September 2026; Canada Mortgage and Housing Corporation: Fall 2026 Housing Supply Report

    Historical context

    CMHC's 2025 Rental Market Report says Halifax's vacancy increase was driven by slower migration and steady growth in housing supply in recent years, that migration slowed because of limits on non-permanent residents, especially international students, and tighter immigration policies, and that higher provincial rent guidelines helped drive rent growth in Montréal and Halifax. These are CMHC's stated reasons; the data held here do not test them.

    Evidence: Canada Mortgage and Housing Corporation: Rental Market Report 2025: major centres (web edition)

    Why it matters

    Housing is a large household expense. New-home prices are one part of the picture: resale prices are not included, and the rent figures above cover purpose-built rental structures only.

    History

    The monthly peak of units under construction in the past ten years was 14,751 in July 2026, and the lowest was 3,737 in March 2017.

    Housing completions (12-month total): Halifax, other mid-size cities and the six large cities

    Units completed over the previous 12 months, total units; CMHC data distributed by Statistics Canada.

    Chart loads when it comes into view.

    Latest values: Halifax CMA 3,445 (2026-09); Winnipeg CMA 5,392 (2026-09); Québec CMA 6,607 (2026-09); Hamilton CMA 2,456 (2026-09); and 10 more in the data table.

    Across geographies

    On the comparison with the large cities, units under construction changed 12.7% in Halifax, 18.9% in Winnipeg, -4.2% in Toronto, -2.3% in Vancouver and 4.0% in Edmonton over the twelve months to September 2026. Counts depend on city size and are not rates per person.

    What it influences

    The Bank of Canada describes a link between mortgage costs and housing, and CMHC a link between supply and affordability; neither is estimated for Halifax.

    Risks

    Historical context

    CMHC's deputy chief economist said a key risk for Canada is not building enough during this period of softening housing markets, and that affordability gains since 2023 will be difficult to sustain unless construction rises.

    Evidence: Canada Mortgage and Housing Corporation: Housing starts and construction data, September 2026

    What to watch

    CMHC's monthly starts, Statistics Canada's New Housing Price Index and building permits (release dates in the calendar), and the Bank of Canada's next announcement on 9 December 2026.

    Prepared with AI assistance.

    Follow the relationships

    Sources for this section (7 datasets, 3 documents)

    Data

    Documents cited

    Each dataset is used under its licence; attribution and series-level detail are in each chart’s “About this data” panel. Limitations: Starts, completions and units under construction are CMHC counts for the metropolitan area (all unit types). The New Housing Price Index covers new homes only; resale prices are not included, and rents are the October Rental Market Survey for purpose-built rental structures only. Monthly starts and completions are volatile and are shown as twelve-month sums where compared. Building permit values are in current dollars, seasonally adjusted, and are available from 2018. CMHC's supply-gap estimate is not recorded for this city in the sources held, so none is quoted.

    5.5 · Industry structure (2021 Census)

    What does Halifax do for a living?

    In the 2021 Census 204 thousand jobs were located in Halifax; health care and social assistance was the largest sector at 14.7% of jobs

    What happened

    In the 2021 Census, 204 thousand jobs were located in the Halifax metropolitan area (people who worked at home or had a usual workplace there; people with no fixed workplace address are not in the table). The three largest sectors were Health care and social assistance (14.7% of jobs), Retail trade (11.9%) and Public administration (11.8%).

    Measured as its share of jobs divided by the six large metropolitan areas' combined share (among sectors that make up at least one fiftieth of Halifax's jobs), the sector in which Halifax stood furthest above them was Public administration: 11.8% of its jobs, against 4.2% in Calgary, 8.2% in Edmonton, 4.6% in Toronto, 4.9% in Vancouver, 5.3% in Montréal, 25.7% in Ottawa–Gatineau. The ranking is fixed to these 2021 Census figures.

    Jobs by industry sector in six metropolitan areas, 2021 Census

    Share of jobs located in each metropolitan area (persons who worked at home or had a usual place of work there; people with no fixed workplace address are not in the table), May 2021 reference week, pandemic conditions. Industry structure at one date, not current conditions. Shares are computed by this project from the Census counts.

    Chart loads when it comes into view.

    Top values: Edmonton 6%; Calgary 4.9%; Vancouver 4.2%.

    Why it happened

    Not assessed. The table counts jobs by sector at one date and says nothing about why a metropolitan area has the mix it has. Attributed descriptions of Halifax's industry structure are in the local-economy section of this page.

    Why it matters

    The industry mix shows what a local economy does for a living, which bears on how it is exposed to changes in demand, prices and policy. It does not measure output, wages or how the economy is performing; those need other tables.

    History

    Not available from this table: the Census is taken every five years and the platform holds only the 2021 reference week (May 2021). Annual industry employment for the metropolitan area comes from the Labour Force Survey and is in the labour section of this page.

    Across geographies

    The metropolitan areas come from one table with one definition, so the shares can be compared with one another. They are not comparable with provincial Labour Force Survey industry shares, which use a different survey, year and definition. Nova Scotia's provincial industry mix is on its province page.

    What it influences

    Not assessed. No relationship in the recorded graph links the metropolitan industry mix to another variable.

    Risks

    Historical context

    The reference week was in May 2021, during public-health restrictions: Statistics Canada named retail trade, accommodation and food services, and information, culture and recreation among the industries most affected, and said working from home remained an important adaptation. The data are more than five years old and cannot show what has changed since.

    Evidence: Statistics Canada: The Daily: Labour Force Survey, May 2021

    What to watch

    The release of 2026 Census results on industry for metropolitan areas. No release date for them is in the calendar this site holds, and none is assumed.

    Prepared with AI assistance.

    Follow the relationships

    Sources for this section (1 datasets, 1 documents)

    Data

    Documents cited

    Each dataset is used under its licence; attribution and series-level detail are in each chart’s “About this data” panel. Limitations: Census jobs are counted by place of work in one reference week in May 2021, during public-health restrictions; people with no fixed workplace address are not in the table. The shares are of jobs located in the area, not of residents' employment, and are not comparable with Labour Force Survey industry shares.

    6 · National and global connections

    How do national and global conditions reach Halifax?

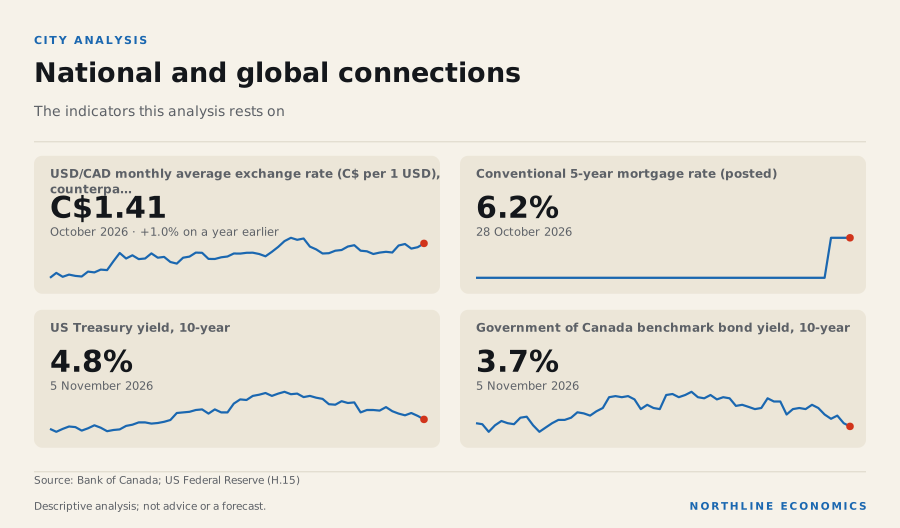
    Most recorded connections that reach Halifax are provincial or national: Nova Scotia's exports to the United States were 69% of its goods exports in 2025

    Graphic: National and global connectionsNational and global connections. USD/CAD monthly average exchange rate (C$ per 1 USD), counterpa… C$1.41…

    What happened

    Most recorded connections that reach Halifax are provincial or national. Nova Scotia's exposure to the United States is 69% of its goods exports in 2025 (total domestic goods exports C$6.6 billion), and energy products are 1% of that total; the national export shares in 2025 were 72% to the United States and 4.5% to China.

    Oil prices and metropolitan employment are compared in the relationship graph only for Calgary, Edmonton and Toronto; Halifax is not compared.

    Why it happened

    Not assessed. Trade and investment links that published sources describe for Halifax are in the local-economy section of this page; no city-level trade data are held.

    Why it matters

    The currency, interest rates and trade partners that matter for Halifax are covered at national level in the Global report: one US dollar cost an average of C$1.4135 in October 2026; Canada's posted five-year mortgage rate was 6.19% in the week of 28 October 2026, and it rose 0.10 percentage points over the year to then. The US ten-year Treasury yield was 4.84% on 5 November 2026 and Canada's ten-year yield 3.67% on 5 November 2026; how much of any move in either reaches Halifax's housing market is not measured here.

    History

    Not assessed.

    Across geographies

    Interpretation

    Bond yields and the posted five-year mortgage rate tend to move together, which matters for housing; the effect on Halifax is not measured.

    Evidence: relationship: Government of Canada bond yields and Prime and posted mortgage rates

    What it influences

    Three chains bear on Halifax: US trade measures to exports (hypotheses), rates to mortgage costs and housing (documented nationally) and immigration policy to population and rents (documented nationally and, with no measured size, for the metropolitan area).

    Risks

    The risks that published sources attribute to this city specifically are in the local-economy section of this page; beyond those, see the national risks in the Canada report and the global risks in the Global report.

    What to watch

    The Bank of Canada's next announcement on 9 December 2026, tariff changes and Statistics Canada's monthly trade release (calendar).

    Prepared with AI assistance.

    Follow the relationships

    Sources for this section (4 datasets, 0 documents)

    Data

    Each dataset is used under its licence; attribution and series-level detail are in each chart’s “About this data” panel. Limitations: Provincial export shares are customs-basis goods only and are assigned to the province of origin. No city-level trade or investment data are held, and no oil-price or other correlation is estimated for this city.

    What is missing

    What this page does not cover

    Stated plainly rather than hidden.

    Data requirements

    Output and wages by industry for the metropolitan area
    Annual employment by industry group (Labour Force Survey, table 14-10-0468-01), the 2021 Census industry mix and total metropolitan GDP (annual, no industry detail) are now ingested. Output by industry for the metropolitan area is not, and no wage series for the metropolitan area is held: the open Statistics Canada wage tables cover provinces and Canada, not metropolitan areas.
    not covered
    Resale prices, rents outside purpose-built rental, and household incomes
    Resale data are licensed. Average rent and vacancy for purpose-built rental structures (CMHC Rental Market Survey) are ingested; condominium, house and basement-suite rents and household income tables for the metropolitan area are not.
    not covered
    Commercial real estate, office and industrial markets
    Proprietary sources; licensing required.
    not covered
    Infrastructure, major projects and public investment
    A project is listed only once its source, status and value have been checked.
    not covered
    Municipal finance and policynot covered
    Method and sources

    How this report is built

    Same pipeline, gates and editorial rules as every other page.

    Every number is a reference to a published, licence-checked series for the same geography (ca.ns.cma_halifax); metropolitan series are never mixed with provincial or national ones. Statistics Canada tables 14-10-0459-01 (labour), 18-10-0004-01 (CPI), 17-10-0148-01 (population), 34-10-0154-01 (starts, completions, under construction; CMHC data), 18-10-0205-01 (new housing price index), 34-10-0292-01 (building permits) and 16-10-0011-01 (manufacturing shipments, six large cities only), 17-10-0149-01 (components of population change), 34-10-0133-01 and 34-10-0130-01 (rents and vacancy, CMHC Rental Market Survey), 36-10-0468-01 (GDP at basic prices) 98-10-0492-01 (2021 Census jobs by industry) and 14-10-0468-01 (annual employment by industry group). Methodology and sources · Editorial policy.