GlobalCanadaCities

Atlas · YEG · Alberta

Edmonton

1,692,385 people, July 2025. Metropolitan area measures, beside the 13 other cities Northline covers.

Map of Canada with provincial boundaries. The 14 cities Northline covers are listed in the text.

Unemployment rateEdmonton among 14 cities

Measure
2021202220232024202520264.0%6.0%8.0%10.0%12.0%7.1%Toronto7.1%Edmonton6.7%Vancouver6.6%Calgary

Pin up to four cities

    Three-month moving average, seasonally adjusted. Statistics Canada, Labour Force Survey.

    Table view
    Latest value for each city.
    CityLatestPeriod
    London8.1%Oct 2026
    Hamilton7.6%Oct 2026
    Toronto7.1%Oct 2026
    Ottawa–Gatineau7.1%Oct 2026
    Edmonton7.1%Oct 2026
    Kitchener–Waterloo7.1%Oct 2026
    Montréal6.9%Oct 2026
    Vancouver6.7%Oct 2026
    Calgary6.6%Oct 2026
    Saskatoon5.9%Oct 2026
    Regina5.9%Oct 2026
    Halifax5.4%Oct 2026
    Winnipeg5.0%Oct 2026
    Québec4.5%Oct 2026

    Vital signs

    Edmonton in eight numbers

    Vital signs for Edmonton
    MeasureLatestPeriod and rank among 14 citiesContextTrend
    Unemployment rate7.1%Oct 2026, fifth highest of 14Alberta 7.3%, Canada 6.7% (monthly measures)
    Employment rate63.8%Oct 2026, seventh highest of 14
    Consumer prices, 12-month change3.5%Sep 2026, third highest of 11Alberta 3.6%, Canada 3.1%
    Population1,692,385July 2025
    Population growth3.1%Year to July 2025, highest of 14
    Housing starts, last 12 months19,055To Sep 2026, fifth highest of 14
    Average two-bedroom rentC$1,598October 2025, ninth highest of 14
    Rental vacancy rate3.8%October 2025, third highest of 14

    City figures are metropolitan-area measures. National and provincial unemployment rates are monthly, so they are close to but not the same measure as the three-month city averages.

    What it is built on

    Jobs by industry

    1. Health care and social assistance15.5% vs 13.5%
    2. Retail trade12.9% vs 11.6%
    3. Public administration8.2% vs 7.1%
    4. Professional and technical services8.1% vs 11.4%
    5. Educational services8.1% vs 8.3%
    6. Manufacturing6.4% vs 8.4%
    7. Construction6.0% vs 4.0%
    8. Accommodation and food5.5% vs 4.9%
    9. Mining, oil and gas1.8% vs 0.6%

    Share of jobs by place of work, 2021 Census. The tick marks the 14 cities combined. Total jobs counted: 569,630.

    See Edmonton’s skyline in the Field

    Rates and housing here

    Where the ripple reaches Edmonton

    A reading path through recorded links, not a forecast. Effects along a chain are never added or multiplied.

    Follow the ripple

    Where to go next

    ServicesGet a full profileA sourced profile of Edmonton for a lender, board or council. StudioOpen in StudioA workspace prepared from these measures, with the gaps stated.
    YEG · Edmonton CMA · city dashboard

    The Edmonton economy: what is driving it and what could change it
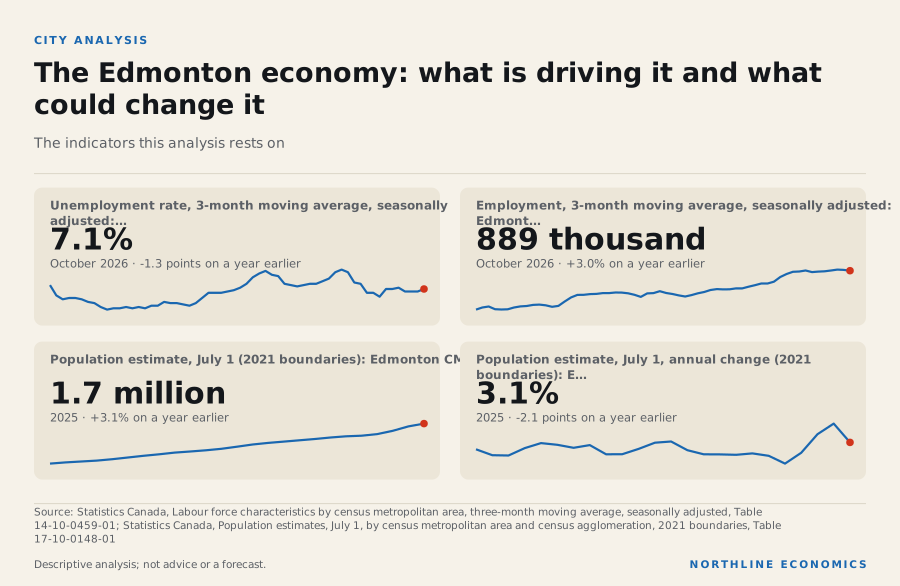
    Edmonton's employment in October 2026 was 3.0% higher than a year earlier, but the City of Edmonton reported that in the year to the second quarter one sector, health care and social assistance, accounted for almost all of the gain, while the metropolitan area's population grew faster than any other large city's in the year to July 2025. It does not cover wages by city or resale prices; the page lists what is missing.

    Analyze Edmonton in Intelligence Studio

    Opens a workspace prepared from the published Edmonton measures above, with the gaps stated.

    Edmonton versus Calgary in Studio → · Choose other places to compare →

    30 secondsRead the vital signs above; each measure links to its chart or section. Go to the indicators
    5 minutesRead the findings at the top, then the sourced story of what drives this economy. Go to the outlook
    20 minutesRead the local-economy section, then work through the charts and the relationships that reach the city. Go to the charts
    Edmonton at a glance

    What are the main things to know about Edmonton's economy right now?

    Edmonton is a high-participation, fast-growing, affordable market whose job growth trails Calgary's and whose manufacturing is mostly refined petroleum

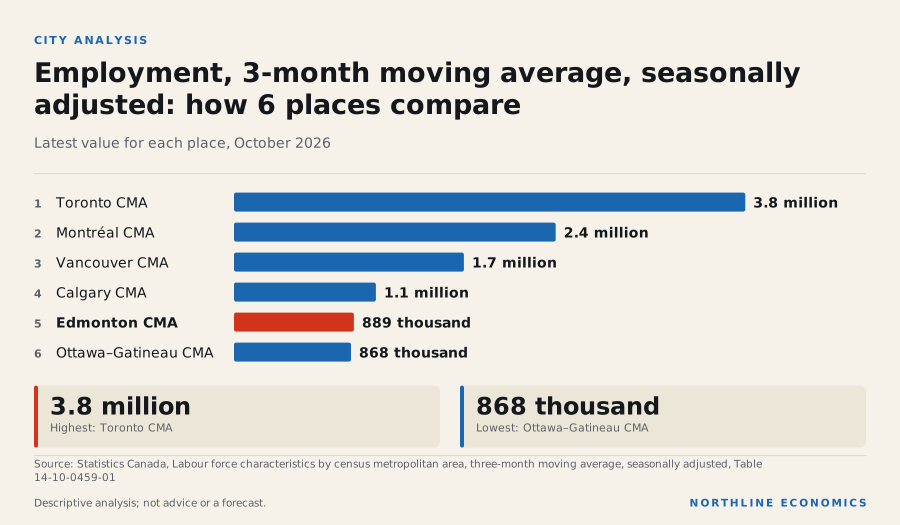
    Graphic: Employment, 3-month moving average, seasonally adjusted: how 6 plac…Employment, 3-month moving average, seasonally adjusted: how 6 places compare. Toronto CMA 3.8 million;…

    Edmonton among the six largest metros

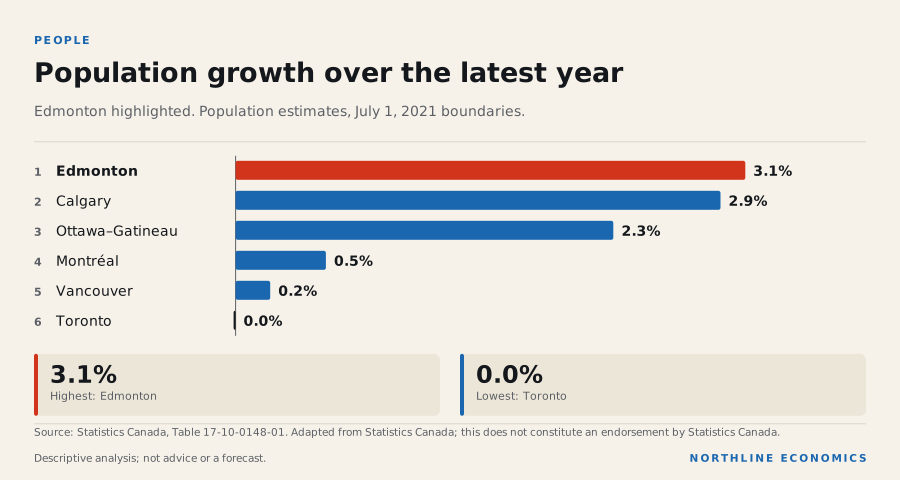
    Edmonton is growing faster than any of the other five metropolitan areas. The population rose 3.1% in the year to July 2025, and net interprovincial migration of 12 thousand persons was the largest of the six in the latest annual figure, ahead of Calgary's 11 thousand. Immigrants numbered 22 thousand and net non-permanent residents 8,972.

    Population growth over the latest yearPopulation growth over the latest year. Edmonton 3.1%; Calgary 2.9%; Ottawa–Gatineau 2.3%; Montréal 0.5%; Vancouver 0.2%; Toronto 0.0%.PEOPLEPopulation growth over the latest yearEdmonton highlighted. Population estimates, July 1, 2021 boundaries.1Edmonton3.1%2Calgary2.9%3Ottawa–Gatineau2.3%4Montréal0.5%5Vancouver0.2%6Toronto0.0%3.1%Highest: Edmonton0.0%Lowest: TorontoSource: Statistics Canada, Table 17-10-0148-01. Adapted from Statistics Canada; this does not constitute an endorsement by Statistics Canada.NORTHLINE ECONOMICSDescriptive analysis; not advice or a forecast.
    The data behind this graphic
    Population growth over the latest year
    ItemValue
    Edmonton3.1%
    Calgary2.9%
    Ottawa–Gatineau2.3%
    Montréal0.5%
    Vancouver0.2%
    Toronto0.0%

    Download this graphic (SVG, with source)

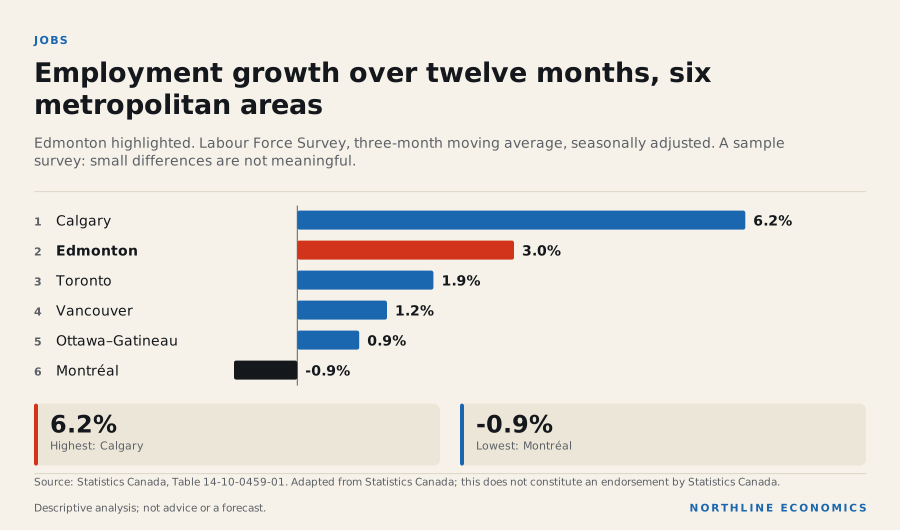
    Job growth is firm, but unemployment is not low. Employment is 3.0% above a year ago, second to Calgary, and the unemployment rate is 7.1%, down from 8.4% a year earlier though still above the rates in Calgary, Montréal and Vancouver, and level with Toronto's and Ottawa–Gatineau's at one decimal, the highest of the six. The employment rate of 63.8% is the second highest. These are sample-survey figures for one metropolitan area.

    Employment growth over twelve months, six metropolitan areasEmployment growth over twelve months, six metropolitan areas. Calgary 6.2%; Edmonton 3.0%; Toronto 1.9%; Vancouver 1.2%; Ottawa–Gatineau 0.9%; Montréal -0.9%.JOBSEmployment growth over twelve months, sixmetropolitan areasEdmonton highlighted. Labour Force Survey, three-month moving average, seasonally adjusted. A samplesurvey: small differences are not meaningful.1Calgary6.2%2Edmonton3.0%3Toronto1.9%4Vancouver1.2%5Ottawa–Gatineau0.9%6Montréal-0.9%6.2%Highest: Calgary-0.9%Lowest: MontréalSource: Statistics Canada, Table 14-10-0459-01. Adapted from Statistics Canada; this does not constitute an endorsement by Statistics Canada.NORTHLINE ECONOMICSDescriptive analysis; not advice or a forecast.
    The data behind this graphic
    Employment growth over twelve months, six metropolitan areas
    ItemValue
    Calgary6.2%
    Edmonton3.0%
    Toronto1.9%
    Vancouver1.2%
    Ottawa–Gatineau0.9%
    Montréal-0.9%

    Download this graphic (SVG, with source)

    Prices and housing

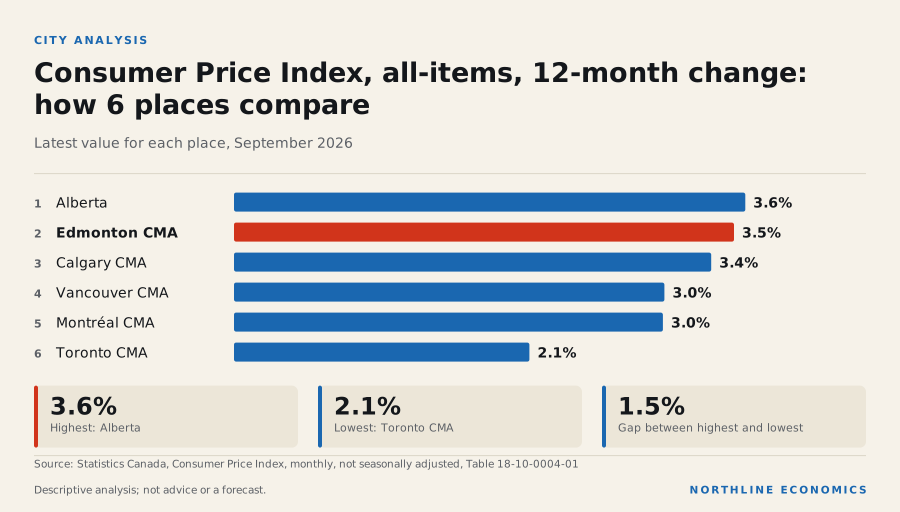
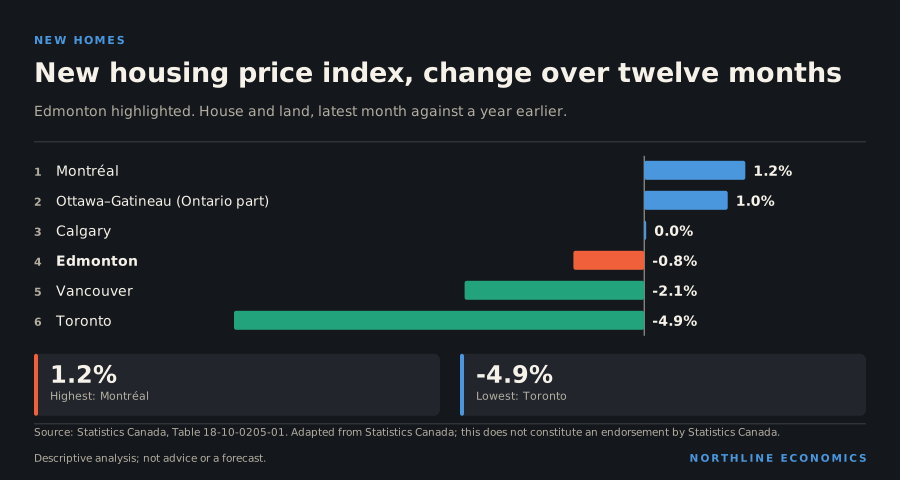
    Consumer prices rose 3.5% in the year to September 2026, the highest of the six, ahead of Calgary's 3.4%. New-home prices changed -0.8% in the twelve months to September 2026. Builders started 1,548 homes in the latest month and 18,494 are under construction, the fewest of the six in absolute terms, which reflects the size of the market as much as the pace. Two-bedroom rents in purpose-built buildings averaged C$1,598 in the October 2025 survey, well below Calgary's C$1,908, with a vacancy rate of 3.8%.

    New housing price index, change over twelve monthsNew housing price index, change over twelve months. Montréal 1.2%; Ottawa–Gatineau (Ontario part) 1.0%; Calgary 0.0%; Edmonton -0.8%; Vancouver -2.1%; Toronto -4.9%.NEW HOMESNew housing price index, change over twelve monthsEdmonton highlighted. House and land, latest month against a year earlier.1Montréal1.2%2Ottawa–Gatineau (Ontario part)1.0%3Calgary0.0%4Edmonton-0.8%5Vancouver-2.1%6Toronto-4.9%1.2%Highest: Montréal-4.9%Lowest: TorontoSource: Statistics Canada, Table 18-10-0205-01. Adapted from Statistics Canada; this does not constitute an endorsement by Statistics Canada.NORTHLINE ECONOMICSDescriptive analysis; not advice or a forecast.
    The data behind this graphic
    New housing price index, change over twelve months
    ItemValue
    Montréal1.2%
    Ottawa–Gatineau (Ontario part)1.0%
    Calgary0.0%
    Edmonton-0.8%
    Vancouver-2.1%
    Toronto-4.9%

    Download this graphic (SVG, with source)

    Output and industry

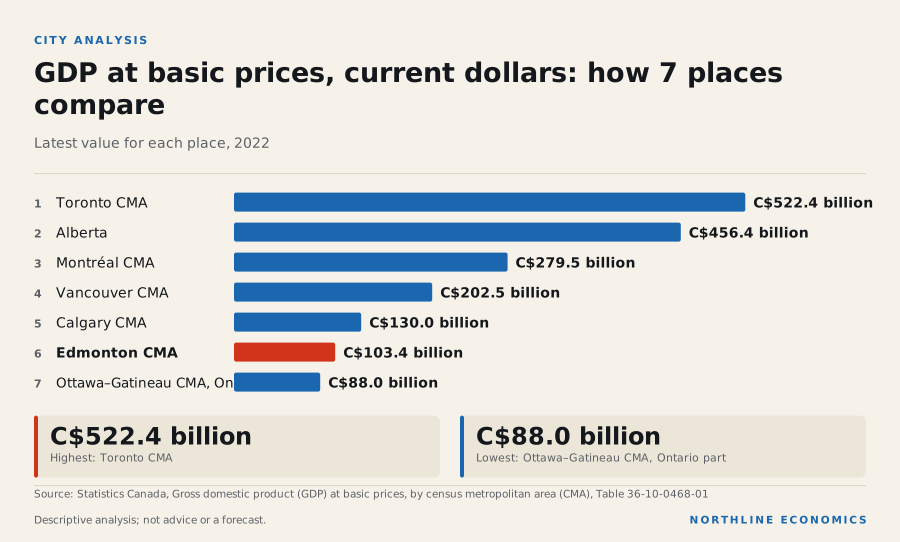
    Gross domestic product at basic prices was C$103.4 billion in 2022, 18.6% above five years earlier in current dollars, the smallest increase of the six. Manufacturing shipments in August 2026 were 46.6% above a year earlier, the largest increase of the six, a monthly figure that can reflect a few large producers.

    What it means for decisions

    For a business, Edmonton combines the fastest population growth with rents well below Calgary's and the highest inflation of the six. For a lender or builder, the vacancy rate and the pace of starts are the indicators that show whether supply is keeping up.

    What the data cannot say: they do not show wages, resale prices or the reasons for migration, and metropolitan survey estimates are sample-based. Nothing here is a forecast.

    1. Jobs: unemployment is 7.1%, down 1.3 percentage points in a year, and employment is up 3.0% against 6.2% in Calgary. Edmonton's employment rate is 2nd of 6 among the six large metros. Labour
    1. Prices: inflation is 3.5%, 1st of 6 among the six metros. The city index is held here for all items only, so the drivers are inferred from national and provincial data and not tested. Prices
    1. People: the population grew 3.1% in the year to July 2025, 1st of 6 among the six metros. Alberta grew 1.5% over the later four quarters to 1 July 2026. Population
    1. Housing: 18,494 homes are under construction, near a ten-year high, while new-home prices changed -0.8% in the twelve months to September 2026. CMHC finds no measurable supply gap in Edmonton. Housing
    1. Industry: petroleum and coal products are 58.8% of manufacturing shipments, which are up 46.6%. Current-dollar shipments follow product prices. Industry
    1. Connections: the same-month association between oil prices and Edmonton employment is only slightly stronger than for Toronto. The data cannot yet tell whether oil drives Edmonton's jobs. Connections

    Prepared with AI assistance.

    Follow the relationships

    Upcoming releases

    Sources for this section (11 datasets, 0 documents)

    Data

    Each dataset is used under its licence; attribution and series-level detail are in each chart’s “About this data” panel. Limitations: Metropolitan labour series are sample-survey estimates, three-month averages, and move more than provincial ones. Output is annual, in current dollars and about four years old; migration series cover the twelve months from July 1 of the year shown. Rankings compare only these six metropolitan areas. No wages, resale prices, commercial real estate or investment records are held for the metropolitan areas.

    0.5 · Output and economic size

    How large is the Edmonton economy, and how fast has it grown?

    Edmonton's economy was worth C$103.4 billion in 2022, 22.7% of Alberta's output

    Graphic: GDP at basic prices, current dollars: how 7 places compareGDP at basic prices, current dollars: how 7 places compare. Toronto CMA C$522.4 billion; Alberta C$456.4…

    What happened

    At basic prices and in current dollars, the Edmonton economy produced C$103.4 billion of output in 2022, the latest reference year in Statistics Canada's table, equal to 22.7% of Alberta's total of C$456.4 billion. Among the six large metropolitan areas it ranked 5th of 6 by size, but the one area it outranks is the Ontario part of Ottawa–Gatineau alone, so the rank does not compare whole metropolitan areas.

    Measured in current dollars, output was 54.6% higher in 2022 than in 2009 and 12.9% higher than in 2019. Alberta as a whole was 92.7% higher than in 2009 and 34.4% higher than in 2019. Over the same period since 2009 the other metropolitan areas grew 72.4% in Calgary, 85.0% in Toronto, 98.1% in Vancouver, 75.3% in Montréal and 61.1% in Ottawa–Gatineau (Ontario part).

    GDP at basic prices by metropolitan area, indexed

    Annual, current dollars (so prices and population growth are included); 2009 = 100. Statistics Canada table 36-10-0468-01; the reference year lags the present by about three and a half years. Ottawa–Gatineau is published in an Ontario and a Quebec part and is not shown.

    Chart loads when it comes into view.

    Latest values: Edmonton 103,400,000,000 (2022); Calgary 130,000,000,000 (2022); Toronto 522,400,000,000 (2022); Vancouver 202,500,000,000 (2022); and 2 more in the data table.

    Why it happened

    Not assessed. The table is in current dollars, so these changes include price increases, and it is not divided by population, so the figures do not separate growth in the number of people from growth in output per person. This section reports the data; attributed explanations of the differences are in the economic story and local-economy sections of this page.

    Why it matters

    GDP at basic prices is the broadest measure of local production that Statistics Canada publishes for metropolitan areas. It shows how large the local economy is and how its share of the provincial total compares, but not who earns the income, what is produced, or how the economy is doing now.

    History

    The series starts in 2009 and ends in 2022. A fall in output in any year in between would show in the chart; no year-by-year explanation is offered here.

    Across geographies

    Historical context

    The six series are comparable with each other because they come from one table with one definition and one price basis. The metropolitan totals sum, together with the areas outside metropolitan areas, to the provincial totals in the same table, which is why the provincial share above is exact for the reference year; the Statistics Canada footnote notes that there may be a lag between the metropolitan figures and the latest available provincial measures.

    Evidence: Statistics Canada: Table 36-10-0468-01: Gross domestic product (GDP) at basic prices, by census metropolitan area (CMA)

    What it influences

    Not assessed. No relationship in the recorded graph links metropolitan output to another variable.

    Risks

    The table ends in 2022 and describes nothing since; it cannot show the effects of recent changes in interest rates, trade policy, population or commodity prices on Edmonton.

    What to watch

    Statistics Canada's next release of table 36-10-0468-01. No release date for it is in the calendar this site holds, and none is assumed.

    Prepared with AI assistance.

    Follow the relationships

    Sources for this section (1 datasets, 1 documents)

    Data

    Documents cited

    Each dataset is used under its licence; attribution and series-level detail are in each chart’s “About this data” panel. Limitations: Annual, current dollars, GDP at basic prices; the latest reference year lags the present by almost four years. Not adjusted for inflation or population. Industry detail is not part of the table. Metropolitan areas follow Statistics Canada 2021 boundaries.

    0.5 · The Edmonton economy: what is driving it and what could change it

    Why is Edmonton growing faster than most large Canadian cities, which parts of that growth are broad, and what are the sources of risk?

    Edmonton's employment in October 2026 was 3.0% higher than a year earlier, but the City of Edmonton reported that in the year to the second quarter one sector, health care and social assistance, accounted for almost all of the gain, while the metropolitan area's population grew faster than any other large city's in the year to July 2025

    Graphic: The Edmonton economy: what is driving it and what could change itThe Edmonton economy: what is driving it and what could change it. Unemployment rate, 3-month moving…

    What happened

    Edmonton's seasonally adjusted unemployment rate was 7.1% in October 2026 and employment was 889 thousand, 3.0% on a year earlier. The metropolitan population grew 3.1% in the year to July 2025, the fastest of the six large metropolitan areas (1st of 6). Housing starts over the past twelve months were 19,055, and the average two-bedroom rent in purpose-built rental apartments was C$1,598 in the October 2025 survey with a vacancy rate of 3.8%.

    Why it happened

    Historical context

    The City of Edmonton's second-quarter 2026 Economic Update says health care and social assistance added 32,800 employees and almost singlehandedly accounted for the whole year-over-year employment increase of 34,100 in the metropolitan area, that employment growth had narrowed to fewer industries, and that recent gains were exclusively driven by people aged 25 to 54, whose participation rate hit a record. The same report says youth employment fell for a fifth straight quarter.

    Evidence: City of Edmonton: Q2 2026 Economic Update

    Historical context

    Statistics Canada reports that Edmonton, Moncton and Calgary had the fastest population growth among all census metropolitan areas from July 2024 to July 2025, that permanent immigration was the leading factor in those three, and that growth in non-permanent residents and gains from migration from other provinces also contributed significantly in Edmonton and Calgary. It adds that for the third consecutive year Edmonton and Calgary had the largest net gains from interprovincial migration among all the areas.

    Evidence: Statistics Canada: The Daily: Canada's population estimates: Subprovincial areas, 2025

    Historical context

    The Government of Alberta's first-quarter 2026-27 fiscal update says Alberta led the country in net interprovincial migration for the fifteenth consecutive quarter in the first quarter of 2026, and that the province's non-permanent resident population declined by more than 35,000 over the past year. That August figure was published before Statistics Canada's September 2026 estimates, which updated the non-permanent resident series from July 2021 onward and show a change for Alberta of -7,957 over the four quarters to Q2 2026; the two figures cover different periods and come from different releases. That is the provincial picture: the metropolitan area's own non-permanent resident change to June 2025 is in the population section.

    Evidence: Government of Alberta (Treasury Board and Finance): 2026-27 First Quarter Fiscal Update and Economic Statement; Statistics Canada: The Daily: Canada's population estimates, second quarter 2026

    Historical context

    The province says strong activity in the energy sector has been accompanied by a pickup in manufacturing and agriculture exports, and that progress on major projects is boosting investment and construction activity.

    Evidence: Government of Alberta (Treasury Board and Finance): 2026-27 First Quarter Fiscal Update and Economic Statement

    Historical context

    It adds that investment growth is increasingly being driven by major projects outside the resource sector, and attributes the upward revision to non-residential investment largely to the Meta data centre and the Greenlight Electricity Centre; Pembina says the Greenlight plant will be located in Sturgeon County, in Alberta's Industrial Heartland northeast of Edmonton, and will provide dedicated, behind-the-meter power for Meta's data centre.

    Evidence: Government of Alberta (Treasury Board and Finance): 2026-27 First Quarter Fiscal Update and Economic Statement; Pembina Pipeline Corporation: Greenlight Electricity Centre; Pembina Pipeline Corporation: Pembina Congratulates Meta and the Government of Alberta on New Data Centre Investment (news release, 8 July 2026)

    Why it matters

    Interpretation

    The employment and housing evidence points the same way: a fast-growing population and a strong energy sector have come with a record amount of construction and a job market that, on the City's own reading, is narrow.

    Evidence: City of Edmonton: Q2 2026 Economic Update; Government of Alberta (Treasury Board and Finance): 2026-27 First Quarter Fiscal Update and Economic Statement

    Opinion

    A labour market in which one sector supplies nearly all of a year's job gains is more exposed to that sector's funding and hiring decisions than a broadly based one, and Northline's data do not show how health-sector employment in Edmonton is funded or whether the gain will persist; this is a reading of the City's statement, not a finding.

    History

    Historical context

    The City of Edmonton reports that total housing starts in 2024 reached levels not seen since at least 1990 and that activity in 2025 was higher still, which it attributes to robust population growth between 2022 and 2025. Starts in the metropolitan area have since fallen: 19,055 homes were started in the twelve months to September 2026, -11.4% on the twelve months before. Over ten years Edmonton's population grew 26.2%.

    Evidence: City of Edmonton: Q2 2026 Economic Update

    Across geographies

    Edmonton's unemployment rate is 7.1%, against 6.6% in Calgary and 7.1% in Toronto.

    Historical context

    The City's report says the Edmonton unemployment rate rose from 6.5 per cent in the first quarter to 7.2 per cent in the second, and the province forecasts Alberta's rate to fall from 7.2 per cent in 2025 to 6.6 per cent in 2026; the first is a quarterly seasonally adjusted figure for the metropolitan area and the second an annual provincial forecast.

    Evidence: City of Edmonton: Q2 2026 Economic Update; Government of Alberta (Treasury Board and Finance): 2026-27 First Quarter Fiscal Update and Economic Statement

    Historical context

    Alberta's government says the provincial budget moved from a 9.4-billion-dollar deficit estimated in Budget 2026 to a surplus of about 2 billion dollars in its first-quarter forecast, mainly because of higher-than-expected non-renewable resource revenue.

    Evidence: Government of Alberta (Treasury Board and Finance): 2026-27 First Quarter Fiscal Update and Economic Statement

    Historical context

    Its Budget 2026 fiscal plan describes Alberta's resource-intensive economy as uniquely sensitive to global economic and market conditions.

    Evidence: Government of Alberta (Treasury Board and Finance): Budget 2026: Focused on what matters, Fiscal Plan 2026-29 (Open Government Licence - Alberta)

    What it influences

    Historical context

    The province reports that nearly 15,000 single-family homes were completed in Calgary and Edmonton in 2025, the highest since the 2006-07 boom, and that completed but unsold single-family inventory reached a record in March.

    Evidence: Government of Alberta (Treasury Board and Finance): 2026-27 First Quarter Fiscal Update and Economic Statement

    Historical context

    The City reports that units under construction in the second quarter of 2026 hit an all-time record in data back to 1990, that almost 45 per cent of starts since the first quarter of 2024 were apartments, which typically take longer to build, that the inventory of completed and unabsorbed ownership units was up 11.5 per cent on a year earlier, and that existing-home sales fell 8.5 per cent on an annualized basis.

    Evidence: City of Edmonton: Q2 2026 Economic Update

    Historical context

    CMHC's summer 2026 Housing Market Outlook projects Edmonton housing starts below the 2025 level and rental vacancy rising, and says Prairie markets will likely see modest rent increases, reflecting stronger demand.

    Evidence: CMHC: Summer Update: 2026 Housing Market Outlook

    Risks

    Historical context

    The Government of Alberta says significant uncertainty surrounding U.S. trade policy and global economic conditions continues to pose risks to investment and export demand.

    Evidence: Government of Alberta (Treasury Board and Finance): 2026-27 First Quarter Fiscal Update and Economic Statement

    Historical context

    It also says the wider discount on Alberta heavy oil primarily reflects increased competition from Venezuelan crude and additional heavy oil supply from releases from the U.S. Strategic Petroleum Reserve, and that ongoing geopolitical instability and related revenue volatility are significant risks to its fiscal outlook.

    Evidence: Government of Alberta (Treasury Board and Finance): 2026-27 First Quarter Fiscal Update and Economic Statement

    Historical context

    The City says Edmonton's consumer prices rose 3.2 per cent on an annualized basis in the second quarter and links higher headline inflation to the energy price shock from the Middle East conflict. The data held here cannot say how much of any of these risks would reach Edmonton's employment.

    Evidence: City of Edmonton: Q2 2026 Economic Update

    What to watch

    Historical context

    The City of Edmonton's summer 2026 outlook, produced with Stokes Economics, forecasts metropolitan real GDP growth of 2.4 per cent in 2026 and 3.2 per cent in 2027, a 2026 unemployment rate of 7.0 per cent and net migration of 15.6 thousand people in 2026 against 44.3 thousand in 2025, and housing starts of 17,257 in 2026 against 21,337 in 2025. CMHC's baseline for starts in 2026 is lower, at 16,000; the two forecasters disagree, and the City's earlier spring outlook had been higher still. These are the publishers' forecasts, not Northline's. Statistics Canada's Labour Force Survey and CMHC's monthly starts (release calendar) show which is closer.

    Evidence: City of Edmonton (with Stokes Economics): Summer 2026 Regional (Edmonton CMA) and City (Edmonton) Outlook Summary; City of Edmonton (with Stokes Economics): Spring 2026 Regional (Edmonton CMA) and City (Edmonton) Outlook Summary (finalized March 31, 2026); CMHC: Summer Update: 2026 Housing Market Outlook

    Prepared with AI assistance.

    Follow the relationships

    Upcoming releases

    Sources for this section (6 datasets, 10 documents)

    Data

    Documents cited

    Each dataset is used under its licence; attribution and series-level detail are in each chart’s “About this data” panel. Limitations: Every explanation here is a statement by the named organisation. Forecasts are the publishers' and are not Northline forecasts. The City of Edmonton's figures describe the City or the metropolitan area as stated in each source; Alberta figures are provincial and are not Edmonton's. Metropolitan wages, GDP by industry and productivity are not held, so those parts of the story are not told.
    0.6 · Edmonton's local economy: a government, health and education capital at the centre of a petrochemical and hydrogen cluster, with an airport freight bet and a city budget under strain

    Who and what are the local drivers of the Edmonton economy, as distinct from Alberta's; which large projects are under way; and where do the sources describe only the province or a different boundary?

    Health care, retail trade and public administration were Edmonton's largest sources of jobs in the 2021 Census, while the industrial base is to the north-east and east in the Industrial Heartland; the metropolitan area's population grew faster than any other census metropolitan area's in the year to July 2025, but the City says almost all recent job growth is in one sector and forecasts slower migration

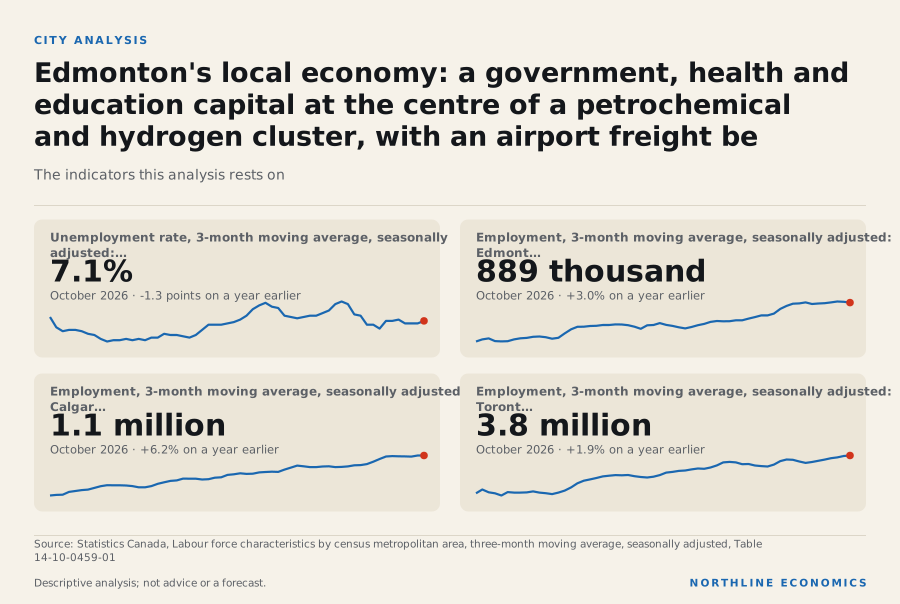
    Graphic: Edmonton's local economy: a government, health and education capita…Edmonton's local economy: a government, health and education capital at the centre of a petrochemical and…

    What happened

    In the 2021 Census, 570 thousand jobs were located in the Edmonton metropolitan area. Health care and social assistance accounted for 15.5% of them, retail trade 12.9% and public administration 8.2%. Educational services were 8.1%, construction 6.0%, professional, scientific and technical services 8.1% and transportation and warehousing 4.5%. Mining, quarrying and oil and gas extraction, the largest sector in Alberta's output, was 1.8% of Edmonton's jobs, against 4.8% in Calgary and 0.2% in Toronto.

    Today the unemployment rate is 7.1% (October 2026) and 889 thousand people are employed, 3.0% on a year earlier, against 6.2% in Calgary and 1.9% in Toronto. Unemployment is 6.6% in Calgary and 7.1% in Toronto.

    Those census shares are a 2021 snapshot of where people work, not a ranking of employers or a measure of output; the rest of this section uses organisations' own statements to say what sits behind them and which of them describe Edmonton rather than Alberta.

    Why it happened

    Refining, petrochemicals and the Industrial Heartland

    Historical context

    Strathcona County, one of the municipalities in Alberta's Industrial Heartland, calls the Heartland Canada's largest hydrocarbon processing region, with 40+ world-class companies and a combined total investment of over $30 billion. It says the region spans five municipalities and that the county's own portion is 194 square kilometres. These are a member municipality's figures, not the Association's own.

    Evidence: Strathcona County: Alberta's Industrial Heartland (Strathcona County page)

    Historical context

    The Government of Alberta's directive for the Designated Industrial Zone in the Heartland says its main goal is to improve regulatory consistency within the zone and achieve targeted environmental outcomes, by aligning standard environmental approval conditions for all facilities in the zone and giving new proponents clearer requirements.

    Evidence: Government of Alberta (Environment and Protected Areas): Industrial Heartland Designated Industrial Zone Directive: Standard Conditions (December 2025; Open Government Licence - Alberta)

    Historical context

    The province says Alberta's factory sales were up 11 per cent year to date through May, driven by petroleum products, petrochemicals and plastics. That is a provincial series; the metropolitan manufacturing data show petroleum and coal products at 58.8% of Edmonton's manufacturing shipments in August 2026, against 2.5% in Toronto, in current dollars that move with prices.

    Evidence: Government of Alberta (Treasury Board and Finance): 2026-27 First Quarter Fiscal Update and Economic Statement

    Hydrogen

    Historical context

    The Government of Alberta's 2021 Hydrogen Roadmap says Alberta is the largest hydrogen producer in Canada and that about 55 per cent of its hydrogen production is used for heavy oil upgrading, 38 per cent for the chemical sector and by-products and seven per cent for oil refining. Existing hydrogen demand is therefore largely the oil and chemical industry's own.

    Evidence: Government of Alberta (Ministry of Energy): Alberta Hydrogen Roadmap (November 2021; Open Government Licence - Alberta)

    Historical context

    Air Products announced in 2021 a $1.3 billion net-zero hydrogen production and liquefaction facility near Edmonton, then expected onstream in 2024, designed to capture over 95 per cent of the carbon dioxide from its natural-gas feedstock. In 2022 the federal government announced $300 million and Alberta $161.5 million toward it, with the project to create and maintain 230 jobs in Canada. Edmonton Global, the regional investment agency, now puts the same project at $1.6 billion. The sources do not explain the difference between the two cost figures, and none of the sources cited confirms the 2024 start date or gives a current status.

    Evidence: Air Products: Air Products Announces Multi-Billion Dollar Net-Zero Hydrogen Energy Complex in Edmonton, Alberta, Canada; Innovation, Science and Economic Development Canada: Government of Canada makes significant investment in Alberta's clean hydrogen sector (Air Products); Edmonton Global: Edmonton Region: Hydrogen Energy Leader

    Government, health care and universities

    Historical context

    The City of Edmonton's second-quarter 2026 Economic Update says health care and social assistance added 32,800 employees, accounting for almost 50 per cent of the increase across sectors that grew, and also almost singlehandedly accounted for the total year-over-year employment increase of 34,100 in the metropolitan area. The two statements are the City's and read differently (one measures against growing sectors, the other against the total); they are not reconciled here.

    Evidence: City of Edmonton: Q2 2026 Economic Update

    Historical context

    The province, for Alberta as a whole, says employment rose by 39,300 in the first seven months of the year, with health care and social assistance and wholesale and retail trade accounting for much of the increase.

    Evidence: Government of Alberta (Treasury Board and Finance): 2026-27 First Quarter Fiscal Update and Economic Statement

    Opinion

    The City's account of Edmonton is more concentrated in one sector than the provincial account, but the two cover different periods and boundaries, so this is a reading, not a finding.

    Historical context

    A study the University of Alberta commissioned from R.A. Malatest & Associates estimated the university's total economic impact on Alberta at nearly $19.4 billion in 2021/22, of which $15.8 billion (82 per cent) was attributed to the alumni education premium and research impact, and $2.4 billion to institutional operations. This is a university-commissioned, provincial figure that includes long-run effects; it is not Edmonton's annual spending or employment.

    Evidence: University of Alberta (study by R.A. Malatest & Associates): University of Alberta Economic Impact Study

    Historical context

    Edmonton Global, a promotional source, says the region has eight post-secondary institutions with more than 130,000 students.

    Evidence: Edmonton Global: Invest in the Edmonton region (home page)

    Opinion

    No source held here gives employment at Alberta Health Services, the provincial government, the University of Alberta or NAIT in Edmonton, so the size of these anchors comes only from the census shares above.

    Airport, rail and logistics

    Historical context

    Edmonton International Airport (YEG) describes itself as a self-funded, not-for-profit corporation and as Canada's fifth-busiest airport by passenger traffic and the largest major Canadian airport by land area; its cargo page cites over $1.5 billion in on-airport development and $300 million or more in new cargo development announced. This is the airport's own sales material.

    Evidence: Edmonton Regional Airports Authority (YEG): YEG International Cargo Hub

    Historical context

    Transport Canada announced in July 2022 up to $100 million from the National Trade Corridors Fund to increase cargo and logistics handling at the airport, converting approximately 2,000 acres into a new cargo operation. No source held here gives YEG's current cargo volumes, so the effect is not measured.

    Evidence: Transport Canada: Government of Canada invests to expand supply chain capacity at the Edmonton International Airport

    Historical context

    Port Alberta, Edmonton Global's inland-port brand, says the entire Edmonton region is a Foreign Trade Zone and that there are 16 rail intermodal and storage facilities in the region connecting it to 8 Canadian provinces, 16 U.S. states and Mexico. The City says Edmonton sits at the nexus of national rail lines, major highway and air cargo routes.

    Evidence: Port Alberta (Edmonton Global): Port Alberta: the inland port of the Edmonton Metropolitan Region; City of Edmonton: Industrial Growth (Why Edmonton)

    Technology and artificial intelligence

    Historical context

    The province's Budget 2026 fiscal plan says Alberta is attracting a growing number of AI data centre investments, reflecting its advantage in power generation capacity, abundant natural resources and a cold climate. Pembina says its Greenlight Electricity Centre, being built in Sturgeon County in Alberta's Industrial Heartland northeast of Edmonton, will provide dedicated, behind-the-meter power for the data centre Meta announced on 8 July 2026.

    Evidence: Government of Alberta (Treasury Board and Finance): Budget 2026: Focused on what matters, Fiscal Plan 2026-29 (Open Government Licence - Alberta); Pembina Pipeline Corporation: Greenlight Electricity Centre; Pembina Pipeline Corporation: Pembina Congratulates Meta and the Government of Alberta on New Data Centre Investment (news release, 8 July 2026)

    Historical context

    The province says its upward revision of non-residential investment to 7.7 per cent this year, from 6.0 per cent, largely reflects the Meta data centre and the Greenlight Electricity Centre. Pembina describes Greenlight as a gas-fired combined-cycle plant built by a partnership of Pembina, Morgan Stanley Infrastructure Partners and Kineticor.

    Evidence: Government of Alberta (Treasury Board and Finance): 2026-27 First Quarter Fiscal Update and Economic Statement; Pembina Pipeline Corporation: Greenlight Electricity Centre

    Historical context

    Amii, the Alberta Machine Intelligence Institute, launched in 2017 as an independent non-profit in downtown Edmonton and is one of three national AI institutes. Edmonton Global ranks the region in the top five globally for AI research; that ranking is promotional, and Northline has not verified its basis. No source held here counts AI or technology jobs in Edmonton.

    Evidence: Amii: About Amii; Edmonton Global: Invest in the Edmonton region (home page)

    Why it matters

    City economic strategy and the investment agencies

    Historical context

    The City's economic development strategy for 2026 to 2030, Edmonton Advantage, includes continuing the Industrial Investment Action Plan, implementing Community Revitalization Levy plans for Downtown, The Quarters and Belvedere, creating an Economic Opportunities Fund, and dedicated business attraction staff and a tax incentive for new major commercial and industrial construction. The City says the strategy's performance measures are under development, so there are no targets to test it against yet.

    Evidence: City of Edmonton: Edmonton Advantage: economic development strategy 2026-2030; City of Edmonton: Edmonton Advantage: Economic Development Strategy 2026-2030

    Historical context

    Edmonton Global, which markets the wider region rather than the City, says it supported over $2.25 billion in new investment, creating more than 1,000 jobs, in its 2024 annual report; that is self-reported and a year or more old.

    Evidence: Edmonton Global: Edmonton Global releases 2024 Annual Report highlighting over $2.25 billion in new investment (news release, 10 June 2025)

    Historical context

    The City reports that industrial building permits rose 200.6 per cent year over year to $107.8 million in the second quarter, which is a measure of intentions rather than completed investment.

    Evidence: City of Edmonton: Q2 2026 Economic Update

    Downtown, Blatchford, LRT and utilities

    Historical context

    The City's LRT construction update gives the Valley Line West extension from downtown to Lewis Farms, a 14-kilometre second stage of the Valley Line, a budget of $2.6 billion.

    Evidence: City of Edmonton: 2026 Mid-Season LRT Construction Update

    Historical context

    The City is the land developer for Blatchford, on the former municipal airport grounds, and says its 2014 business case envisages up to 30,000 residents and 100 per cent renewable energy. It says land sales fund the redevelopment without affecting property taxes, while the district energy system's capital spending to date was funded primarily through self-supporting tax-guaranteed debt. The page gives no count of current residents or homes.

    Evidence: City of Edmonton: Welcome to Blatchford

    Historical context

    The City's 2026 budget highlights say the first phase of the Downtown District Energy Initiative started operating in September 2025.

    Evidence: City of Edmonton: 2026 Budget Highlights

    Historical context

    The same document gives an approved 2023-2026 capital budget of $9 billion for more than 200 projects, and a table totalling 11,705,263 thousand dollars once spending in 2027 and beyond is included. The two totals describe different periods and scopes and both are the City's.

    Evidence: City of Edmonton: 2026 Budget Highlights

    Historical context

    It reports an approved 2026 property tax increase of 6.9 per cent, says households can expect to pay about $816 in 2026 for every $100,000 of assessed home value, and says taxes in the previous budget cycle were not enough to cover inflationary pressures and a rapidly growing population.

    Evidence: City of Edmonton: 2026 Budget Highlights

    Opinion

    Several of these projects are public: a rapid-transit extension, a municipal land developer and municipal utilities. The sources do not measure how much of Edmonton's output depends on them; this is a reading of the sources, not a finding.

    History

    Historical context

    The last plane flew out of the city centre airport on November 30, 2013, and Council approved the Blatchford business plan in 2014, so the redevelopment has been under way for more than a decade without a sourced count of residents.

    Evidence: City of Edmonton: Welcome to Blatchford

    Historical context

    The City says Edmonton's total housing starts in 2024 reached levels not seen since at least 1990 and were promptly surpassed by even higher activity in 2025, following robust population growth between 2022 and 2025.

    Evidence: City of Edmonton: Q2 2026 Economic Update

    Across geographies

    Historical context

    Statistics Canada reports that from July 2024 to July 2025 growth in Edmonton (+3.0 per cent), Moncton and Calgary was the largest among all census metropolitan areas, while the Toronto area's population fell by 992 people after a record increase a year earlier. Edmonton's net gain from other provinces was 11,742. The release's rates divide by the average of the populations at the start and end of the year; measured from the July 2024 level, as in the population section, Edmonton grew 3.1%.

    Evidence: Statistics Canada: The Daily: Canada's population estimates: Subprovincial areas, 2025

    Historical context

    In Statistics Canada's account, Edmonton and Calgary's growth came from permanent immigration, non-permanent residents and migration from other provinces together; in Toronto the net loss in non-permanent residents was the main contributor to the slowdown.

    Evidence: Statistics Canada: The Daily: Canada's population estimates: Subprovincial areas, 2025

    Opinion

    On the census and monthly data held here, Edmonton's structure is closer to a government-and-health city with an industrial belt than to Calgary's head-office oil economy (Calgary's share of jobs in mining and oil and gas is shown above) or Toronto's financial and services base. The data do not show why: no source held here compares the three on causes, and the shares are 2021 snapshots.

    Statistics Canada's provincial accounts put mining, quarrying and oil and gas extraction at 19.1% of Alberta's real GDP at basic prices in 2025, the largest single industry; it is provincial, and no metropolitan equivalent is held here.

    What it influences

    Housing supply

    Historical context

    The City reports that units under construction in the second quarter of 2026 hit an all-time record in data back to 1990, that almost 45 per cent of starts since the first quarter of 2024 were apartments, which typically take longer to build, that the inventory of completed and unabsorbed ownership units was up 11.5 per cent on a year earlier, and that starts were 20.1 per cent lower through the first half.

    Evidence: City of Edmonton: Q2 2026 Economic Update

    Historical context

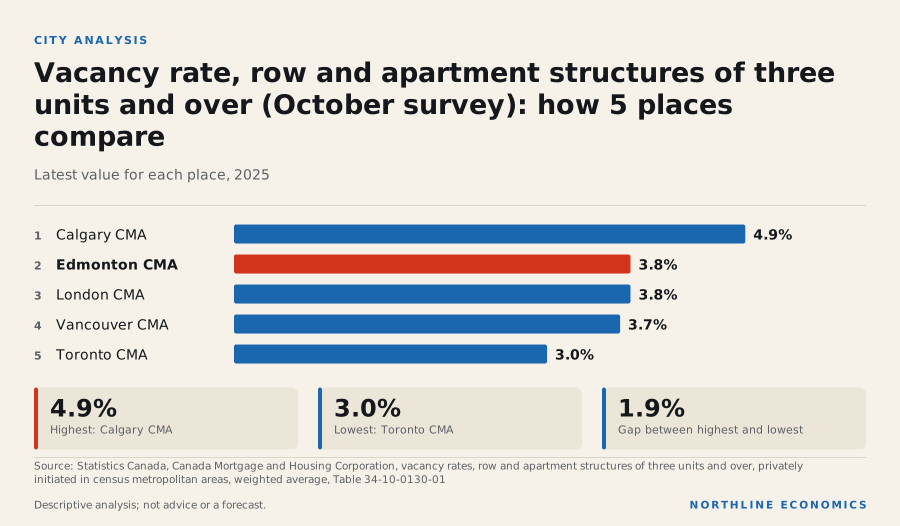
    CMHC's summer 2026 outlook puts Edmonton total housing starts at 21,337 in 2025 and a baseline of 16,000 in 2026. In the twelve months to September 2026 starts totalled 19,055. In CMHC's October 2025 survey the average two-bedroom purpose-built rent was C$1,598 and the vacancy rate 3.8%, against 4.9% in Calgary and 3.0% in Toronto.

    Evidence: CMHC: Summer Update: 2026 Housing Market Outlook

    Historical context

    Under the federal Housing Accelerator Fund the City says it is receiving $202 million to support 16 initiatives, expects more than 36,000 new homes to be permitted by 2026, and is on track to meet all targets as of July 2026. The page is the City's own progress report.

    Evidence: City of Edmonton: Housing Accelerator Fund

    Population and migration

    Historical context

    The City's summer 2026 outlook, produced with Stokes Economics, forecasts net migration to the metropolitan area of 44.3 thousand in 2025 falling to 15.6 thousand in 2026, and employment rising from 860.1 thousand to 949.2 thousand between 2025 and 2030. This is the City's forecast, not Northline's.

    Evidence: City of Edmonton (with Stokes Economics): Summer 2026 Regional (Edmonton CMA) and City (Edmonton) Outlook Summary

    Historical context

    The Edmonton Metropolitan Region Board's growth plan anticipates 2.2 million people and 1.2 million jobs in the region by 2044. The region here is the Board's member municipalities, a different boundary from the census area, and the fact sheet is dated 2021.

    Evidence: Edmonton Metropolitan Region Board: Growth Plan Overview (fact sheet)

    Risks

    Historical context

    The province says the wider discount on Alberta heavy oil primarily reflects increased competition from Venezuelan crude and additional heavy oil supply from releases from the U.S. Strategic Petroleum Reserve, that new pipeline capacity is expected to add about 270,000 barrels per day of export capacity over two years, and that its first-quarter forecast includes a $2 billion surplus.

    Evidence: Government of Alberta (Treasury Board and Finance): 2026-27 First Quarter Fiscal Update and Economic Statement

    Historical context

    The same update forecasts resource revenue of $23 billion in 2026-27 out of total revenue of $86.3 billion, and the Budget 2026 fiscal plan describes Alberta's resource-intensive economy as uniquely sensitive to global economic and market conditions.

    Evidence: Government of Alberta (Treasury Board and Finance): 2026-27 First Quarter Fiscal Update and Economic Statement; Government of Alberta (Treasury Board and Finance): Budget 2026: Focused on what matters, Fiscal Plan 2026-29 (Open Government Licence - Alberta)

    Historical context

    The City says employment growth narrowed to fewer industries, that recent gains came exclusively from 25-54 year olds, that the unemployment rate rose from 6.5 per cent in the first quarter to 7.2 per cent in the second, and that consumer prices were rising 3.2 per cent.

    Evidence: City of Edmonton: Q2 2026 Economic Update

    Historical context

    The province reported in August that the non-permanent resident population had declined by more than 35,000 over the past year. That figure was published before Statistics Canada's September 2026 estimates, which updated the non-permanent resident series from July 2021 onward and show a change for Alberta of -7,957 over the four quarters to Q2 2026; the two figures cover different periods and come from different releases. With the City's forecast fall in migration, the change matters for housing demand; the data held here do not say how much of it is in Edmonton.

    Evidence: Government of Alberta (Treasury Board and Finance): 2026-27 First Quarter Fiscal Update and Economic Statement; Statistics Canada: The Daily: Canada's population estimates, second quarter 2026

    Opinion

    Edmonton's exposure to oil prices appears to run less through direct oil-and-gas employment (a small share of jobs, shown above) than through the refining and petrochemical belt, construction, the provincial budget that funds health and education, and migration that responds to Alberta's job market. That is a hypothesis built from the cited sources; none of them measures those channels for the metropolitan area.

    Opinion

    Structural challenges visible in the sources are: dependence on one growing sector for jobs, a record pipeline of apartments meeting slower migration, a city budget that the City says did not keep up with inflation and population growth in the previous cycle, and Blatchford's long build-out. Whether these are cyclical or lasting is not shown.

    What to watch

    Historical context

    The City's outlook has the metropolitan economy growing in real terms by 3.2 per cent in 2027 before slowing to 1.5 per cent in 2030, with unemployment easing from 7.7 per cent in 2025 toward 6.2 per cent in 2030.

    Evidence: City of Edmonton (with Stokes Economics): Summer 2026 Regional (Edmonton CMA) and City (Edmonton) Outlook Summary

    Opinion

    On the cited sources, the medium-term outlook depends on: whether net migration settles near the City's forecast; whether the large industrial and hydrogen projects proceed; whether health-sector hiring is joined by other sectors; the oil price and heavy-oil discount through the provincial budget; and whether the airport and inland-port investment turns into measurable cargo. These are conditions drawn from the sources, not forecasts.

    Statistics Canada's Labour Force Survey and annual population estimates, the City's quarterly Economic Update and CMHC's housing outlook would show whether these conditions are being met.

    Not covered by the sources cited, and so not described here: the Industrial Heartland Association's own figures, the airport's economic-impact study and cargo volumes, Alberta Health Services and provincial-government employment in Edmonton, a list of the largest employers, wages by industry for the metropolitan area, GDP by industry for the metropolitan area, the Bank of Canada's regional commentary, the Edmonton Metropolitan Region Board's updated projections, and federal Major Projects Office detail (its page lists a West Coast oil pipeline starting at Bruderheim, Alberta, and Alberta high-speed rail, but gives no Edmonton effect here).

    Prepared with AI assistance.

    Follow the relationships

    Upcoming releases

    Sources for this section (9 datasets, 30 documents)

    Data

    Documents cited

    Each dataset is used under its licence; attribution and series-level detail are in each chart’s “About this data” panel. Limitations: Every explanation here is a statement by the named organisation. Several sources are promotional (Edmonton Global, Port Alberta, the airport's cargo page and Air Products describe what they want to sell) and are labelled as such. The industrial-zone figures come from a member county and the province, not from Alberta's Industrial Heartland Association. The airport's own economic-impact study, a metropolitan wage series, a list of the largest employers, GDP by industry for the metropolitan area and the Bank of Canada's regional commentary are not among the sources cited, so those parts are not described. Census industry shares are for 2021 and describe jobs by place of work. 'Edmonton region', 'Edmonton Metropolitan Region', the City of Edmonton and the census metropolitan area are different boundaries; each statement is labelled with the one its source uses. Alberta figures are provincial and are not Edmonton's.

    1 · Labour market

    Is Edmonton's labour market keeping pace with Calgary and the other large metropolitan areas?

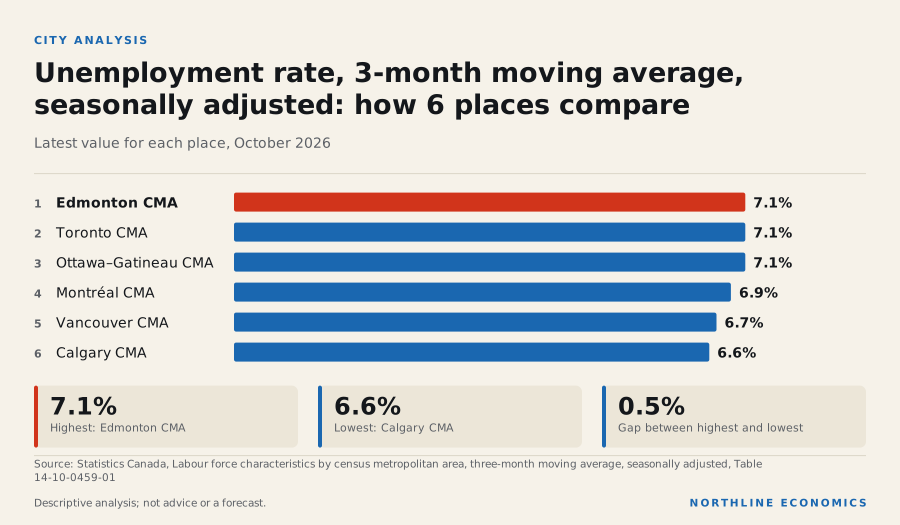
    Edmonton's unemployment rate was 7.1% in October 2026; it fell by 1.3 percentage points over the year, and employment grew 3.0% against 6.2% in Calgary

    Graphic: Unemployment rate, 3-month moving average, seasonally adjusted: how…Unemployment rate, 3-month moving average, seasonally adjusted: how 6 places compare. Edmonton CMA 7.1%;…

    What happened

    Edmonton's seasonally adjusted unemployment rate (three-month average) was 7.1% in October 2026: it fell by 1.3 percentage points over the year, from 8.4%. Calgary's was 6.6%, Toronto's 7.1%, Vancouver's 6.7%, Montréal's 6.9% and Ottawa–Gatineau's 7.1%. Employment of 889 thousand is 3.0% higher than a year ago, against 6.2% in Calgary, 1.9% in Toronto, 1.2% in Vancouver, -0.9% in Montréal and 0.9% in Ottawa–Gatineau.

    Unemployment rate by metropolitan area

    Percent, three-month moving average, seasonally adjusted. Census metropolitan areas only; do not compare with provincial monthly rates (different smoothing).

    Chart loads when it comes into view.

    Latest values: Edmonton 7.1 (2026-10); Calgary 6.6 (2026-10); Toronto 7.1 (2026-10); Vancouver 6.7 (2026-10); and 2 more in the data table.

    Employment by metropolitan area, indexed

    Three-month moving average, seasonally adjusted; start of period = 100.

    Chart loads when it comes into view.

    Latest values: Edmonton 889,000 (2026-10); Calgary 1,053,000 (2026-10); Toronto 3,792,000 (2026-10); Vancouver 1,705,000 (2026-10); and 2 more in the data table.

    The participation rate is 68.7% (it fell 0.7 percentage points over the year, against 71.4% in Calgary and 66.9% in Toronto) and the employment rate 63.8% (2nd of 6 among the six areas; Calgary 66.7%).

    Participation rate by metropolitan area

    Percent, three-month moving average, seasonally adjusted.

    Chart loads when it comes into view.

    Latest values: Edmonton 68.7 (2026-10); Calgary 71.4 (2026-10); Toronto 66.9 (2026-10); Vancouver 68 (2026-10); and 2 more in the data table.

    By industry, Statistics Canada's annual Labour Force Survey estimates (table 14-10-0468-01, annual averages, not seasonally adjusted) put average employment in Edmonton at 860 thousand in 2025, a change of 2.7% on the year before and of 9.2% since 2019. Goods-producing industries account for 20.8% of employed persons and services-producing industries for 79.2%; among the individual groups, wholesale and retail trade 14.6%, health care and social assistance 14.3% and construction 11.5% of employment. The table counts people by the industry of their main job and by where they live, so it is a measure of employment, not of output, wages or the number of businesses. Estimates for a single industry group in one metropolitan area come from a small survey sample and are less steady than the total: Statistics Canada suppresses some cells, and the table is annual, so a one-year move in a small group should not be read as a trend. No sampling-error range is held with these series, so none is quoted; the monthly metropolitan rates above are three-month averages and are noisier than the annual figures. Wages for the metropolitan area are not held here; the Statistics Canada wage tables used cover provinces and Canada.

    Employment in Edmonton: goods and services, indexed

    Annual average of employed persons, Labour Force Survey (Statistics Canada table 14-10-0468-01); first year shown = 100. Goods-producing and services-producing sectors against all industries. Annual estimates, not seasonally adjusted.

    Chart loads when it comes into view.

    Latest values: All industries 860,100 (2025); Goods-producing sector 179,000 (2025); Services-producing sector 681,100 (2025).

    Employment by industry group in fourteen metropolitan areas, 2025

    Share of employed persons living in each metropolitan area who work in each group (annual average, Labour Force Survey; the survey classifies jobs by the industry of the person’s main job, not by where the employer sits). Single-sector estimates for one metropolitan area rest on small samples; a city is left out of a chart where Statistics Canada suppresses the estimate. Shares are computed by this project from Statistics Canada table 14-10-0468-01.

    Chart loads when it comes into view.

    Top values: Kitchener–Cambridge–Waterloo 25.3%; Edmonton 20.8%; Calgary 20%.

    Why it happened

    The data show where Edmonton stands, not why. One comparison is informative: since the end of 2019 employment is up 12.7% in Edmonton but 27.1% in Calgary, so Edmonton's recovery in the number of jobs has been much slower than Calgary's over the whole period. This report cannot attribute the difference to industry mix or population growth, because the annual industry employment shown above describes the mix of jobs and does not establish a cause.

    Why it matters

    The labour market shows how much of the metropolitan area's population is working, which matters for household income and demand for housing and services. Edmonton's employment rate is 2nd of 6 among the six large metropolitan areas, so a large share of its population is working even though job growth is slower than in Calgary.

    History

    Over ten years Edmonton's unemployment rate has averaged 7.7%, with a high of 15.5% in June 2020 and a low of 5.5% in August 2022; today's rate is below that average.

    Across geographies

    Edmonton's rate minus Calgary's is 0.5 percentage points. As context, and on a different definition (monthly, province-wide), Alberta's unemployment rate is 7.3% and Canada's 6.7%; these must not be read against the metropolitan three-month averages.

    Context: Alberta and Canada unemployment (monthly)

    Province and national series, monthly seasonally adjusted. Shown separately from the metropolitan chart because the metropolitan rates are three-month averages.

    Chart loads when it comes into view.

    Latest values: Alberta 7.3 (2026-10); Canada 6.7 (2026-10).

    What it influences

    Jobs matter for household income and housing demand in the Edmonton region; the relationship explorer lists the links from oil prices and Alberta's economy to Edmonton, each with its evidence class. See the connections section of this report.

    Risks

    Not assessed: sector-specific labour-market risks for Edmonton, for which the annual industry employment shown above is a description of the mix of jobs, not an assessment of risk. The national risks (energy prices, trade policy, slower population growth) are in the Canada report.

    What to watch

    The monthly Labour Force Survey (the next release is listed in the release calendar), and whether Edmonton's job growth narrows the gap with Calgary.

    Prepared with AI assistance.

    Follow the relationships

    Upcoming releases

    Sources for this section (3 datasets, 0 documents)

    Data

    Each dataset is used under its licence; attribution and series-level detail are in each chart’s “About this data” panel. Limitations: Metropolitan rates are three-month moving averages from the Labour Force Survey and are noisier than national figures; sampling error is larger than for provinces. They are not comparable with provincial or national monthly rates and are never charted with them. Wages and demographic breakdowns for the metropolitan area are not included; annual employment by industry group (Labour Force Survey, annual averages, with suppressed cells and small-sample variability) is held, but it is not seasonally adjusted and is not output or wages.

    2 · Prices and inflation

    How is inflation affecting Edmonton households compared with other cities?

    Consumer prices in Edmonton were up 3.5% in the year to September 2026, the highest of the six large metropolitan areas, against 3.1% nationally

    Graphic: Consumer Price Index, all-items, 12-month change: how 6 places compareConsumer Price Index, all-items, 12-month change: how 6 places compare. Alberta 3.6%; Edmonton CMA 3.5%;…

    What happened

    Edmonton's all-items consumer price index rose 3.5% over the year to September 2026, against 3.4% in Calgary, 3.6% in Alberta and 3.1% in Canada. Edmonton ranks 1st of 6 among the six metropolitan areas for inflation. Toronto's was 2.1%, Vancouver's 3.0% and Montréal's 3.0%.

    Consumer price inflation by city

    12-month change in the all-items CPI (derived). Ottawa–Gatineau is the Ontario part only.

    Chart loads when it comes into view.

    Latest values: Edmonton 3.52 (2026-09); Calgary 3.36 (2026-09); Toronto 2.08 (2026-09); Vancouver 3.03 (2026-09); and 2 more in the data table.

    Why it happened

    The city series is an all-items index, so it cannot show which components drove Edmonton's higher rate.

    Historical context

    At the national level, Statistics Canada attributes the September acceleration to gasoline and fuel oil, and reports that five provinces saw faster increases than in August mainly because of gasoline and fuel oil.

    Evidence: Statistics Canada: The Daily: Consumer Price Index, September 2026

    Interpretation

    Because energy prices drove the national acceleration, and Alberta's rate (3.6%) and its two large cities' rates are all above the national rate, it is plausible that energy costs contributed more to Alberta's inflation than elsewhere. This report cannot confirm it: city and provincial energy components are not included, so the explanation is not tested.

    Evidence: relationship: World oil price (WTI) and Consumer energy and gasoline prices; Statistics Canada: The Daily: Consumer Price Index, September 2026

    Why it matters

    Edmonton's prices have risen 23.3% in the seven years to September 2026 against 27.0% in Calgary (the city indexes are not seasonally adjusted, so the same month seven years earlier is the base); over the longer run Edmonton's price level has risen less than Calgary's, though the year-over-year rate is now higher. For households, what matters is the combination of prices and incomes; this report has no Edmonton wage series, so it does not show whether real incomes have kept pace.

    History

    Edmonton's inflation peaked at 8.5% in June 2022, the same month national inflation peaked in this series.

    Across geographies

    Edmonton's rate minus Calgary's is 0.2 percentage points, computed before the rates are rounded, and Alberta's rate is 3.6%. Among the six cities, Toronto has the lowest rate at 2.1%.

    What it influences

    Inflation bears on the cost of living, wage demands and, through the Bank of Canada, the cost of borrowing for Edmonton households. These links are national and not measured for the city.

    Risks

    Historical context

    On 28 October the Bank of Canada raised its policy rate to reduce the risk that continuing high energy prices spread broadly to the prices of other goods and services.

    Evidence: Bank of Canada: Bank of Canada raises the policy rate by 25 basis points to 2½% (28 October 2026)

    What to watch

    The next consumer price release (see the release calendar) and gasoline price movements.

    Prepared with AI assistance.

    Follow the relationships

    Upcoming releases

    Sources for this section (1 datasets, 2 documents)

    Data

    Documents cited

    Each dataset is used under its licence; attribution and series-level detail are in each chart’s “About this data” panel. Limitations: City CPI indexes use local baskets and are published for the whole metropolitan area (Ottawa–Gatineau for the Ontario part only). The city CPI is held here for all items only. The table used publishes shelter and its parts for cities, but not food or gasoline, and the shelter series are not held here, so the drivers are inferred from national and provincial data and not tested.

    3 · Population and growth

    How quickly is Edmonton growing, and where is the growth coming from?

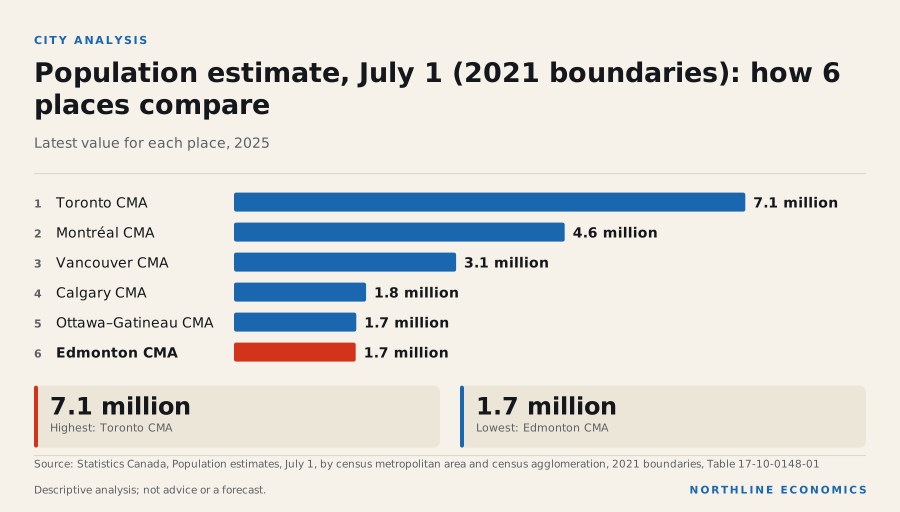
    Edmonton's population grew 3.1% in the year to July 2025, the fastest of the six large metropolitan areas (1st of 6); Alberta's grew 1.5% in the more recent four quarters to 1 July 2026

    Graphic: Population estimate, July 1 (2021 boundaries): how 6 places comparePopulation estimate, July 1 (2021 boundaries): how 6 places compare. Toronto CMA 7.1 million; Montréal CMA…

    What happened

    The Edmonton metropolitan area had 1.7 million residents on July 1, 2025, 3.1% more than a year earlier. Over five years it grew 15.8%, against 20.1% in Calgary and 9.5% in Toronto. In the year to July 2025 the growth rates were 2.9% in Calgary, 2.3% in Ottawa–Gatineau, 0.5% in Montréal, 0.2% in Vancouver and 0.0% in Toronto.

    Population by metropolitan area, indexed

    July 1 estimates, 2021 boundaries; start of period = 100.

    Chart loads when it comes into view.

    Latest values: Edmonton 1,692,000 (2025); Calgary 1,836,000 (2025); Toronto 7,109,000 (2025); Vancouver 3,088,000 (2025); and 2 more in the data table.

    Why it happened

    Historical context

    Statistics Canada reports that from July 1, 2025, to July 1, 2026, Alberta grew faster than any other province and that Ontario, Quebec and British Columbia, which receive the largest shares of international migrants, grew slowest.

    Evidence: Statistics Canada: The Daily: Canada's population estimates, second quarter 2026

    Net interprovincial migration added 22 thousand to Alberta's population over the four quarters to Q2 2026. The metropolitan area's own net interprovincial migration is shown with the other components below.

    Historical context

    Statistics Canada's January 2026 release on subprovincial estimates reports that the population growth rate from July 2024 to July 2025 was lower for all 41 census metropolitan areas than in the previous year. It reports that Edmonton was among the three fastest-growing areas, that permanent immigration was the leading factor of growth in those three, that the increase in non-permanent residents and gains from migratory exchanges with other provinces also contributed significantly in Edmonton and Calgary, and that for the third consecutive year the largest net gains from interprovincial migration among the areas were in Edmonton and Calgary.

    Evidence: Statistics Canada: The Daily: Canada's population estimates: Subprovincial areas, 2025

    In the demographic year that began in July 2024, the Edmonton metropolitan area recorded 17 thousand births and 11 thousand deaths, 22 thousand immigrants, a net change of 8,972 non-permanent residents, net interprovincial migration of 12 thousand and net intraprovincial migration (movement to and from the rest of the province) of 3,670. The year before, immigrants numbered 21 thousand and the net change in non-permanent residents was 33 thousand. Net non-permanent residents averaged 13 thousand a year over the latest five demographic years.

    Where Edmonton's population change came from

    Persons over the twelve months from July 1 of the year shown (so 2024 is July 2024 to June 2025), 2021 boundaries. Net movements: negative = net outflow. Statistics Canada table 17-10-0149-01.

    Chart loads when it comes into view.

    Latest values: Immigrants 21,670 (2024); Net non-permanent residents 8,972 (2024); Net interprovincial migration 11,740 (2024); Net intraprovincial migration 3,670 (2024).

    Why it matters

    Population growth adds workers and households. A fast-growing metropolitan area can need more housing, schools and services, and it also gains consumers. Over five years Edmonton's growth has been below Calgary's.

    History

    Over ten years Edmonton's population grew 26.2%. The components of change are available from 2001.

    Across geographies

    The share of Alberta's growth that went to Edmonton is not calculated here; the provincial population grew 1.5% in the four quarters to 1 July 2026.

    Hypothesis, not established

    The 2026 fall in the number of non-permanent residents could reduce demand in cities that host many international students. The metropolitan change in non-permanent residents to June 2025 is among the components above; it does not cover the 2026 fall. Alberta's net change in non-permanent residents over the four quarters to Q2 2026 was -7,957.

    Evidence: Statistics Canada: The Daily: Canada's population estimates, second quarter 2026

    What it influences

    Population growth bears on housing demand, labour supply and public service needs. Those links are national and not measured for the city.

    Risks

    Not assessed: the effect of slower national population growth on Edmonton specifically. The metropolitan data end in 2025, before the 2026 fall in temporary residents.

    What to watch

    Statistics Canada's next annual metropolitan population estimates and quarterly provincial estimates.

    Prepared with AI assistance.

    Follow the relationships

    Sources for this section (5 datasets, 2 documents)

    Data

    Documents cited

    Each dataset is used under its licence; attribution and series-level detail are in each chart’s “About this data” panel. Limitations: City population is an annual July 1 estimate on 2021 boundaries and ends a year before the latest provincial figures. Components of change come from a separate table (17-10-0149-01) whose demographic year runs from July 1 to June 30; each is labelled by the year in which that year starts, so the latest covers July 2024 to June 2025. They describe how much each component contributed and do not explain why. Births and deaths are not netted here; net emigration, returning emigrants and the table's residual are not shown, so the components shown need not add to the total change.

    4 · Housing and construction

    Is Edmonton building enough homes, and is that keeping housing affordable?

    Edmonton had 18,494 homes under construction at the end of September 2026, close to its ten-year high, while new-home prices are 4.6% below their ten-year peak of June 2022

    Graphic: Vacancy rate, row and apartment structures of three units and over …Vacancy rate, row and apartment structures of three units and over (October survey): how 5 places compare.…

    What happened

    Edmonton started 19,055 homes over the past twelve months, completed 18,245 and had 18,494 under construction at the end of September 2026, 4.0% more than a year earlier and close to the highest level of the last ten years (18,544 in August 2026). Over the same twelve months Calgary started 24,403 and completed 23,827; Toronto started 23,355.

    Housing starts by metropolitan area (12-month total)

    Total units started over the previous 12 months; CMHC data distributed by Statistics Canada.

    Chart loads when it comes into view.

    Latest values: Edmonton 19,060 (2026-09); Calgary 24,400 (2026-09); Toronto 23,360 (2026-09); Vancouver 26,600 (2026-09); and 2 more in the data table.

    Housing under construction by metropolitan area

    Units under construction at month end, total units; CMHC data distributed by Statistics Canada.

    Chart loads when it comes into view.

    Latest values: Edmonton 18,490 (2026-09); Calgary 26,250 (2026-09); Toronto 88,110 (2026-09); Vancouver 61,680 (2026-09); and 2 more in the data table.

    The New Housing Price Index for Edmonton is 105.7, -0.8% on a year ago and -1.5% since February 2022; its ten-year peak was in June 2022. Calgary's index changed 0.0% over the year and 11.0% since February 2022.

    New housing price index by city, indexed

    Total (house and land); start of period = 100. Ottawa–Gatineau is the Ontario part only.

    Chart loads when it comes into view.

    Latest values: Edmonton 105.7 (2026-09); Calgary 129.7 (2026-09); Toronto 105 (2026-09); Vancouver 123.4 (2026-09); and 2 more in the data table.

    Historical context

    CMHC's Fall 2026 Housing Supply Report describes Edmonton as one of Canada's most affordable major housing markets, with no measurable housing supply gap; it reports that total starts in the first half of 2026 declined 20% compared with 2025 levels, while condominium apartment starts rose 14% on the same period of 2025. For comparison it estimates that Calgary needs 4,000 to 5,000 additional units a year.

    Evidence: Canada Mortgage and Housing Corporation: Fall 2026 Housing Supply Report

    In the October 2025 Rental Market Survey the average rent for a two-bedroom unit in purpose-built rental structures of three or more units in Edmonton was C$1,598 a month, 4.5% higher than a year earlier (CMHC's same-sample figure, for structures surveyed in both years, is 3.5%) and 25.8% higher than five years earlier, ranking 9th of 14 among fourteen cities (highest = 1); the same measure was C$1,908 in Calgary, C$2,045 in Toronto, C$2,364 in Vancouver. The vacancy rate was 3.8%, from 3.0% a year earlier (against 3.8% in London, 4.9% in Calgary, 3.0% in Toronto, 3.7% in Vancouver). The table covers purpose-built rental structures only; condominium, house and basement-suite rentals, and the asking rents on new listings, are not in it.

    Average rent, two-bedroom units: fourteen cities

    Current dollars per month, October survey each year; row and apartment structures of three units and over only (condominium, house and basement-suite rentals are not in this table). CMHC data distributed by Statistics Canada.

    Chart loads when it comes into view.

    Latest values: Edmonton 1,598 (2025); Calgary 1,908 (2025); Toronto 2,045 (2025); Vancouver 2,364 (2025); and 10 more in the data table.

    Rental vacancy rate: fourteen cities

    Percent of units vacant, October survey each year; row and apartment structures of three units and over. CMHC data distributed by Statistics Canada.

    Chart loads when it comes into view.

    Latest values: Edmonton 3.8 (2025); Calgary 4.9 (2025); Toronto 3 (2025); Vancouver 3.7 (2025); and 10 more in the data table.

    Why it happened

    The data show a large construction pipeline (units under construction near a ten-year high) alongside flat-to-falling new-home prices.

    Interpretation

    CMHC expects housing completions to remain high in the near term. That added supply is consistent with new-home prices that have not risen, but the data held here do not test it.

    Evidence: Canada Mortgage and Housing Corporation: Fall 2026 Housing Supply Report

    Interpretation

    CMHC links supply to affordability, and describes Edmonton as already affordable with no measurable gap between current construction and what it estimates is needed. Together these suggest that Edmonton is the only one of the six large cities where CMHC finds supply has kept up. The causal chain from supply to prices is CMHC's assessment; the Edmonton data here show the pattern but cannot isolate supply from other drivers such as incomes, interest rates and migration.

    Evidence: Canada Mortgage and Housing Corporation: Housing starts and construction data, September 2026; Canada Mortgage and Housing Corporation: Fall 2026 Housing Supply Report

    Historical context

    CMHC's 2025 Rental Market Report says that in Edmonton vacancy rates rose as supply growth outpaced demand. These are CMHC's stated reasons; the data held here do not test them.

    Evidence: Canada Mortgage and Housing Corporation: Rental Market Report 2025: major centres (web edition)

    Why it matters

    Housing is a large household expense. New-home prices have changed -1.5% since February 2022 in Edmonton, against -8.5% in Toronto and -3.6% in Vancouver.

    History

    Housing starts reached a monthly peak of 2,689 in June 2025. Building permits for the metropolitan area totalled C$7.0 billion over the twelve months to August 2026, -4.6% on the twelve months before. The residential share of the permit value in August 2026 was 61.5%. Over the same twelve months permits for Calgary totalled C$9.2 billion and for Toronto C$29.3 billion.

    Housing completions by metropolitan area (12-month total)

    Units completed over the previous 12 months, total units; CMHC data distributed by Statistics Canada.

    Chart loads when it comes into view.

    Latest values: Edmonton 18,250 (2026-09); Calgary 23,830 (2026-09); Toronto 26,690 (2026-09); Vancouver 27,830 (2026-09); and 2 more in the data table.

    Across geographies

    On the six-city comparison, units under construction changed 4.0% over the twelve months to September 2026 in Edmonton, 9.2% in Montréal, 2.1% in Calgary and -4.2% in Toronto. Provincial housing starts (12-month average) are 49,529 a year in Alberta.

    What it influences

    The Bank of Canada describes a link between mortgage costs and housing, and CMHC a link between supply and affordability; neither is estimated for Edmonton.

    Risks

    Historical context

    CMHC's deputy chief economist said a key risk for Canada is not building enough during this period of softening housing markets, and that affordability gains since 2023 will be difficult to sustain unless construction rises. CMHC's own assessment for Edmonton is that it has no measurable gap; the falling starts it reports for the first half of 2026 are a point to watch.

    Evidence: Canada Mortgage and Housing Corporation: Housing starts and construction data, September 2026

    What to watch

    Monthly CMHC starts, Statistics Canada's New Housing Price Index and building permits (release dates in the calendar), and the Bank of Canada's next announcement on 9 December 2026.

    Prepared with AI assistance.

    Follow the relationships

    Upcoming releases

    Sources for this section (6 datasets, 3 documents)

    Data

    Documents cited

    Each dataset is used under its licence; attribution and series-level detail are in each chart’s “About this data” panel. Limitations: Starts, completions and units under construction are CMHC counts for the metropolitan area (all unit types). The New Housing Price Index covers new homes only; resale prices are not included, and rents are the October Rental Market Survey for purpose-built rental structures only. Building permit values are in current dollars, seasonally adjusted.

    5 · Industry, investment and exposure

    What does Edmonton make and build, and how exposed is it to energy prices?

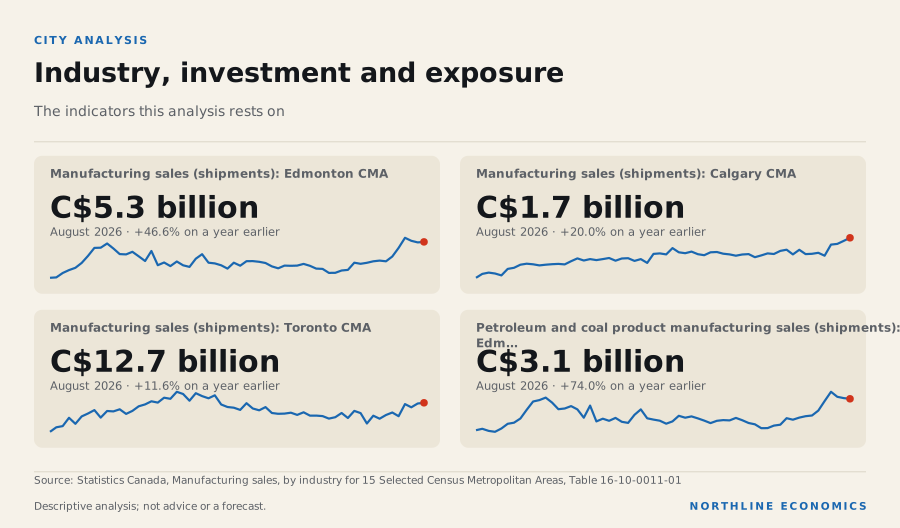
    Petroleum and coal products are 58.8% of Edmonton's manufacturing shipments in August 2026, when shipments were up 46.6% on a year earlier

    Graphic: Industry, investment and exposureIndustry, investment and exposure. Manufacturing sales (shipments): Edmonton CMA C$5.3 billion (August…

    What happened

    Edmonton manufacturing shipments were C$5.3 billion in August 2026, 46.6% above a year earlier and 71.3% above December 2019, against 20.0% over the year in Calgary and 11.6% in Toronto. Petroleum and coal product manufacturing alone was C$3.1 billion of that, 69.9% higher than in August 2025, or 58.8% of the metropolitan total (in Toronto the same share is 2.5%).

    Manufacturing shipments by metropolitan area, indexed

    Seasonally adjusted, current dollars (so prices are included); start of the period = 100. Cities whose latest value is suppressed are not shown.

    Chart loads when it comes into view.

    Latest values: Edmonton 5,326,000,000 (2026-08); Calgary 1,720,000,000 (2026-08); Toronto 12,680,000,000 (2026-08); Vancouver 3,594,000,000 (2026-08); and 2 more in the data table.

    Value of building permits by metropolitan area (12-month total)

    Seasonally adjusted, current dollars, all types of building and work. Ottawa–Gatineau is published only for its Ontario and Quebec parts and is not shown.

    Chart loads when it comes into view.

    Latest values: Edmonton 6.99 (2026-08); Calgary 9.156 (2026-08); Toronto 29.27 (2026-08); Vancouver 17.06 (2026-08); and 1 more in the data table.

    Building permits for the metropolitan area (all types) totalled C$7.0 billion over the twelve months to August 2026, -4.6% on the twelve months before.

    Why it happened

    Interpretation

    Most of Edmonton's manufacturing shipments are petroleum and coal products, and current-dollar shipments of those products rise with their prices. Statistics Canada reports that export prices of refined petroleum products were up strongly from a year earlier in August, and that the Industrial Product Price Index rose 14.5% over the year to September. On that reading, much of the rise in Edmonton's shipments is price, not volume. The data held here do not separate price from volume, so the split is not measured.

    Evidence: relationship: World oil price (WTI) and Consumer energy and gasoline prices; Statistics Canada: The Daily: Canadian international merchandise trade, August 2026; Statistics Canada: The Daily: Industrial product and raw materials price indexes, September 2026

    Why it matters

    A metropolitan manufacturing sector dominated by one product group is exposed to that product's price. The Bank of Canada describes national links from oil prices to energy investment and national income, and Alberta has published an estimate of its budget's sensitivity; no evidence here measures how much of Edmonton's output or employment depends on oil prices.

    History

    Edmonton's manufacturing shipments peaked at C$5.6 billion in May 2026, the highest in the past ten years.

    Across geographies

    As provincial context only: in 2025 energy products made up 76% of Alberta's domestic merchandise exports, while the resource group (forestry, fishing, mining, quarrying, oil and gas) employed 5.6% of Alberta's workers and construction 10.0%. These are provincial shares and must not be read as describing Edmonton.

    How much of each province’s employment is in one industry

    Share of provincial employment, 2025 annual average (Labour Force Survey). A measured exposure to an industry, not an estimate of how much output or income depends on it. “Resources” combines forestry, fishing, mining, quarrying and oil and gas.

    Chart loads when it comes into view.

    Top values: Newfoundland and Labrador 6.37%; Alberta 5.58%; Saskatchewan 3.76%.

    What it influences

    Edmonton's manufacturing and construction activity feed local employment and incomes. The explorer records documented exposures for the province and an observed correlation between oil prices and metropolitan employment (see the connections section), none of which is a measured effect on Edmonton.

    Risks

    Not assessed: the exposure of Edmonton employment and output to industry-specific shocks. A fall in refined-product prices would, other things equal, lower current-dollar shipments.

    Historical context

    On 28 October the Bank of Canada said the conflict in the Middle East was in its eighth month with no clear path to resolution, and that new US tariffs were expected to slow growth in the fourth quarter.

    Evidence: Bank of Canada: Bank of Canada raises the policy rate by 25 basis points to 2½% (28 October 2026)

    What to watch

    The monthly manufacturing release and building permits (see the release calendar), and refined-product prices.

    Prepared with AI assistance.

    Follow the relationships

    Upcoming releases

    Sources for this section (2 datasets, 3 documents)

    Data

    Documents cited

    Each dataset is used under its licence; attribution and series-level detail are in each chart’s “About this data” panel. Limitations: Manufacturing sales are current-dollar shipments and move with prices. Annual employment by industry is a Labour Force Survey sample estimate (noisy for small groups) and is in the labour section; wages and output by industry for the Edmonton metropolitan area are not held. Alberta figures are provincial and are context only, never a description of Edmonton. Shipments for some industries and cities are suppressed for confidentiality.

    5.5 · Industry structure (2021 Census)

    What do the people who work in Edmonton do for a living?

    Health care and social assistance was the largest source of Edmonton jobs in 2021 at 15.5%, and Construction was the sector in which Edmonton's share of jobs stood furthest above the other five areas combined

    What happened

    In the 2021 Census, 570 thousand jobs were located in the Edmonton metropolitan area (people who worked at home or had a usual workplace there; people with no fixed workplace address are not in the table). The three largest sectors were Health care and social assistance (15.5% of jobs), Retail trade (12.9%) and Public administration (8.2%).

    Measured as its share of jobs divided by the other five metropolitan areas' combined share (among sectors that make up at least one fiftieth of Edmonton's jobs), the sector in which Edmonton stood furthest above the rest was Construction: 6.0% of its jobs, against 4.9% in Calgary, 3.7% in Toronto, 4.2% in Vancouver, 3.4% in Montréal and 3.6% in Ottawa–Gatineau.

    Jobs by industry sector in six metropolitan areas, 2021 Census

    Share of jobs located in each metropolitan area (persons who worked at home or had a usual place of work there; people with no fixed workplace address are not in the table), May 2021 reference week, pandemic conditions. Industry structure at one date, not current conditions. Shares are computed by this project from the Census counts.

    Chart loads when it comes into view.

    Top values: Edmonton 6%; Calgary 4.9%; Vancouver 4.2%.

    Why it happened

    Not assessed. The table counts jobs by sector at one date and says nothing about why a metropolitan area has the mix it has. Attributed descriptions of Edmonton's industry structure are in the local-economy section of this page.

    Why it matters

    The industry mix shows what a local economy does for a living, which bears on how it is exposed to changes in demand, prices and policy. It does not measure output, wages or how the economy is performing; those need other tables.

    History

    Not available from this table: the Census is taken every five years and the platform holds only the 2021 reference week (May 2021). Annual industry employment for the metropolitan area comes from the Labour Force Survey and is in the labour section of this page.

    Across geographies

    The six metropolitan areas come from one table with one definition, so the shares can be compared with one another. They are shares of jobs located in the area, not of residents' employment, and not comparable with provincial Labour Force Survey industry shares, which use a different survey, year and definition. Alberta is not described here.

    What it influences

    Not assessed. No relationship in the recorded graph links the metropolitan industry mix to another variable.

    Risks

    Historical context

    The reference week was in May 2021, during public-health restrictions: Statistics Canada named retail trade, accommodation and food services, and information, culture and recreation among the industries most affected, and said working from home remained an important adaptation. The data are more than five years old and cannot show what has changed since.

    Evidence: Statistics Canada: The Daily: Labour Force Survey, May 2021

    What to watch

    The release of 2026 Census results on industry for metropolitan areas. No release date for them is in the calendar this site holds, and none is assumed.

    Prepared with AI assistance.

    Follow the relationships

    Sources for this section (1 datasets, 1 documents)

    Data

    Documents cited

    Each dataset is used under its licence; attribution and series-level detail are in each chart’s “About this data” panel. Limitations: Census 2021, one reference week (May 2021) under pandemic conditions; counts are rounded by Statistics Canada. Jobs located in the metropolitan area (at home or usual workplace); people with no fixed workplace address are excluded. Not current conditions and not output, wages or productivity.

    6 · Connections to national and global trends

    How do global oil prices, interest rates and trade policy reach Edmonton, and how well is each link evidenced?

    Oil prices and Edmonton's employment are associated (r = 0.41), barely more than for Toronto (r = 0.37): the association does not show that oil drives Edmonton's jobs

    What happened

    The relationship explorer holds 178 monthly observations that allow Edmonton's employment growth to be compared with the growth of the oil price. Over the sample, 12-month changes in the WTI price and in Edmonton's three-month-average employment are positively correlated at lag zero (r = 0.41), less so six months later (r = 0.25) and 0.13 twelve months later. Calgary's correlations are 0.37 and 0.28 at the same lags, and Toronto's, as a comparison city with little direct oil exposure, are 0.37 and 0.19. Alberta's province-wide employment has a lag-zero correlation of 0.38.

    Crude oil prices

    US dollars per barrel, monthly average (World Bank Pink Sheet). WTI is the benchmark for Canadian light crude; Brent and Dubai are the other main references.

    Chart loads when it comes into view.

    Latest values: Crude oil, WTI 97.7 (2026-10); Crude oil, Brent 125 (2026-10); Crude oil, Dubai 102.7 (2026-10).

    Why this mattersOil prices are set in world markets. They matter for Canadian incomes, provincial budgets and investment through channels that the relationship explorer documents with their evidence.

    Why it happened

    Interpretation

    At lag zero the association for Edmonton is only slightly stronger than for Toronto, and Calgary's is no stronger than Toronto's. Over a period that includes the collapse and recovery of both oil prices and employment in 2020, any two series that fell and rose together will correlate, so the correlation may mainly reflect the shared swing in the national economy. It does not show that oil prices drive Edmonton's employment, and it does not rule it out; it means this data cannot tell.

    Evidence: relationship: World oil price (WTI) and Edmonton; relationship: World oil price (WTI) and Calgary; relationship: World oil price (WTI) and Toronto

    Why it matters

    The evidence in this report is that the simplest data test does not show that Edmonton's employment follows oil over this period, but it is also too coarse to rule that out. Annual employment in the resource group (forestry, fishing, mining, quarrying, oil and gas) is held for the metropolitan area, at 2.7% of employment in 2025, but it is a sample estimate and no monthly series separates energy-related jobs.

    History

    The correlations above use all months for which both series exist; they are not a statement about any single episode such as the 2014–16 price collapse. This report does not test individual episodes.

    Across geographies

    Historical context

    The Bank of Canada said in 2015 that the fall in oil prices would reduce aggregate income and that business investment in the oil and gas sector was expected to fall, and observed that a large share of what the Alberta oil sands industry buys comes from other provinces. This is a national statement about a past episode and names no city.

    Evidence: Bank of Canada: Rhys Mendes, Opening Statement before the House of Commons Standing Committee on Finance, 12 March 2015

    The provincial links are the Alberta government's published sensitivity of its finances to the WTI price (the Budget 2026 fiscal plan puts the net fiscal impact of a fall of one US dollar a barrel at about $680 million over a full year) and the measured shares of Alberta's exports in 2025 (76% energy, 85% to the United States). How much of that reaches Edmonton is not estimated.

    What it influences

    Four chains bear on Edmonton, with different evidence: (1) oil price to Alberta's budget to local government and services (a published provincial estimate, and no Edmonton estimate); (2) the Bank of Canada's policy rate to mortgage rates to housing demand (a documented national mechanism; Edmonton's own sensitivity is not measured); (3) federal immigration levels to population growth to housing demand (an accounting relationship nationally, a Statistics Canada statement for the metropolitan area with no measured size, and a hypothesis for rents); (4) US trade policy to exports and manufacturing (a documented exposure at the provincial level; a hypothesis for effects on firms).

    Risks

    Not assessed: the size of any of these effects on Edmonton. The explorer labels each link with its evidence class so that readers can tell what is documented from what is hypothesised.

    What to watch

    New observations on Edmonton employment and the oil price, and the annual employment estimates by industry for the metropolitan area.

    Prepared with AI assistance.

    Follow the relationships

    Upcoming releases

    Sources for this section (1 datasets, 2 documents)

    Data

    Documents cited

    Each dataset is used under its licence; attribution and series-level detail are in each chart’s “About this data” panel. Limitations: Edmonton-specific evidence is thin. Most recorded relationships are national or provincial, and highlighting a province or a path in the explorer is not a measured effect on Edmonton. The only Edmonton-specific quantity in the relationship graph is a correlation of 12-month changes at four lags, which is descriptive, uses overlapping windows and shares a business-cycle driver with the comparison city.

    What is missing

    What this page does not cover

    Stated plainly rather than hidden.

    Data requirements

    Output and wages by industry for the metropolitan area
    Annual employment by industry group (Labour Force Survey, table 14-10-0468-01), the 2021 Census industry mix and total metropolitan GDP (annual, no industry detail) are now ingested. Output by industry for the metropolitan area is not, and no wage series for the metropolitan area is held: the open Statistics Canada wage tables cover provinces and Canada, not metropolitan areas.
    not covered
    Resale prices, rents outside purpose-built rental, and household incomes
    Resale data are licensed. Average rent and vacancy for purpose-built rental structures (CMHC Rental Market Survey) are ingested; condominium, house and basement-suite rents and household income tables for the metropolitan area are not.
    not covered
    Commercial real estate, office and industrial markets
    Proprietary sources; licensing required.
    not covered
    Infrastructure, major projects and public investment
    A project is listed only once its source, status and value have been checked.
    not covered
    Municipal finance and policynot covered
    Method and sources

    How this report is built

    Same pipeline, gates and editorial rules as every other page.

    Every number is a reference to a published, licence-checked series for the same geography (ca.ab.cma_edmonton); metropolitan series are never mixed with provincial or national ones. Statistics Canada tables 14-10-0459-01 (labour), 18-10-0004-01 (CPI), 17-10-0148-01 (population), 34-10-0154-01 (starts, completions, under construction; CMHC data), 18-10-0205-01 (new housing price index), 34-10-0292-01 (building permits) and 16-10-0011-01 (manufacturing shipments, six large cities only), 17-10-0149-01 (components of population change), 34-10-0133-01 and 34-10-0130-01 (rents and vacancy, CMHC Rental Market Survey), 36-10-0468-01 (GDP at basic prices) 98-10-0492-01 (2021 Census jobs by industry) and 14-10-0468-01 (annual employment by industry group). Methodology and sources · Editorial policy.