The world economy, read from Canada
A long-form research report on the world economy as it reaches Canada: growth, inflation, central banks, bond and currency markets, trade and tariffs, energy and commodities, industry, labour, debt and risk, with 48 annual World Bank indicators for every economy that reports and monthly or daily data from Eurostat, the European Central Bank, the US Federal Reserve, the UK Office for National Statistics, the US Bureau of Labor Statistics, the Bank of Canada and the World Bank.
What are the main things to understand about the world economy right now, from Canada?
World output grew at a similar pace from 2023 to 2025 with wide differences between economies, inflation has risen again alongside a jump in energy prices, and the central banks that matter most to Canada have all raised rates this year
The picture in one page
World output grew at a similar pace from 2023 to 2025, unevenly across economies. It grew 2.9% in 2025; among the thirteen major economies compared, growth ranged from 7.6% in India to 0.2% in Germany, and euro area GDP was 1.3% higher in Q3 2026 than a year earlier. The year's main change is in prices and policy rather than output: Brent crude averaged US$71.10 a barrel in February and US$125.00 in October 2026, and consumer price inflation in the latest month is 4.0% in the euro area (October 2026), 3.7% in the United States (September 2026), 3.5% in the United Kingdom (September 2026) and 3.1% in Canada (September 2026).
The institutions cited tie the energy move to the conflict in the Middle East. The Bank of Canada's October report says persistent disruptions to oil supply from the Gulf region have led to a sharp increase in crude oil prices, and its 28 October statement says the conflict is in its eighth month with no clear path to resolution. The October report also says higher energy prices are weighing on economic activity, while global growth remains resilient, boosted by strong AI-related investment. The size of either effect is not stated in these sources, and none is estimated here.
Evidence: relationship: Middle East conflict and disrupted energy shipping (2026) and World oil price (WTI); Bank of Canada: Monetary Policy Report, October 2026: Current conditions; Bank of Canada: Bank of Canada raises the policy rate by 25 basis points to 2½% (28 October 2026); Bank of Canada: Monetary Policy Report, October 2026: Global economy
The central banks that matter most to Canada have all raised rates this year: the ECB in June and September, the Federal Reserve in September, the Bank of Canada on 28 October and the Bank of England on 5 November. The ECB and the Federal Reserve then left their rates unchanged in late October. The ECB deposit rate is 2.50%, the US federal funds rate 3.88%, the Bank of Canada's overnight rate 2.50% and the Bank of England's Bank Rate 4%.
Evidence: European Central Bank: Monetary policy decisions, 11 June 2026 (press release); European Central Bank: Monetary policy decisions, 10 September 2026 (press release); Board of Governors of the Federal Reserve System: Federal Reserve issues FOMC statement (16 September 2026); Bank of Canada: Bank of Canada raises the policy rate by 25 basis points to 2½% (28 October 2026); Bank of England: Monetary Policy Summary and minutes of the Monetary Policy Committee meeting ending on 4 November 2026; European Central Bank: Monetary policy statement, 29 October 2026; Board of Governors of the Federal Reserve System: Federal Reserve issues FOMC statement (28 October 2026)
Long-term yields are higher than a year ago in all three markets shown: the US ten-year yield is 4.84%, Canada's 3.67% and the euro area's AAA yield 3.29%.
For Canada, the bond-market channel is the best documented link from abroad: Bank of Canada staff report that Canadian long-term government bond yields tend to closely track US Treasury yields, because global forces heavily influence yields in a small open economy. That is a statement about long-term yields; it does not mean US policy rates set Canadian ones, and the policy-rate link remains an unsupported hypothesis.
Evidence: relationship: US Treasury yields and Government of Canada bond yields; Bank of Canada: The rise in the Canadian term premium in a global context (Sparks at Bank article by Eugene Trostin, James Ketcheson and Antonio Diez de los Rios, March 2026)
The exchange rate is the second channel. A Bank of Canada advisor described in 2016 how a weaker Canadian dollar helps exporters outside the resource sector while raising import prices; one US dollar cost C$1.41 in October 2026. The 2016 statement is a description of a past depreciation and gives no size.
Evidence: Bank of Canada: Opening statement by Stephen Murchison, 3 February 2016; Bank of Canada: Opening statement before the Standing Senate Committee on Banking, Trade and Commerce (Stephen Murchison, Advisor, 3 February 2016)
Trade is the third. The United States is where Canada sells most of what it exports, and in October the Bank of Canada again named Canada's trade relationship with the United States as one of the two most important risks to its inflation outlook; the report on tariffs sets out what is and is not known about product coverage. Beyond these three channels, the relationship explorer shows the links computed from published data, each labelled by the kind of evidence behind it, and the exposure profile shows, city by city, the share of local jobs in the industries these drivers reach.
Evidence: Bank of Canada: Monetary Policy Report, October 2026: Risks; Bank of Canada: Monetary Policy Report, July 2026: Overview
Key findings at a glance
- World output grew 2.9% in 2025, with India at 7.6% and Germany at 0.2%. Euro area GDP was 1.3% higher in Q3 2026 than a year earlier. Growth
- Energy prices jumped in March and remain high. Brent crude averaged US$71.10 a barrel in February and US$125.00 in October 2026; the European gas price is 153.6% above its February level while the US gas price has not risen. Energy
- Inflation has risen again: 4.0% in the euro area, 3.7% in the United States, 3.5% in the United Kingdom and 3.1% in Canada. The figures are for October 2026 in the euro area, September 2026 in the United States, September 2026 in the United Kingdom and September 2026 in Canada. In February the four rates were between 1.8% and 3.0%. Inflation
- The Federal Reserve and the ECB have raised rates this year, and so have the Bank of Canada and the Bank of England. The ECB deposit rate has gone from 2.00% to 2.50% and the US federal funds rate from 3.64% to 3.88%; both banks left their rates unchanged in late October. Canada's overnight rate is 2.50%, after its increase of 28 October, and the Bank of England raised Bank Rate to 4% on 5 November. Central banks
- Long-term government bond yields are higher than a year ago in all three markets shown. The US ten-year yield is 4.84% (to 5 November 2026), Canada's 3.67% (to 5 November 2026) and the euro area's AAA yield 3.29% (to 5 November 2026). The US–Canada gap is 1.17 percentage points. Bonds
- Technology-related goods account for much of the growth in world merchandise trade, according to the WTO's October outlook. The WTO raised its forecast for 2026 merchandise trade volume growth to 3.9% from 1.9%. Canada sends 72% of its goods exports to the United States (customs basis, calendar 2025; the Canada report's monthly balance-of-payments figure differs slightly), where a tariff dispute is under way. Trade · Tariffs
- Labour markets differ: unemployment is 4.2% in the United States, 6.5% in the euro area, 4.7% in the United Kingdom and 6.7% in Canada. These are for September 2026 in the United States, September 2026 in the euro area, July 2026 in the United Kingdom and October 2026 in Canada. Populations are shrinking in Japan (-0.5%) and China (-0.2%), and the share aged 65 and over is 30.0% in Japan and 20.3% in Canada. Labour and demographics
- Canada ranked 5th of 13 in growth and 4th of 13 in GDP per person among thirteen economies in 2025, with output per worker at 72% of the US level. Productivity · Canada in the world
- Central government debt was 130.7% of GDP in the United Kingdom and 115.8% in the United States in 2024, the latest World Bank year. The UK series has an unexplained break between 2021 and 2022, described in the government debt section. Government debt
This report read the WTO's October news release and passages of its full report.
Evidence: World Trade Organization: Global Trade Outlook and Statistics Update (news release, 8 October 2026); World Trade Organization: Global Trade Outlook and Statistics - Update: October 2026 (full report)
The Bank of Canada's October 2026 Monetary Policy Report projects world GDP growth of 3.1 per cent in 2026 and 3.2 per cent in 2027, with economies weighted by their GDP at purchasing-power parity; that is the Bank's projection, not Northline's. Growth
In October the Bank of Canada named the evolution of energy prices and Canada's trade relationship with the United States as the two most important risks to its inflation outlook. This report makes no forecast. Risks
Evidence: Bank of Canada: Monetary Policy Report, October 2026: Risks
What this report does not cover. There is no international comparison of house prices, credit spreads, equity markets, supply-chain pressure or shipping, tariff rates by country, industrial policy, semiconductor or AI investment data, or monthly data for China, Japan or India. Bank of England, Bank of Japan, BIS, OECD and IMF data are not used. Each section says what is missing.
Prepared with AI assistance.
Follow the relationships
- Canada 12 with evidence · 22 recorded Open in Studio
- World oil price (WTI) 16 with evidence · 16 recorded Open in Studio
- US Federal Reserve policy rate 2 with evidence · 2 recorded Open in Studio
- European Central Bank key rates 1 with evidence · 1 recorded Open in Studio
- Bank of Canada policy rate 8 with evidence · 8 recorded Open in Studio
- Middle East conflict and disrupted energy shipping (2026) 1 with evidence · 1 recorded Open in Studio
Upcoming releases
- 2026-12-09 Bank of Canada interest rate announcement · Bank of Canada
- 2026-12-09 FOMC interest rate decision and Summary of Economic Projections · Federal Reserve (FOMC)
- 2026-12-17 ECB monetary policy decision and press conference · European Central Bank
- 2027-01-27 Bank of Canada interest rate announcement and Monetary Policy Report · Bank of Canada
Sources for this section (22 datasets, 16 documents)
Data
- Real GDP, change from the same quarter a year earlier, seasonally and calendar adjusted: Euro area (EA11-1999, EA12-2001, EA13-2007, EA15-2008, EA16-2009, EA17-2011, EA18-2014, EA19-2015, EA20-2023, EA21-2026) (Eurostat namq_10_gdp; 1 series; latest Q3 2026; retrieved 2026-11-05)
- Crude oil, Brent, monthly average price (Pink Sheet (monthly prices); 2 series; latest October 2026; retrieved 2026-11-05)
- Consumer prices, harmonised index (HICP), annual rate of change: Euro area (EA11-1999, EA12-2001, EA13-2007, EA15-2008, EA16-2009, EA17-2011, EA18-2014, EA19-2015, EA20-2023, EA21-2026) (Eurostat prc_hicp_minr; 1 series; latest October 2026; retrieved 2026-11-05)
- US CPI-U, 12-month change (BLS CUUR0000SA0; 1 series; latest September 2026; retrieved 2026-11-05)
- UK CPI, 12-month rate (ONS MM23 / D7G7; 1 series; latest September 2026; retrieved 2026-11-05)
- Consumer Price Index, monthly, not seasonally adjusted (18-10-0004-01; 1 series; latest September 2026; retrieved 2026-10-23)
- ECB deposit facility rate (ECB FM; 1 series; latest 7 November 2026; retrieved 2026-11-07)
- US federal funds effective rate, weekly average (Federal Reserve statistical release H.15; 3 series; latest 4 November 2026; retrieved 2026-11-07)
- Bank of Canada target for the overnight rate (business daily) (V39079; 1 series; latest 5 November 2026; retrieved 2026-11-07)
- Government of Canada benchmark bond yield, 10-year (BD.CDN.10YR.DQ.YLD; 1 series; latest 5 November 2026; retrieved 2026-11-07)
- Euro area AAA-rated government bond yield, 10-year (ECB yield curve) (ECB YC; 1 series; latest 5 November 2026; retrieved 2026-11-07)
- USD/CAD monthly average exchange rate (C$ per 1 USD), counterparty US (FXMUSDCAD; 1 series; latest October 2026; retrieved 2026-11-05)
- US unemployment rate, 16 years and over, seasonally adjusted (BLS LNS14000000; 1 series; latest September 2026; retrieved 2026-11-05)
- Unemployment rate, seasonally adjusted, share of the labour force: Euro area – 21 countries (from 2026) (Eurostat une_rt_m; 1 series; latest September 2026; retrieved 2026-11-05)
- UK unemployment rate, aged 16 and over, seasonally adjusted (ONS LMS / MGSX; 1 series; latest July 2026; retrieved 2026-11-05)
- Labour force characteristics, monthly, seasonally adjusted and trend-cycle (14-10-0287-01; 1 series; latest October 2026; retrieved 2026-11-07)
- GDP growth (annual %) (all economies; World Bank) (WDI NY.GDP.MKTP.KD.ZG; series; latest annual; retrieved 2026-10-23)
- Population growth (annual %) (all economies; World Bank) (WDI SP.POP.GROW; series; latest annual; retrieved 2026-10-23)
- Population ages 65 and above (% of total population) (all economies; World Bank) (WDI SP.POP.65UP.TO.ZS; series; latest annual; retrieved 2026-10-23)
- GDP per capita, PPP (constant 2021 international $) (all economies; World Bank) (WDI NY.GDP.PCAP.PP.KD; series; latest annual; retrieved 2026-10-23)
- GDP per person employed (constant 2021 PPP $) (all economies; World Bank) (WDI SL.GDP.PCAP.EM.KD; series; latest annual; retrieved 2026-10-23)
- Central government debt, total (% of GDP) (all economies; World Bank) (WDI GC.DOD.TOTL.GD.ZS; series; latest annual; retrieved 2026-10-23)
Documents cited
- Bank of Canada: Monetary Policy Report, October 2026: Current conditions (retrieved 2026-11-07)
- Bank of Canada: Bank of Canada raises the policy rate by 25 basis points to 2½% (28 October 2026) (retrieved 2026-11-07)
- Bank of Canada: Monetary Policy Report, October 2026: Global economy (retrieved 2026-11-07)
- European Central Bank: Monetary policy decisions, 11 June 2026 (press release) (retrieved 2026-10-23)
- European Central Bank: Monetary policy decisions, 10 September 2026 (press release) (retrieved 2026-10-25)
- Board of Governors of the Federal Reserve System: Federal Reserve issues FOMC statement (16 September 2026) (retrieved 2026-11-07)
- Bank of England: Monetary Policy Summary and minutes of the Monetary Policy Committee meeting ending on 4 November 2026 (retrieved 2026-11-06)
- European Central Bank: Monetary policy statement, 29 October 2026 (retrieved 2026-11-06)
- Board of Governors of the Federal Reserve System: Federal Reserve issues FOMC statement (28 October 2026) (retrieved 2026-11-03)
- Bank of Canada: The rise in the Canadian term premium in a global context (Sparks at Bank article by Eugene Trostin, James Ketcheson and Antonio Diez de los Rios, March 2026) (retrieved 2026-11-07)
- Bank of Canada: Opening statement before the Standing Senate Committee on Banking, Trade and Commerce (Stephen Murchison, Advisor, 3 February 2016) (retrieved 2026-10-24)
- Bank of Canada: Monetary Policy Report, October 2026: Risks (retrieved 2026-11-07)
- Bank of Canada: Monetary Policy Report, July 2026: Overview (retrieved 2026-10-25)
- World Trade Organization: Global Trade Outlook and Statistics Update (news release, 8 October 2026) (retrieved 2026-10-25)
- World Trade Organization: Global Trade Outlook and Statistics - Update: October 2026 (full report) (retrieved 2026-11-07)
- Bank of Canada: Monetary Policy Report, October 2026: Projections (Table 2, Canada; Table 4, projection for global economic growth) (retrieved 2026-11-07)
Each dataset is used under its licence; attribution and series-level detail are in each chart’s “About this data” panel. Limitations: Findings summarise the sections that follow and inherit their limitations. No forecast is made: forecasts are quoted only as other institutions', from their own publications. IMF datasets and projections are not included.
Headline indicators
Latest published value, with the year shown on each tile.
Fifteen economies side by side
Latest year available for each cell (shown small). The European Union and the euro area are separate entries and overlap with Germany and France.
| Economy | GDP (US$) | Growth | GDP per capita (PPP) | Inflation | Unemployment | Trade / GDP | Govt debt / GDP | Population |
|---|---|---|---|---|---|---|---|---|
| United States | $30.8T 25 | 2.2% 25 | $76,931 25 | 2.9% 24 | 4.2% 25 | 25% 24 | 116% 24 | 342M 25 |
| China | $19.5T 25 | 5.0% 25 | $25,067 25 | 0.1% 25 | 4.6% 25 | 38% 25 | – | 1407M 25 |
| European Union | $21.2T 25 | 1.5% 25 | $55,087 25 | 2.5% 25 | 5.9% 25 | 90% 25 | – | 451M 25 |
| Euro area | $18.0T 25 | 1.4% 25 | $56,677 25 | 2.5% 25 | 6.3% 25 | 87% 25 | – | 359M 25 |
| Japan | $4.4T 25 | 1.2% 25 | $48,283 25 | 3.2% 25 | 2.5% 25 | 45% 24 | – | 123M 25 |
| India | $4.0T 25 | 7.6% 25 | $10,039 25 | 2.4% 25 | 4.2% 25 | 46% 25 | 47% 18 | 1464M 25 |
| United Kingdom | $4.0T 25 | 1.4% 25 | $53,993 25 | 3.9% 25 | 4.7% 25 | 62% 25 | 131% 24 | 69M 25 |
| South Korea | $1.9T 25 | 1.0% 25 | $55,697 25 | 2.1% 25 | 2.7% 25 | 86% 25 | 48% 24 | 52M 25 |
| Germany | $5.1T 25 | 0.2% 25 | $62,824 25 | 2.2% 25 | 3.7% 25 | 79% 25 | 21% 90 | 83M 25 |
| France | $3.4T 25 | 0.8% 25 | $55,125 25 | 0.9% 25 | 7.5% 25 | 67% 25 | – | 69M 25 |
| Canada | $2.3T 25 | 1.7% 25 | $57,990 25 | 2.1% 25 | 6.9% 25 | 64% 25 | 64% 24 | 42M 25 |
| Brazil | $2.3T 25 | 2.3% 25 | $20,025 25 | 5.0% 25 | 6.0% 25 | 35% 25 | 82% 24 | 213M 25 |
| Mexico | $1.8T 25 | 0.6% 25 | $21,912 25 | 3.8% 25 | 2.7% 25 | 80% 25 | 50% 24 | 132M 25 |
| Indonesia | $1.4T 25 | 5.1% 25 | $15,091 25 | 1.9% 25 | 3.2% 25 | 43% 25 | 30% 09 | 286M 25 |
| Australia | $1.8T 25 | 1.4% 25 | $60,194 25 | 2.9% 25 | 4.1% 25 | 46% 25 | 58% 22 | 28M 25 |
Definitions differ by country; unemployment is a modelled ILO estimate, government debt is central government. "–" means the World Bank database has no value. Open any economy for its profile; every country with data has one.
Explore the world, then follow links into Canada
Choose a layer, then a country, from the map or from the list. The panel shows its profile and its recorded relationships with Canada.
World map: latest value of one indicator
Natural Earth boundaries (public domain); World Bank data. Years differ by country.
The map loads when it comes into view.
Data table for this layer (keyboard and screen-reader alternative)
An optional globe view shares these layers. Why a flat map, not a globe: a 2D map is faster, works on every phone, supports keyboard and screen-reader alternatives, and does not hide half the world. Natural Earth draws de facto boundaries; contested borders reflect that dataset’s conventions, not an endorsement.
How fast is the world economy growing, which economies are driving it, and who is getting richer?
World output grew 2.9% in 2025, with India at 7.6% and China at 5.0% far ahead of Germany at 0.2%
What happened
World real GDP grew 2.9% in 2025, according to World Bank data, close to the pace of the two previous years (2.9% in 2024 and 2.9% in 2023). Growth among the major economies was uneven. India grew 7.6% (ranked 1st of 13 in growth among the economies compared here), China 5.0%, the United States 2.2%, Brazil 2.3% and Canada 1.7%. At the other end, the euro area grew 1.4%, the United Kingdom 1.4%, Australia 1.4%, Japan 1.2%, South Korea 1.0%, France 0.8%, Mexico 0.6% and Germany 0.2%.
Real GDP growth in the world’s major economies
Annual percent change in constant-price GDP. Canada is emphasised; the world aggregate and the EU are dashed.
Chart loads when it comes into view.
Latest values: Canada 1.743 (2025); United States 2.161 (2025); China 4.96 (2025); Japan 1.193 (2025); and 11 more in the data table.
Related relationships: United States · China · European Union · United Kingdom
More recent quarterly data for Europe show a modest picture. Euro area real GDP was 1.3% higher in Q3 2026 than a year earlier, with Germany at 1.2%, France at -0.1%, Italy at 0.8% and Spain at 2.7%. UK real GDP changed by 0.5% from the previous quarter in Q2 2026.
Real GDP growth in the euro area’s largest economies, year on year
Percent change from the same quarter a year earlier, seasonally and calendar adjusted (Eurostat).
Chart loads when it comes into view.
Latest values: Euro area 1.3 (2026 Q3); Germany 1.2 (2026 Q3); France -0.1 (2026 Q3); Italy 0.8 (2026 Q3); and 1 more in the data table.
Related relationships: Euro area
The size of the economies differs by the measure used. At market exchange rates the United States produced US$30.8 trillion in 2025, China US$19.5 trillion, the euro area US$18.0 trillion and Canada US$2.3 trillion. At purchasing-power parity, which adjusts for differences in local prices, China's output was 134% of the US level, against 63% at market exchange rates.
Size of the major economies: GDP in current US dollars
Trillions of US dollars at market exchange rates. Market-rate comparisons move with exchange rates; see the PPP chart below.
Chart loads when it comes into view.
Latest values: Canada 2.32 (2025); United States 30.77 (2025); China 19.5 (2025); European Union 21.24 (2025); and 8 more in the data table.
Related relationships: United States · China · European Union · United Kingdom
Size at purchasing-power parity
Trillions of constant 2021 international dollars.
Chart loads when it comes into view.
Latest values: Canada 2.415 (2025); United States 26.29 (2025); China 35.26 (2025); India 14.7 (2025); and 8 more in the data table.
Related relationships: United States · China · United Kingdom · Japan
Why it happened
The Bank of Canada's October 2026 Monetary Policy Report projects world GDP growth of 3.1 per cent in 2026 and 3.2 per cent in 2027, and says growth is projected to pick up in the second half of 2026 and stabilize at around 3% through 2028. Its table gives each economy's share of world GDP at purchasing-power parity, a different basis from the World Bank's market-rate figures above: it puts world growth in 2025 at 3.5 per cent, against the World Bank's 2.9%. The Bank says investment related to artificial intelligence continues to support activity in the United States and parts of Asia, while high energy costs weigh on growth in the euro area and other energy-importing economies.
Evidence: Bank of Canada: Monetary Policy Report, October 2026: Projections (Table 2, Canada; Table 4, projection for global economic growth); Bank of Canada: Monetary Policy Report, October 2026: Global economy
For the economies it shows separately, the Bank projects real GDP growth in 2026 (and 2027) of 2.4 (2.5) per cent in the United States, 0.9 (1.2) per cent in the euro area, 4.6 (4.2) per cent in China and 1.0 (2.0) per cent in Canada. These are the Bank of Canada's projections, not observations and not Northline's, and they differ in definition and timing from the World Bank's annual outturns shown elsewhere in this section. Projections for the other economies in this section are not given here.
According to the World Trade Organization's October 2026 outlook release, demand for AI-enabling goods such as semiconductors and servers accounted for 47% of the growth in world merchandise trade in the first half of 2026, and the WTO raised its forecast for 2026 merchandise trade volume growth to 3.9% from 1.9% in March.
Evidence: World Trade Organization: Global Trade Outlook and Statistics Update (news release, 8 October 2026)
The annual data in this section cannot say why countries grew at different speeds. They show only the outcome. India (ranked 1st of 13 by population in the sample) has 1.46 billion people and a population growth rate of 0.9%, against -0.5% in Japan, so, arithmetically, some of the gap between fast and slow growth in total output reflects population growth. Growth per person is shown in the living-standards figures below.
Why it matters
Global growth is one influence on the demand that Canadian exporters face and on the prices of what they sell. When the United States, the euro area and China grow at different speeds, the mix of demand for Canada's exports can change.
The most relevant contrast for Canada in the current data is between the United States, the destination of 72% of Canada's merchandise exports in 2025 (customs basis), where growth was 2.2%, and Germany and France, where it was 0.2% and 0.8%.
History
Growth fell sharply in 2020 and rebounded in 2021 in every economy compared here. World growth was -2.9% in 2020 and 6.5% in 2021. The euro area then grew faster than the United States in 2022 (3.7% against 2.5%); from 2023 US growth was ahead of the euro area's by a narrowing margin: the United States grew 2.9%, 2.8% and 2.2% over 2023–2025 while the euro area grew 0.5%, 0.9% and 1.4%, and Germany -0.9%, -0.5% and 0.2%.
Living standards have risen at very different speeds. GDP per person at purchasing-power parity, in constant 2021 international dollars, was $76,931 in the United States in 2025, up 39.8% since 2000. Canada's was $57,990, up 19.8% over the same 25 years, and equal to 75% of the US level. South Korea's rose 110.9% to $55,697, China's 516.5% to $25,067 and India's 233.5% to $10,039.
Living standards: GDP per capita at purchasing-power parity
Constant 2021 international dollars per person.
Chart loads when it comes into view.
Latest values: Canada 57,990 (2025); United States 76,930 (2025); China 25,070 (2025); Japan 48,280 (2025); and 9 more in the data table.
Related relationships: United States · China · United Kingdom · Japan
Across geographies
Among the thirteen economies compared, Canada's 2025 growth ranks 5th of 13, and its GDP per person ranks 4th of 13. The euro area aggregate is included in the ranking and overlaps with Germany and France. Rankings are descriptive: they say nothing about policy.
Growth by income group
World Bank income classification (high, upper-middle, lower-middle, low income), not the IMF’s "advanced economies".
Chart loads when it comes into view.
Latest values: World 2.921 (2025); High income 1.907 (2025); Upper-middle income 4.205 (2025); Lower-middle income 5.962 (2025); and 1 more in the data table.
Growth in GDP per capita
Annual percent change, constant prices.
Chart loads when it comes into view.
Latest values: Canada 0.792 (2025); United States 1.629 (2025); China 5.138 (2025); Japan 1.692 (2025); and 10 more in the data table.
Related relationships: United States · China · United Kingdom · Japan
What it influences
Most of Canada's merchandise exports go to the United States (72% in 2025), so US demand is the largest single external source of demand for Canadian goods; the shares for China and the European Union are documented in the trade section of the Canada report. The links from partner growth to specific Canadian provinces and industries are shown in the relationship explorer, where each is labelled by the kind of evidence behind it.
Evidence: relationship: Canada and United States; relationship: Canada and China; relationship: Canada and European Union
Risks
In its list of risks to its outlook for Canadian inflation, the Bank of Canada's October report names developments abroad in both directions. Further supply disruptions could push fuel prices higher than projected, while the conflict in the Middle East could be resolved quickly and oil shipments from the region return to normal sooner. Further US trade restrictions or more persistent uncertainty could weaken exports, business investment and household spending. Global financial conditions could tighten more than expected, and investors could become less optimistic about earnings and productivity gains related to artificial intelligence. This report cannot measure how large any of these is; the Bank's projections quoted above are its central expectation.
Evidence: Bank of Canada: Monetary Policy Report, October 2026: Risks
What to watch
Quarterly growth for the euro area and the United Kingdom is among the hard data in this report with the shortest delay; forward release dates for Eurostat and the ONS are not held here. The Bank of Canada's next Monetary Policy Report, due with its announcement of 27 January 2027, will update the projections quoted here; the IMF's World Economic Outlook and the OECD's economic outlook are not included.
Prepared with AI assistance.
Follow the relationships
- World economic growth 0 with evidence · 0 recorded Open in Studio
- United States 12 with evidence · 12 recorded Open in Studio
- China 2 with evidence · 2 recorded Open in Studio
- European Union 2 with evidence · 2 recorded Open in Studio
- Euro area 2 with evidence · 2 recorded Open in Studio
- United Kingdom 3 with evidence · 3 recorded Open in Studio
- Canada 12 with evidence · 22 recorded Open in Studio
- Middle East conflict and disrupted energy shipping (2026) 1 with evidence · 1 recorded Open in Studio
Sources for this section (8 datasets, 4 documents)
Data
- Real GDP, change from the same quarter a year earlier, seasonally and calendar adjusted: Euro area (EA11-1999, EA12-2001, EA13-2007, EA15-2008, EA16-2009, EA17-2011, EA18-2014, EA19-2015, EA20-2023, EA21-2026) (Eurostat namq_10_gdp; 5 series; latest Q3 2026; retrieved 2026-11-05)
- UK real GDP, quarter-on-quarter growth, seasonally adjusted (ONS QNA / IHYQ; 1 series; latest Q2 2026; retrieved 2026-11-05)
- GDP growth (annual %) (all economies; World Bank) (WDI NY.GDP.MKTP.KD.ZG; series; latest annual; retrieved 2026-10-23)
- GDP (current US$) (all economies; World Bank) (WDI NY.GDP.MKTP.CD; series; latest annual; retrieved 2026-10-23)
- GDP, PPP (constant 2021 international $) (all economies; World Bank) (WDI NY.GDP.MKTP.PP.KD; series; latest annual; retrieved 2026-10-23)
- Population, total (all economies; World Bank) (WDI SP.POP.TOTL; series; latest annual; retrieved 2026-10-23)
- Population growth (annual %) (all economies; World Bank) (WDI SP.POP.GROW; series; latest annual; retrieved 2026-10-23)
- GDP per capita, PPP (constant 2021 international $) (all economies; World Bank) (WDI NY.GDP.PCAP.PP.KD; series; latest annual; retrieved 2026-10-23)
Documents cited
- Bank of Canada: Monetary Policy Report, October 2026: Projections (Table 2, Canada; Table 4, projection for global economic growth) (retrieved 2026-11-07)
- Bank of Canada: Monetary Policy Report, October 2026: Global economy (retrieved 2026-11-07)
- World Trade Organization: Global Trade Outlook and Statistics Update (news release, 8 October 2026) (retrieved 2026-10-25)
- Bank of Canada: Monetary Policy Report, October 2026: Risks (retrieved 2026-11-07)
Each dataset is used under its licence; attribution and series-level detail are in each chart’s “About this data” panel. Limitations: Annual data come from the World Bank and run to 2025 at best; the latest year differs by economy and indicator. Quarterly euro area and United Kingdom data are from Eurostat and the UK Office for National Statistics. US quarterly GDP is not shown. IMF datasets, projections and classification of advanced economies are not used. The projections quoted are the Bank of Canada's, for the world, the United States, the euro area, China and Canada only. GDP in US dollars at market exchange rates moves with exchange rates; purchasing-power-parity (PPP) values do not. The euro area and the European Union overlap with Germany and France.
How productive are the major economies, and where does Canada stand?
Output per worker in Canada is 72% of the US level, and the gap has widened since 2000
What happened
Output per person employed, in constant 2021 international dollars, was $156,983 in the United States in 2025, $125,086 in Germany, $128,587 in France, $114,582 in Australia, $113,563 in Canada, $111,234 in the United Kingdom, $99,046 in South Korea and $87,888 in Japan. China's was $48,126 and India's $24,842. Canada ranks 6th of 13 on this measure among the thirteen economies compared here (the euro area aggregate is counted alongside Germany and France).
Output per worker
GDP per person employed, constant 2021 PPP US dollars.
Chart loads when it comes into view.
Latest values: Canada 113,600 (2025); United States 157,000 (2025); China 48,130 (2025); Japan 87,890 (2025); and 9 more in the data table.
Related relationships: United States · China · United Kingdom · Japan
Why it happened
The World Bank data record levels, not causes. Differences in output per worker reflect many things at once: how much capital each worker uses, the skills of the workforce, the industries in which people work, natural-resource income and how output is measured.
The Bank of Canada says that productivity measures how much is produced in a set amount of time, and that high productivity helps raise the standard of living and keep the economy competitive. It does not, in the passages read, explain the gap between Canada and the United States, and this report does not either.
Two structural indicators are available for the same economies. Research and development spending was 3.4% of GDP in the United States in 2023, 4.9% in South Korea, 3.4% in Japan, 3.2% in Germany and 1.8% in Canada (2024). Gross capital formation, the closest World Bank measure of investment, was 23.2% of GDP in Canada (2025) against 21.5% in the United States (2024).
Research and development spending
Percent of GDP.
Chart loads when it comes into view.
Latest values: Canada 1.791 (2024); United States 3.447 (2023); China 2.577 (2023); Japan 3.441 (2023); and 9 more in the data table.
Related relationships: United States · China · United Kingdom · Japan
Why it matters
Output per worker is what pays for wages and, over long periods, for living standards. An economy can raise total output by employing more people, as Canada's population growth has done, or by raising output per person employed. Adding workers raises total output but does not by itself raise output per worker.
History
Canada's output per worker rose 15.3% between 2000 and 2025. The United States' rose 42.8% over the same years, Germany's 12.8%, Australia's 19.4%, South Korea's 72.8%, and China's 541.0%. Canada's level relative to the US was 72% in 2025. In 2000 Canada's output per worker was $98,476 and the US figure $109,946.
Across geographies
Mexico's output per worker ($48,141) was lower in 2025 than in 2000 ($53,742), unlike the other economies in the sample. The services share of the economy, 64.1% of GDP in Canada (2022), compares with 76.3% in the United States (2021); manufacturing contributes 9.3% in Canada (2022), 17.6% in Germany, 27.4% in South Korea and 24.7% in China. The reference years differ: the most recent Canadian values for these two structural indicators are older than the Korean and Chinese ones.
Manufacturing value added
Percent of GDP.
Chart loads when it comes into view.
Latest values: Canada 9.324 (2022); United States 10.53 (2021); China 24.73 (2025); Japan 18.82 (2024); and 9 more in the data table.
Related relationships: United States · China · United Kingdom · Japan
What it influences
The Bank of Canada says the average wage tends to rise at about the same rate as inflation plus the rate at which labour productivity grows. The national productivity and hourly-compensation data for Canada are in the Canada report.
Evidence: Bank of Canada: Making cents of wages
A Bank of Canada staff paper assumes that under its baseline AI raises total factor productivity by 2 percentage points cumulatively over ten years, and that, as with earlier information and communication technology, AI adoption will translate into more muted productivity gains in Canada than in the United States.
Evidence: Bank of Canada: Potential output in Canada: 2026 assessment (Staff Analytical Paper 2026-19)
A Bank of Canada speech says the share of Canadian businesses using AI quadrupled from about 3% in 2022 to around 12% in 2025, that AI has the potential to boost productivity and raise living standards, and that there is no evidence yet that AI is replacing workers on a large scale.
Evidence: Bank of Canada: AI is knocking: Canada's next productivity story (remarks by Michelle Alexopoulos)
Statistics Canada reports that business labour productivity rose 1.0% in the second quarter of 2026.
Risks
A possible risk, not measured here, is that artificial intelligence and related technologies widen gaps between economies that adopt them quickly and those that do not. This report has no adoption data for artificial intelligence or other technologies and does not rank economies on them.
What to watch
Statistics Canada's quarterly productivity release and national accounts update the Canadian side of the comparison; the equivalent releases for the United States come from the Bureau of Labor Statistics. Cross-country comparisons update only when the World Bank refreshes its database, a few times a year.
Prepared with AI assistance.
Follow the relationships
- Labour productivity 0 with evidence · 0 recorded Open in Studio
- Canada 12 with evidence · 22 recorded Open in Studio
- United States 12 with evidence · 12 recorded Open in Studio
Sources for this section (5 datasets, 5 documents)
Data
- GDP per person employed (constant 2021 PPP $) (all economies; World Bank) (WDI SL.GDP.PCAP.EM.KD; series; latest annual; retrieved 2026-10-23)
- Research and development expenditure (% of GDP) (all economies; World Bank) (WDI GB.XPD.RSDV.GD.ZS; series; latest annual; retrieved 2026-10-23)
- Gross capital formation (% of GDP) (all economies; World Bank) (WDI NE.GDI.TOTL.ZS; series; latest annual; retrieved 2026-10-23)
- Services, value added (% of GDP) (all economies; World Bank) (WDI NV.SRV.TOTL.ZS; series; latest annual; retrieved 2026-10-23)
- Manufacturing, value added (% of GDP) (all economies; World Bank) (WDI NV.IND.MANF.ZS; series; latest annual; retrieved 2026-10-23)
Documents cited
- Bank of Canada: Understanding productivity (retrieved 2026-10-22)
- Bank of Canada: Making cents of wages (retrieved 2026-10-22)
- Bank of Canada: Potential output in Canada: 2026 assessment (Staff Analytical Paper 2026-19) (retrieved 2026-10-25)
- Bank of Canada: AI is knocking: Canada's next productivity story (remarks by Michelle Alexopoulos) (retrieved 2026-10-25)
- Statistics Canada: The Daily: Labour productivity, hourly compensation and unit labour cost, second quarter 2026 (retrieved 2026-10-25)
Each dataset is used under its licence; attribution and series-level detail are in each chart’s “About this data” panel. Limitations: Output per person employed is a rough productivity measure. Hours worked, the quality of jobs, capital, natural resources and the mix of industries all affect it, and the World Bank series are modelled estimates for several economies. The latest year differs by indicator (research spending is older than output per worker). Hourly productivity from national statistical agencies, which would be a better measure, is not included for other countries; the OECD productivity database is not used. Comparisons of levels across economies at purchasing-power parity are approximate.
Is inflation back, and where is it hitting hardest?
Inflation has risen again in 2026; in the latest month for each it was 4.0% in the euro area, 3.7% in the United States, 3.5% in the United Kingdom and 3.1% in Canada
What happened
Consumer price inflation has moved up in 2026 in all four advanced economies shown here. In October 2026 the euro area's HICP was 4.0% above its year-earlier level. The rates were 3.7% for the United States' CPI-U in September 2026, 3.5% for the United Kingdom's CPI in September 2026 and 3.1% for Canada's CPI in September 2026. In February, before the energy-price jump, the rates were 1.9% in the euro area, 2.4% in the United States, 3.0% in the United Kingdom and 1.8% in Canada.
Consumer price inflation, latest months: United States, euro area, United Kingdom and Canada
Annual rate of change, monthly. National definitions differ (CPI-U in the United States, HICP in the euro area, CPI in the United Kingdom and Canada), so compare direction and timing rather than decimals.
Chart loads when it comes into view.
Latest values: United States (CPI-U) 3.74 (2026-09); Euro area (HICP) 4 (2026-10); United Kingdom (CPI) 3.5 (2026-09); Canada (CPI) 3.09 (2026-09).
Related relationships: United States · United Kingdom · Canada · Consumer price inflation · 4 relationships use this data as evidence
Within the euro area the rise is broad. The latest rates are 2.8% in Germany, 3.8% in France, 5.6% in Italy and 4.9% in Spain.
Euro area inflation: harmonised index of consumer prices
Annual rate of change, monthly (Eurostat). The euro area aggregate is Eurostat’s changing-composition series.
Chart loads when it comes into view.
Latest values: Euro area 4 (2026-10); Germany 2.8 (2026-10); France 3.8 (2026-10); Italy 5.6 (2026-10); and 1 more in the data table.
Related relationships: Euro area · 2 relationships use this data as evidence
Why it happened
Statistics Canada reported that Canada's headline CPI accelerated in September and that gasoline and fuel oil drove the acceleration. In this report's data, world energy prices rose sharply from March: the Brent crude price was US$71.10 a barrel in February, US$120.40 in April and US$125.00 in October 2026. The European natural gas price rose from US$11.24 in February to US$28.50 per million BTU in October 2026, while the US gas price, at US$2.96, was below its February level of US$3.61.
Evidence: Statistics Canada: The Daily: Consumer Price Index, September 2026
The Bank of Canada said on 2 September that the continuing conflict in the Middle East is keeping energy prices high.
Evidence: Bank of Canada: Bank of Canada maintains the policy rate (2 September 2026)
The timing of the rise in inflation, starting in March when oil and European gas prices jumped, fits an energy-price explanation. This report does not estimate the share of the inflation increase due to energy, and a fit in timing is not proof.
Evidence: relationship: World oil price (WTI) and Consumer energy and gasoline prices; relationship: Consumer energy and gasoline prices and Consumer price inflation
Crude oil prices
US dollars per barrel, monthly average (World Bank Pink Sheet). WTI is the benchmark for Canadian light crude; Brent and Dubai are the other main references.
Chart loads when it comes into view.
Latest values: Crude oil, WTI 97.7 (2026-10); Crude oil, Brent 125 (2026-10); Crude oil, Dubai 102.7 (2026-10).
Related relationships: World oil price (WTI) · 10 relationships use this data as evidence
Why it matters
Energy prices feed directly into consumer prices through fuel and heating, and indirectly through transport and production costs. In Canada, the correlation between the 12-month change in the WTI price and the 12-month change in the CPI gasoline index is 0.87 (an association, not a causal estimate). In the euro area the correlation between the 12-month change in the European gas price and the euro area HICP rate is 0.41 when measured over the same months and 0.78 when the HICP rate is compared with the gas price change twelve months earlier. These are descriptive correlations of 12-month changes over the available history, and they do not account for other forces such as demand or wages.
Evidence: relationship: World oil price (WTI) and Consumer energy and gasoline prices; relationship: Consumer energy and gasoline prices and Consumer price inflation; relationship: World oil price (WTI) and Consumer energy and gasoline prices
Purchasing power depends on whether pay grows faster than prices. In the United States, average hourly earnings of private-sector employees rose 3.0% over the year to September 2026, against consumer price inflation of 3.7%, so pay growth was below price inflation.
US jobs and earnings growth
Percent change from a year earlier (derived by Northline from BLS levels): total nonfarm payroll employment and average hourly earnings of private-sector employees.
Chart loads when it comes into view.
Latest values: Payroll employment 0.31 (2026-09); Average hourly earnings 3.02 (2026-09).
Related relationships: United States
History
The 2021–2023 inflation surge is visible in the World Bank's annual data: consumer price inflation (annual average) in 2022 was 8.0% in the United States, 8.5% in the euro area, 7.9% in the United Kingdom and 6.8% in Canada, against 1.8%, 1.4%, 1.7% and 1.9% in 2019. The 2026 monthly rates are well below those peaks. China's annual inflation was 0.1% in 2025 and Japan's 3.2%.
Consumer price inflation
Annual average percent change. Source organisation: IMF International Financial Statistics, distributed by the World Bank.
Chart loads when it comes into view.
Latest values: Canada 2.072 (2025); United States 2.95 (2024); China 0.06 (2025); Japan 3.173 (2025); and 11 more in the data table.
Related relationships: United States · China · European Union · United Kingdom
Across geographies
In the World Bank's annual data, Canada's 2025 inflation rate of 2.1% ranks joint 9th of 12 (highest first) among the economies with data for that year; the United States is excluded because the World Bank had not published its 2025 value. Brazil's rate, 5.0%, ranks 1st of 12 and China's, 0.1%, 12th of 12.
What it influences
Inflation is the stated concern behind the Federal Reserve's September increase, the European Central Bank's increases this year, the Bank of Canada's increase of 28 October and the Bank of England's of 5 November; see the central banks section.
Evidence: Board of Governors of the Federal Reserve System: Federal Reserve issues FOMC statement (16 September 2026); European Central Bank: Monetary policy decisions, 10 September 2026 (press release); Bank of Canada: Bank of Canada raises the policy rate by 25 basis points to 2½% (28 October 2026); Bank of England: Monetary Policy Summary and minutes of the Monetary Policy Committee meeting ending on 4 November 2026
Price rises that persist reduce the real value of savings and of fixed incomes, and raise the cost of living for households that spend a large share of income on fuel, food and housing.
Risks
An energy price that stays high keeps headline inflation high until the rise drops out of the twelve-month comparison; one that falls reverses the contribution. Inflation expectations, wages and trade restrictions can also make price rises more persistent, but this report has no data on expectations and cannot judge the likelihood.
In its October Monetary Policy Report the Bank of Canada named the evolution of energy prices and Canada's trade relationship with the United States as the two most important risks to the inflation outlook.
Evidence: Bank of Canada: Monetary Policy Report, October 2026: Risks
What to watch
Next releases: consumer price indexes for the euro area (Eurostat), the United Kingdom (ONS), the United States (BLS) and Canada (Statistics Canada), and the central bank meetings in the central banks section. Core inflation, which excludes food and energy, is the key missing indicator for the United States and the euro area.
Prepared with AI assistance.
Follow the relationships
- Consumer price inflation 1 with evidence · 1 recorded Open in Studio
- Consumer energy and gasoline prices 3 with evidence · 3 recorded Open in Studio
- World oil price (WTI) 16 with evidence · 16 recorded Open in Studio
- European natural gas price 1 with evidence · 1 recorded Open in Studio
- Middle East conflict and disrupted energy shipping (2026) 1 with evidence · 1 recorded Open in Studio
- Euro area 2 with evidence · 2 recorded Open in Studio
- United States 12 with evidence · 12 recorded Open in Studio
- United Kingdom 3 with evidence · 3 recorded Open in Studio
Upcoming releases
- 2026-11-16 Consumer Price Index October 2026 · Statistics Canada
Sources for this section (7 datasets, 7 documents)
Data
- Consumer prices, harmonised index (HICP), annual rate of change: Euro area (EA11-1999, EA12-2001, EA13-2007, EA15-2008, EA16-2009, EA17-2011, EA18-2014, EA19-2015, EA20-2023, EA21-2026) (Eurostat prc_hicp_minr; 5 series; latest October 2026; retrieved 2026-11-05)
- US CPI-U, 12-month change (BLS CUUR0000SA0; 1 series; latest September 2026; retrieved 2026-11-05)
- UK CPI, 12-month rate (ONS MM23 / D7G7; 1 series; latest September 2026; retrieved 2026-11-05)
- Consumer Price Index, monthly, not seasonally adjusted (18-10-0004-01; 1 series; latest September 2026; retrieved 2026-10-23)
- Crude oil, Brent, monthly average price (Pink Sheet (monthly prices); 3 series; latest October 2026; retrieved 2026-11-05)
- US average hourly earnings, 12-month change (BLS CES0500000003; 1 series; latest September 2026; retrieved 2026-11-05)
- Inflation, consumer prices (annual %) (all economies; World Bank) (WDI FP.CPI.TOTL.ZG; series; latest annual; retrieved 2026-10-23)
Documents cited
- Statistics Canada: The Daily: Consumer Price Index, September 2026 (retrieved 2026-11-07)
- Bank of Canada: Bank of Canada maintains the policy rate (2 September 2026) (retrieved 2026-10-22)
- Board of Governors of the Federal Reserve System: Federal Reserve issues FOMC statement (16 September 2026) (retrieved 2026-11-07)
- European Central Bank: Monetary policy decisions, 10 September 2026 (press release) (retrieved 2026-10-25)
- Bank of Canada: Bank of Canada raises the policy rate by 25 basis points to 2½% (28 October 2026) (retrieved 2026-11-07)
- Bank of England: Monetary Policy Summary and minutes of the Monetary Policy Committee meeting ending on 4 November 2026 (retrieved 2026-11-06)
- Bank of Canada: Monetary Policy Report, October 2026: Risks (retrieved 2026-11-07)
Each dataset is used under its licence; attribution and series-level detail are in each chart’s “About this data” panel. Limitations: Inflation measures differ: the United States uses CPI-U, the euro area and its members the harmonised index of consumer prices (HICP), the United Kingdom and Canada their national CPIs. Their baskets, weights and treatment of housing differ, so levels are only roughly comparable and direction and timing are the safest comparisons. The US series comes from the public BLS interface, which returns data only from January 2024, so US 12-month changes start in January 2025. World Bank annual inflation (average of the year) is a different measure from the monthly 12-month rate. Core inflation for the United States and the euro area is not included.
Where are the major central banks heading, and does Canada follow?
Policy rates in the United States and the euro area are now 3.88% and 2.50% after rises this year; the Bank of Canada raised its rate to 2.50% on 28 October and the Bank of England to 4% on 5 November
What happened
The Bank of Canada's overnight rate target was 2.50% on 5 November 2026, a change of 0.25 percentage points over the past year (measured over 250 business days), all of it from the increase of 28 October. The US federal funds effective rate averaged 3.88% in the latest week (4 November 2026), a change of 0.01 percentage points over the past 52 weeks, because a fall in the effective rate in December 2025 was reversed after the Federal Open Market Committee raised its target range in September. The European Central Bank's deposit facility rate stands at 2.50%, against 2.00% a year earlier, after increases in June and September.
Policy rates: Bank of Canada, Federal Reserve and European Central Bank
Percent. Canada: overnight target (Bank of Canada, daily). United States: federal funds effective rate, weekly average (Federal Reserve H.15). Euro area: deposit facility rate (ECB, daily). Different instruments: compare direction and timing, not decimals.
Chart loads when it comes into view.
Latest values: Canada: policy rate 2.5 (2026-11-05); United States: federal funds effective 3.88 (2026-11-04); Euro area: deposit facility 2.5 (2026-11-07).
Related relationships: US interest rates · Bank of Canada policy rate · US Federal Reserve policy rate · European Central Bank key rates · 10 relationships use this data as evidence
On 16 September the Committee decided to raise the target range for the federal funds rate by a quarter of a percentage point, to 3-3/4 to 4 percent, and said the action would support a timelier return to its 2 percent inflation goal.
On 28 October the Committee decided to maintain the target range at 3-3/4 to 4 percent. Two members, Lisa D. Cook and Beth M. Hammack, voted against because they preferred to raise the target range for the federal funds rate by 1/4 percentage point.
The ECB's Governing Council decided in June, and again on 10 September, to raise its three key interest rates, by 25 basis points at each meeting. The wording comes from the ECB's own press releases; the September release sets the deposit facility rate at 2.50% from 16 September 2026.
Evidence: European Central Bank: Monetary policy decisions, 11 June 2026 (press release); European Central Bank: Monetary policy decisions, 10 September 2026 (press release)
The Bank of Canada left its policy rate unchanged on 2 September.
Evidence: Bank of Canada: Bank of Canada maintains the policy rate (2 September 2026)
It then increased the policy rate by 25 basis points on 28 October, saying it did so to reduce the risk that continuing high energy prices spread broadly to the prices of other goods and services.
Evidence: Bank of Canada: Bank of Canada raises the policy rate by 25 basis points to 2½% (28 October 2026)
On 29 October the ECB's Governing Council decided to keep the three key ECB interest rates unchanged, saying energy prices had continued to rise, posing upside risks to the inflation outlook and downside risks to the growth outlook.
Evidence: European Central Bank: Monetary policy statement, 29 October 2026
On 5 November the Bank of England announced that its Monetary Policy Committee had voted by a majority of 8–1 to raise Bank Rate by 0.25 percentage points, to 4%. One member voted for 4.25%.
Why it happened
The central banks that raised rates point to inflation. In the euro area and the United States measured inflation has risen this year: the euro area harmonised index of consumer prices rose from 1.9% in February to 4.0% in October 2026, and US consumer price inflation went from 2.4% in February to 3.7% in September 2026. Both rises began in March, the month in which the average Brent crude price rose to US$103.70 a barrel, from US$71.10 in February.
Evidence: Board of Governors of the Federal Reserve System: Federal Reserve issues FOMC statement (16 September 2026); European Central Bank: Monetary policy decisions, 10 September 2026 (press release); Bank of Canada: Bank of Canada raises the policy rate by 25 basis points to 2½% (28 October 2026); Bank of England: Monetary Policy Summary and minutes of the Monetary Policy Committee meeting ending on 4 November 2026
Consumer price inflation, latest months: United States, euro area, United Kingdom and Canada
Annual rate of change, monthly. National definitions differ (CPI-U in the United States, HICP in the euro area, CPI in the United Kingdom and Canada), so compare direction and timing rather than decimals.
Chart loads when it comes into view.
Latest values: United States (CPI-U) 3.74 (2026-09); Euro area (HICP) 4 (2026-10); United Kingdom (CPI) 3.5 (2026-09); Canada (CPI) 3.09 (2026-09).
Related relationships: United States · United Kingdom · Canada · Consumer price inflation · 4 relationships use this data as evidence
The sequence is consistent with an energy-price shock raising headline inflation, but this report does not estimate how much of the rise comes from energy. The ECB ties inflation pressures to the conflict and Federal Reserve staff name energy among three causes; neither gives a size.
The minutes of the Federal Reserve's September meeting say US price inflation as measured by the 12-month change in the PCE price index edged up to 3.8 percent in August, which the staff attributed mostly to past tariff increases, higher energy and input costs from geopolitical developments and higher technology-related consumer goods prices tied to the AI buildout, that most participants assessed another increase in the target range would likely be appropriate by year end, and that some participants worried that after more than five years of inflation above 2 percent, elevated inflation could begin to affect expectations and wage- and price-setting.
Evidence: Federal Reserve Board: Minutes of the Federal Open Market Committee, September 15-16, 2026
In September the European Central Bank said the conflict in the Middle East continued to generate inflation pressures that would keep inflation well above target for an extended period, with its staff projecting headline inflation averaging 3.0% in 2026 and growth of 0.9% in 2026, and that it was not pre-committing to a rate path.
Evidence: European Central Bank: Monetary policy decisions, 10 September 2026 (press release)
Its president said the economy had been more resilient than previously projected.
Evidence: European Central Bank: Monetary policy statement with Q&A, 10 September 2026
At its September meeting, before the increase of 5 November, the Bank of England's Monetary Policy Committee voted by a majority of 6–3 to hold Bank Rate at 3.75%, said around 0.7 percentage points of the overshoot of inflation relative to its 2% target came directly from energy prices, mostly motor fuels, that there was little evidence so far of material second-round effects, and that monetary policy could not influence global energy prices but was being set to ensure the adjustment happened in a way that achieved the target.
Evidence: Bank of England: Monetary Policy Summary and Minutes, September 2026
The Committee was divided in September, and the minutes give both views. Six members preferred to hold Bank Rate, concerned about energy prices holding inflation above target for longer but judging that domestic activity and tight financial conditions were restraining inflationary pressures. Three members voted to raise Bank Rate by 0.25 percentage points, to 4%, arguing that a projected surge in inflation would peak in early 2027 just as wage settlements were agreed and that a proactive increase would help anchor inflation expectations.
Evidence: Bank of England: Monetary Policy Summary and Minutes, September 2026
The minutes say that for most members the rise in short-term market interest rates since the conflict began was imparting a broadly sufficient degree of policy restraint; for other members, risk premia were not a substitute for changing the level of Bank Rate, including because they were partly driven by factors not related to the UK economy.
Evidence: Bank of England: Monetary Policy Summary and Minutes, September 2026
On 18 September the Bank of Japan raised its overnight call rate target to around 1.25 percent, said it would continue to raise the policy rate in response to developments in activity, prices and financial conditions, and that real interest rates remained at low levels. On 30 October it kept the target at around 1.25 percent, by an 8-1 vote.
Evidence: Bank of Japan: Change in the Guideline for Money Market Operations, 18 September 2026; Bank of Japan: Statement on Monetary Policy, 30 October 2026
The Bank of Japan's guideline for the overnight call rate was around 1.0 percent after its 16 June decision (a 7-1 vote) and around 1.25 percent after 18 September (a 7-2 vote), so Japan's policy rate was raised twice, in June and September, with a minority of the Policy Board opposed each time.
Evidence: Bank of Japan: Change in the Guideline for Money Market Operations (16 June 2026); Bank of Japan: Change in the Guideline for Money Market Operations, 18 September 2026
In July the Federal Reserve noted that several central banks, including the Bank of Japan, the European Central Bank and the Reserve Bank of Australia, had already responded to higher inflation by raising rates.
The Bank for International Settlements' 2026 annual report says central banks previously expected to ease or hold steady are now expected to raise rates, including in the United States, the euro area, the United Kingdom and Canada.
Evidence: Bank for International Settlements: Annual Economic Report 2026, Chapter I: Progress and peril
Balance sheets also differ. The Federal Reserve's directive of 16 September says to roll over at auction all principal payments from its Treasury holdings, to reinvest agency principal payments into Treasury bills, and, when appropriate, to add to holdings through Treasury bill purchases to maintain an ample level of reserves; as written, the directive describes full reinvestment of Treasury principal and not runoff.
Evidence: Board of Governors of the Federal Reserve System: Implementation Note issued September 16, 2026
The European Central Bank states that it discontinued reinvestments under its asset purchase programme from July 2023, so that the portfolio is expected to decrease as assets reach maturity unless the Governing Council decides otherwise, and that it discontinued reinvestments under its pandemic emergency purchase programme at the end of 2024.
Evidence: European Central Bank: Asset purchase programmes (APP); European Central Bank: Pandemic emergency purchase programme (PEPP)
The Bank of England voted unanimously in September to reduce its stock of gilts held for monetary policy to zero through a multi-year plan, an annual average reduction of £46 billion until the end of 2034, with annual sales of £20 billion alongside maturing gilts. It reports that the Asset Purchase Facility fell from a peak of £895 billion in February 2022 to £488 billion in September 2026, and that over the previous 12 months the stock was reduced by £70 billion, of which £21 billion was through sales.
Evidence: Bank of England: Monetary Policy Summary and Minutes, September 2026
The Bank of Japan decided in June to reduce its planned monthly purchases of Japanese government bonds by about ¥200 billion each calendar quarter until January–March 2027, after which monthly purchases will be about ¥2 trillion, and said that in the case of a rapid rise in long-term interest rates it would respond nimbly, for example by increasing the amount of purchases.
Evidence: Bank of Japan: Plan for the Outright Purchases of Japanese Government Bonds (16 June 2026)
Read together, the sources describe different positions on both levers. The Federal Reserve is reinvesting and expects to add bills; the ECB is allowing its bond portfolios to mature without reinvestment; the Bank of England is shrinking its portfolio by sales as well as maturities on a fixed schedule; the Bank of Japan is tapering purchases and has raised its rate this year. Each statement is the institution's own and none compares itself with the others. Whether these differences explain differences in bond yields is not assessed here; the Bank of England's own estimate of the effect of its quantitative tightening on term premia is in the bond-market section.
The reasons the central banks gave for policy in September also differ in emphasis. The Bank of England attributes about 0.7 percentage points of the 1.1 percentage point overshoot of inflation to direct energy effects, mostly motor fuels; the Federal Reserve staff attribute US inflation mostly to past tariff increases, higher energy and input costs from geopolitical developments and technology-related goods prices tied to the AI buildout; the Bank of Japan points to producer prices reflecting AI-related demand and crude oil prices. These are three different accounts of the source of price pressure, each stated by the institution concerned, and they are not reconciled here.
Why it matters
Policy rates set the cost of short-term borrowing, which feeds through to mortgages and business loans. A central bank that raises rates while another holds also changes the interest-rate gap between currencies, which can move exchange rates; this report shows the rates and the exchange rate but does not estimate the link.
For Canada the question is how far the Bank of Canada moves with the other two central banks charted here, now that it has raised its own rate: the ECB raised in June and September and the Fed in September. The data below show how closely Canadian and US rates have moved together in the past, which is evidence about the past and not a prediction.
History
The Fed's effective rate reached 5.33% on 2 August 2023 (five-year high of the weekly series) and was near zero (0.05%) in mid-2021. The ECB's deposit facility rate was negative until 2022 (-0.50% in June 2021) and peaked at 4.00% on 20 September 2023. The Bank of Canada's rate peaked at 5.00% on 13 July 2023.
The measured association between the changes in the two North American policy rates is strong. Across 191 months since 2010, the correlation between the 12-month change in the federal funds effective rate and the 12-month change in the Bank of Canada's rate is 0.93 when measured over the same months and 0.64 when the Canadian change is compared with the US change six months earlier.
This is an observed association between two series that may both respond to common forces such as global inflation; it is not an estimate that US decisions cause Canadian ones, and the 12-month change comparison is dominated by a few large cycles.
Across geographies
All three central banks charted here have raised rates this year, at different times. Canada's rate rose on 28 October after almost a year without a change. The Fed's effective rate is 3.88% and the ECB's deposit rate 2.50%, against 2.50% for the Bank of Canada's overnight rate, but the instruments differ, as noted above. The Bank of England and Bank of Japan rates are not charted; their decisions are instead described from their own publications in the sections above: the Bank of England held Bank Rate in a 6–3 vote in September and raised it to 4% in an 8–1 vote announced on 5 November, and the Bank of Japan raised its rate in June and September and kept it on 30 October. The ECB raised its rates in June and September and kept them on 29 October, the Fed raised its range in September and kept it on 28 October, and the Bank of Canada raised its own rate on 28 October.
What it influences
The Bank of Canada describes policy rate changes as reaching households first through borrowing costs. If foreign central banks' decisions move Canadian bond yields, Canadian fixed mortgage rates, which are priced off bond yields, can move without any Bank of Canada decision; see the bond-market section.
Evidence: relationship: Bank of Canada policy rate and Prime and posted mortgage rates; relationship: Bank of Canada policy rate and Prime and posted mortgage rates; Bank of Canada: Tiff Macklem, Governor: Monetary policy at work, remarks to CFA Québec (7 February 2023)
Risks
The main risk this section identifies is uncertainty about the right policy path in either direction: tightening into an energy-driven price rise that fades, or holding while inflation expectations drift upward. Neither can be assessed from the data here. In its October 2026 report the Bank of Canada named the evolution of energy prices and Canada’s trade relationship with the United States as the two most important risks to its inflation outlook (see the Canada report), and an unexpected move by the Fed or ECB could affect Canada through yields (the bond-market link documented in the bond section) and through the exchange rate (not measured here).
What to watch
The Bank of Canada announces its next decision on 9 December 2026. The Federal Reserve decides on 9 December, the ECB and the Bank of England on 17 December; see also the release calendar. The relationship between Canadian and US rates in the History section is the main thing to test against the next decisions.
Prepared with AI assistance.
Follow the relationships
- US Federal Reserve policy rate 2 with evidence · 2 recorded Open in Studio
- European Central Bank key rates 1 with evidence · 1 recorded Open in Studio
- Bank of Canada policy rate 8 with evidence · 8 recorded Open in Studio
- US interest rates 0 with evidence · 0 recorded Open in Studio
- US Treasury yields 4 with evidence · 4 recorded Open in Studio
- Euro area government bond yields (AAA) 3 with evidence · 3 recorded Open in Studio
Upcoming releases
- 2026-12-09 Bank of Canada interest rate announcement · Bank of Canada
- 2026-12-09 FOMC interest rate decision and Summary of Economic Projections · Federal Reserve (FOMC)
- 2026-12-17 ECB monetary policy decision and press conference · European Central Bank
- 2027-01-27 Bank of Canada interest rate announcement and Monetary Policy Report · Bank of Canada
Sources for this section (6 datasets, 21 documents)
Data
- Bank of Canada target for the overnight rate (business daily) (V39079; 1 series; latest 5 November 2026; retrieved 2026-11-07)
- US federal funds effective rate, weekly average (Federal Reserve statistical release H.15; 1 series; latest 4 November 2026; retrieved 2026-11-07)
- ECB deposit facility rate (ECB FM; 1 series; latest 7 November 2026; retrieved 2026-11-07)
- Consumer prices, harmonised index (HICP), annual rate of change: Euro area (EA11-1999, EA12-2001, EA13-2007, EA15-2008, EA16-2009, EA17-2011, EA18-2014, EA19-2015, EA20-2023, EA21-2026) (Eurostat prc_hicp_minr; 1 series; latest October 2026; retrieved 2026-11-05)
- US CPI-U, 12-month change (BLS CUUR0000SA0; 1 series; latest September 2026; retrieved 2026-11-05)
- Crude oil, Brent, monthly average price (Pink Sheet (monthly prices); 1 series; latest October 2026; retrieved 2026-11-05)
Documents cited
- Board of Governors of the Federal Reserve System: Federal Reserve issues FOMC statement (16 September 2026) (retrieved 2026-11-07)
- Board of Governors of the Federal Reserve System: Federal Reserve issues FOMC statement (28 October 2026) (retrieved 2026-11-03)
- European Central Bank: Monetary policy decisions, 11 June 2026 (press release) (retrieved 2026-10-23)
- European Central Bank: Monetary policy decisions, 10 September 2026 (press release) (retrieved 2026-10-25)
- Bank of Canada: Bank of Canada maintains the policy rate (2 September 2026) (retrieved 2026-10-22)
- Bank of Canada: Bank of Canada raises the policy rate by 25 basis points to 2½% (28 October 2026) (retrieved 2026-11-07)
- European Central Bank: Monetary policy statement, 29 October 2026 (retrieved 2026-11-06)
- Bank of England: Monetary Policy Summary and minutes of the Monetary Policy Committee meeting ending on 4 November 2026 (retrieved 2026-11-06)
- Federal Reserve Board: Minutes of the Federal Open Market Committee, September 15-16, 2026 (retrieved 2026-11-07)
- European Central Bank: Monetary policy statement with Q&A, 10 September 2026 (retrieved 2026-10-25)
- Bank of England: Monetary Policy Summary and Minutes, September 2026 (retrieved 2026-11-07)
- Bank of Japan: Change in the Guideline for Money Market Operations, 18 September 2026 (retrieved 2026-10-25)
- Bank of Japan: Statement on Monetary Policy, 30 October 2026 (retrieved 2026-11-06)
- Bank of Japan: Change in the Guideline for Money Market Operations (16 June 2026) (retrieved 2026-10-25)
- Federal Reserve Board: Monetary Policy Report - July 2026, Part 1: Recent Economic and Financial Developments (retrieved 2026-10-25)
- Bank for International Settlements: Annual Economic Report 2026, Chapter I: Progress and peril (retrieved 2026-10-25)
- Board of Governors of the Federal Reserve System: Implementation Note issued September 16, 2026 (retrieved 2026-10-25)
- European Central Bank: Asset purchase programmes (APP) (retrieved 2026-10-25)
- European Central Bank: Pandemic emergency purchase programme (PEPP) (retrieved 2026-10-25)
- Bank of Japan: Plan for the Outright Purchases of Japanese Government Bonds (16 June 2026) (retrieved 2026-10-25)
- Bank of Canada: Tiff Macklem, Governor: Monetary policy at work, remarks to CFA Québec (7 February 2023) (retrieved 2026-11-07)
Each dataset is used under its licence; attribution and series-level detail are in each chart’s “About this data” panel. Limitations: The three rates are different instruments: an overnight target (Canada), a market rate steered by a target range (United States, shown here as a weekly average of the effective rate) and a deposit facility rate (euro area). Their levels are not directly comparable and are compared here for direction and timing only. Central bank statements are taken from the institutions' own pages (see the sources). Bank of England and Bank of Japan rates are not charted.
What are governments paying to borrow, and how do world yields reach Canada?
The US ten-year Treasury yield was 4.84% on 5 November 2026, 1.17 percentage points above Canada's, with the euro area's at 3.29%; all three are higher than a year earlier but below their highs of this autumn
What happened
Government bond yields are higher than a year earlier in the three markets this report covers, though below their highs of this autumn. The US ten-year Treasury yield was 4.84% on 5 November 2026, the two-year 4.46% and the thirty-year 5.25%. Canada's ten-year benchmark yield was 3.67% and its two-year 3.17%. The euro area's AAA-rated ten-year yield was 3.29% and its two-year 2.96%.
Over the past year the US ten-year yield rose 0.67 percentage points and the Canadian ten-year rose 0.52 percentage points. The euro area ten-year yield was 3.29%, against 2.74% on 5 November 2025.
Ten-year government bond yields: Canada, United States and euro area
Percent, daily. United States: Treasury constant-maturity yield (Federal Reserve H.15). Canada: Bank of Canada benchmark. Euro area: ECB estimate for AAA-rated central-government bonds, not the Bund and not an average of all members.
Chart loads when it comes into view.
Latest values: Canada 3.67 (2026-11-05); United States 4.84 (2026-11-05); Euro area (AAA) 3.294 (2026-11-05).
Related relationships: Government of Canada bond yields · US Treasury yields · Euro area government bond yields (AAA) · 6 relationships use this data as evidence
Two-year government bond yields: Canada, United States and euro area
Percent, daily. Two-year yields follow expected policy rates more closely than ten-year yields.
Chart loads when it comes into view.
Latest values: Canada 3.17 (2026-11-05); United States 4.46 (2026-11-05); Euro area (AAA) 2.958 (2026-11-05).
Related relationships: Government of Canada bond yields · US Treasury yields · Euro area government bond yields (AAA) · 2 relationships use this data as evidence
The US ten-year yield exceeds Canada's by 1.17 percentage points. The gap was 1.01 percentage points a year earlier, on 5 November 2025.
Ten-year yield gap: United States minus Canada
Percentage points, daily (derived by Northline from Federal Reserve H.15 and Bank of Canada yields). Positive means US yields are higher.
Chart loads when it comes into view.
Latest values: US minus Canada, 10-year 1.17 (2026-11-05).
Why it happened
The Bank of Canada noted in September that financial conditions have tightened since July, with long-term bond yields higher, including in Canada. This report does not itself decompose the move in yields into expected policy rates, inflation compensation and term premia; the sources below give partial accounts.
Evidence: Bank of Canada: Bank of Canada maintains the policy rate (2 September 2026)
The two-year US yield moved from 3.52% on 11 February to 4.46% on 5 November 2026, a period that includes the Federal Reserve's September increase in its target range. The sources below link longer yields to expectations of future policy, inflation and government borrowing; this data cannot attribute the move to any one of them.
The Federal Reserve's September minutes report that nominal Treasury yields rose around 35 basis points across the 2- to 10-year segment between meetings, with changes in inflation compensation accounting for most of the rise in shorter yields and changes in real rates for most of the rise in longer ones, and that corporate bond yields rose roughly in line with Treasuries as spreads narrowed modestly.
Evidence: Federal Reserve Board: Minutes of the Federal Open Market Committee, September 15-16, 2026
The European Central Bank says long-term risk-free rates rose to historically high levels in a synchronised increase in global bond yields, with the GDP-weighted ten-year euro-area sovereign yield rising 45 basis points to 3.9% over its review period.
Evidence: European Central Bank: Economic Bulletin, Issue 6, 2026
Its president described the rise in bond yields as happening across global markets, not a euro-specific issue, and with multiple causes.
Evidence: European Central Bank: Monetary policy statement with Q&A, 10 September 2026
The BIS says expectations of higher-for-longer rates and concerns about fiscal implications raised long-term yields as the conflict dragged on and that unwinding of leveraged positions may also have contributed.
Evidence: Bank for International Settlements: Annual Economic Report 2026, Chapter I: Progress and peril
The Bank of Canada's stability report says that because government deficits have grown investors have had to absorb more debt issuance and have demanded increased compensation, and that hedge funds, which use short-term borrowing and could pull back abruptly, account for over 40% of purchases of Canadian government bonds at auction.
Evidence: Bank of Canada: Financial Stability Report 2026: Financial markets; Bank of Canada: Financial Stability Report 2026: Overall assessment (22 May 2026)
The Bank of Canada's July deliberations note that US yields rose on strong macroeconomic news while Canadian yields were little changed, and that the widening differential contributed to the depreciation of the Canadian dollar. Its October report says yields in Canada have since increased, but by less than in the United States.
Evidence: Bank of Canada: Summary of Governing Council deliberations: Fixed announcement date of July 15, 2026; Bank of Canada: Monetary Policy Report, October 2026: Current conditions
On the balance-sheet side, the Bank of England's minutes say that UK term premia on long-term government bonds have risen since quantitative tightening began in February 2022 by an estimated 200 basis points, primarily reflecting global economic policy uncertainty, high issuance of government bonds across countries and structural changes in the UK bond market that reduced demand for long-term government debt, and that Bank staff estimates suggest quantitative tightening accounted for a modest part of it, around 20-30 basis points. This is one central bank's estimate for one market; no source cited gives a comparable estimate for the United States, the euro area or Japan.
Evidence: Bank of England: Monetary Policy Summary and Minutes, September 2026
Why it matters
Government bond yields are the base on which other borrowing costs are built, and fixed mortgage rates are generally priced off bond yields. In Canadian data, the 12-month change in the ten-year yield and the 12-month change in the posted five-year mortgage rate have a correlation of 0.59 over 190 months, an association rather than a causal estimate. Governments' own interest bills rise with yields as old debt is refinanced.
Evidence: relationship: Government of Canada bond yields and Government finances; relationship: Government of Canada bond yields and Prime and posted mortgage rates
History
The US ten-year yield's highest value over the past ten years in this series was 5.31%, reached on 5 October 2026; its low over the same period was 0.52%. The US curve (ten-year minus two-year) is 0.4 percentage points on the latest reading and reached -1.1 percentage points on 3 July 2023, when short rates exceeded long rates. Canada's curve is 0.5 percentage points.
Slope of the US yield curve
Ten-year minus two-year Treasury yield, percentage points (derived by Northline from H.15). Below zero is an inverted curve.
Chart loads when it comes into view.
Latest values: United States 0.38 (2026-11-05); Canada 0.5 (2026-11-05).
The three markets move together. The correlation between the 12-month change in the US ten-year yield and the 12-month change in Canada's is 0.94 for the same months; between the US and euro area ten-year changes it is 0.79; between the euro area and Canada, 0.79. These coefficients are Northline's own calculations from the published yields (the ECB's euro area curve, the Federal Reserve's H.15 and the Bank of Canada's benchmark yields), not statistics published by those institutions.
Co-movement is expected when markets are integrated, but it does not show which market leads, and common forces such as global inflation move all three.
Evidence: relationship: US Treasury yields and Government of Canada bond yields; Bank of Canada: The rise in the Canadian term premium in a global context (Sparks at Bank article by Eugene Trostin, James Ketcheson and Antonio Diez de los Rios, March 2026)
Across geographies
On the figures above, the United States has the highest yields of the three markets at both two and ten years, Canada is in between and the euro area (AAA subset) is lowest. The instruments are not identical: the euro area series is an estimate for AAA-rated issuers, and Canadian and US yields are for each government's own benchmark bonds. The Bank of England, Bank of Japan and other central-bank bond data are not shown for the reasons in the limitations.
The Bank of England says that after the conflict began gilt and euro-area government bond yields rose by more than US Treasury yields, reflecting concerns over those economies' exposure to imported energy costs, though that trend has since reversed, and that Japanese ten-year government bond yields have risen to levels last seen in 1997, in the context of the Bank of Japan's policy normalisation and the broader global repricing of long-term yields.
Evidence: Bank of England: Financial Stability Report, July 2026
The ECB's stability review adds that Japanese yields have risen significantly to levels comparable with other advanced economies, which could prompt Japanese investors to shift funds back home and so put upward pressure on yields globally, including in the euro area. That is the ECB's stated possibility, not an observed outcome.
Evidence: European Central Bank: Financial Stability Review, May 2026
What it influences
The yield level feeds into mortgage rates, corporate borrowing costs and the cost of government debt. The Canada report (rates section) shows posted mortgage rates and the federal interest bill. This report does not estimate how much of the movement in Canadian mortgage rates is due to foreign yields rather than to domestic factors.
Risks
Large, fast moves in long-term yields can tighten conditions for borrowers and strain leveraged investors; this report has no data on leverage or market functioning and does not judge the probability of such an event.
The Bank of Canada's October Monetary Policy Report lists among its risks that global financial conditions could tighten more than expected and long-term bond yields rise further, and that higher borrowing costs would weaken global spending and investment.
Evidence: Bank of Canada: Monetary Policy Report, October 2026: Risks
Credit conditions: what is not assessed
The Bank of Canada said in May that investment-grade credit spreads had compressed to the lowest percentile in both Canada and the United States.
Evidence: Bank of Canada: Financial Stability Report 2026: Financial markets
The Bank of England says the five AI hyperscalers accounted for just 3% of outstanding US investment-grade debt at the end of 2025 but over 15% of issuance by early May.
Evidence: Bank of England: Financial Stability Report, July 2026
The Federal Reserve notes that credit remained generally available but appeared somewhat tight for private credit loans and small businesses.
Evidence: Federal Reserve Board: Minutes of the Federal Open Market Committee, September 15-16, 2026
Credit spreads (the extra yield on corporate or riskier debt), bank lending surveys and equity valuations are the usual measures of credit conditions. None is included here. Annual World Bank panels on lending rates and broad money exist but end years ago for several major economies and are not used to describe current conditions.
What to watch
The Federal Open Market Committee's next decision on 9 December and the ECB Governing Council's on 17 December; the Bank of Canada's next announcement on 9 December 2026; the release of the next consumer price indexes, which feed expectations of policy. US Treasury refunding announcements are not covered by this report.
Prepared with AI assistance.
Follow the relationships
- US Treasury yields 4 with evidence · 4 recorded Open in Studio
- Euro area government bond yields (AAA) 3 with evidence · 3 recorded Open in Studio
- Government of Canada bond yields 5 with evidence · 5 recorded Open in Studio
- Prime and posted mortgage rates 4 with evidence · 4 recorded Open in Studio
- US Federal Reserve policy rate 2 with evidence · 2 recorded Open in Studio
- European Central Bank key rates 1 with evidence · 1 recorded Open in Studio
Upcoming releases
- 2026-12-09 Bank of Canada interest rate announcement · Bank of Canada
- 2026-12-09 FOMC interest rate decision and Summary of Economic Projections · Federal Reserve (FOMC)
- 2026-12-17 ECB monetary policy decision and press conference · European Central Bank
- 2027-01-27 Bank of Canada interest rate announcement and Monetary Policy Report · Bank of Canada
Sources for this section (4 datasets, 14 documents)
Data
- US Treasury yield, 10-year (Federal Reserve statistical release H.15; 5 series; latest 5 November 2026; retrieved 2026-11-07)
- Government of Canada benchmark bond yield, 10-year (BD.CDN.10YR.DQ.YLD; 2 series; latest 5 November 2026; retrieved 2026-11-07)
- Government of Canada benchmark bond yield, 2-year (BD.CDN.2YR.DQ.YLD; 1 series; latest 5 November 2026; retrieved 2026-11-07)
- Euro area AAA-rated government bond yield, 10-year (ECB yield curve) (ECB YC; 2 series; latest 5 November 2026; retrieved 2026-11-07)
Documents cited
- Bank of Canada: Bank of Canada maintains the policy rate (2 September 2026) (retrieved 2026-10-22)
- Federal Reserve Board: Minutes of the Federal Open Market Committee, September 15-16, 2026 (retrieved 2026-11-07)
- European Central Bank: Economic Bulletin, Issue 6, 2026 (retrieved 2026-10-25)
- European Central Bank: Monetary policy statement with Q&A, 10 September 2026 (retrieved 2026-10-25)
- Bank for International Settlements: Annual Economic Report 2026, Chapter I: Progress and peril (retrieved 2026-10-25)
- Bank of Canada: Financial Stability Report 2026: Financial markets (retrieved 2026-10-25)
- Bank of Canada: Financial Stability Report 2026: Overall assessment (22 May 2026) (retrieved 2026-10-25)
- Bank of Canada: Summary of Governing Council deliberations: Fixed announcement date of July 15, 2026 (retrieved 2026-10-25)
- Bank of Canada: Monetary Policy Report, October 2026: Current conditions (retrieved 2026-11-07)
- Bank of England: Monetary Policy Summary and Minutes, September 2026 (retrieved 2026-11-07)
- Bank of Canada: The rise in the Canadian term premium in a global context (Sparks at Bank article by Eugene Trostin, James Ketcheson and Antonio Diez de los Rios, March 2026) (retrieved 2026-11-07)
- Bank of England: Financial Stability Report, July 2026 (retrieved 2026-10-25)
- European Central Bank: Financial Stability Review, May 2026 (retrieved 2026-10-25)
- Bank of Canada: Monetary Policy Report, October 2026: Risks (retrieved 2026-11-07)
Each dataset is used under its licence; attribution and series-level detail are in each chart’s “About this data” panel. Limitations: Euro area yields are the ECB's estimated yield curve for AAA-rated central-government bonds, not the German Bund and not an average of all members; Italian, Spanish and French yields, and therefore intra-euro-area spreads, are not shown. UK gilt and Japanese government bond yields are not shown. Credit spreads, corporate bond yields, bank lending standards and equity markets are not included. US yields are Treasury-published constant-maturity estimates relayed by the Federal Reserve Board.
How are the world's major currencies moving against each other, and what does it mean for Canada?
One US dollar costs C$1.4135 in October 2026; the euro buys US$1.120
What happened
The Canadian dollar's monthly average in October 2026 was C$1.4135 per US dollar, a change of 1.0% in the Canadian-dollar price of a US dollar over twelve months. The euro cost C$1.5832, the pound C$1.8790, the Japanese yen C$0.00895 and the Australian dollar C$0.9877. The ECB's reference rate for the euro averaged US$1.120 in October 2026.
The Canadian dollar against eight partner currencies
Monthly average rate; start of period = 100. A rising line means the foreign currency cost more Canadian dollars.
Chart loads when it comes into view.
Latest values: USD/CAD 1.413 (2026-10); EUR/CAD 1.583 (2026-10); GBP/CAD 1.879 (2026-10); JPY/CAD 0.009 (2026-10); and 4 more in the data table.
Related relationships: Canadian dollar (C$ per US$) · 1 relationship use this data as evidence
The euro against the US dollar
US dollars per euro, monthly average (ECB euro foreign exchange reference rate).
Chart loads when it comes into view.
Latest values: US$ per euro 1.12 (2026-10).
Why it happened
This section is descriptive. The data do not say why exchange rates moved; the institutions quoted below give their own accounts. One measured fact is available: the 12-month change in the Bank of Canada's commodity price index (in US dollars) and the 12-month change in the C$ price of a US dollar have a correlation of -0.64 over 105 months. A negative coefficient means that rises in commodity prices went with falls in the Canadian-dollar price of a US dollar, that is, with a stronger Canadian dollar.
Canada exports commodities priced in US dollars, so an association between commodity prices and the exchange rate is plausible. The correlation shows association only, and it does not control for interest rate differences between Canada and the United States or for other influences.
Evidence: relationship: Commodity prices (BoC index) and Canadian dollar (C$ per US$)
The Bank of Canada has noted that the exchange-rate channel of its policy was more muted than usual in 2022 because the US Federal Reserve was also raising rates. That passage concerned 2022 and says nothing about 2026.
In July the Federal Reserve said the broad dollar index had increased modestly on net since the start of 2026 despite volatility amid Middle East developments and remained strong in real terms, and that emerging market economies had seen notable portfolio capital outflows since the conflict began.
Its September minutes say the trade-weighted dollar then depreciated, reflecting narrowing interest rate differentials and improving foreign growth, and that a joint US-Japan intervention to support the yen in late July contributed.
Evidence: Federal Reserve Board: Minutes of the Federal Open Market Committee, September 15-16, 2026
The ECB reports that the euro appreciated 1.0% against the dollar in its review period, driven mainly by shifts in expectations about Federal Reserve policy, and that gains from the late-July coordinated intervention had mostly reversed by the end of August.
Evidence: European Central Bank: Economic Bulletin, Issue 6, 2026
Japan's Ministry of Finance reports intervention operations totalling 11,734.9 billion yen from April to June 2026.
Evidence: Ministry of Finance, Japan: Foreign Exchange Intervention Operations (April - June 2026)
The BIS says the dollar appreciated at the start of the conflict before paring back gains as risk appetite returned and that dollar appreciation proved more persistent against Asian currencies because of the region's reliance on Middle Eastern energy.
Evidence: Bank for International Settlements: Annual Economic Report 2026, Chapter I: Progress and peril
For Canada, the Bank of Canada's July deliberations say the widening US-Canada bond-yield differential had contributed to the depreciation of the Canadian dollar. Its October report says the dollar weakened somewhat on US-dollar strength but has since recovered to around 71 US cents, the level it assumed in July.
Evidence: Bank of Canada: Summary of Governing Council deliberations: Fixed announcement date of July 15, 2026; Bank of Canada: Monetary Policy Report, October 2026: Current conditions
In July, after that depreciation, the Bank's report said inflation could be higher if global cost pressures or the depreciation of the Canadian dollar passed through more persistently to consumer prices; the risks listed in its October report do not mention the exchange rate.
Evidence: Bank of Canada: Monetary Policy Report, July 2026: Overview; Bank of Canada: Monetary Policy Report, October 2026: Risks
Why it matters
For Canadian exporters of commodities priced in US dollars, a weaker Canadian dollar raises the Canadian-dollar value of sales. For importers and consumers it raises the cost of imported goods.
The ECB raised its rates in June and September, the Federal Reserve in September and the Bank of Canada on 28 October, so the exchange rate is one of the places where differences in timing could show up; the monthly data here do not show a clear pattern, and this report draws no conclusion.
History
The Canadian dollar has fluctuated in a range over the past decade. The US dollar's price in Canadian dollars was at its highest in the last ten years at C$1.4390 in January 2025 and lowest at C$1.2126 in May 2021. The euro has traded between US$0.983 (October 2022) and US$1.235 (February 2018) over the same decade.
Across geographies
The figure above rebases the Canadian dollar's value against eight currencies to the start of the period, so lines that rise mean the foreign currency became more expensive in Canadian dollars. Currency moves are bilateral: the Canadian dollar can rise against one currency and fall against another in the same month. Trade-weighted indices that summarise this are not included.
What it influences
A change in the Canadian dollar affects exporters and importers differently, and net effects depend on how inputs and sales are priced; no estimate is made here. The exchange rate also affects the Canadian-dollar value of foreign-currency revenue and of the global commodity prices in the energy and commodities sections.
Evidence: Bank of Canada: Opening statement by Stephen Murchison, 3 February 2016
Risks
A sharp move in the US dollar, whether from interest rate changes, safe-haven demand or trade policy, would affect Canada through exports and import prices. The data here cannot say how likely that is.
What to watch
The Bank of Canada's next announcement on 9 December 2026 and the next Federal Reserve and ECB decisions; US and Canadian inflation reports that feed expectations of policy; the monthly average rates for November.
Prepared with AI assistance.
Follow the relationships
- Canadian dollar (C$ per US$) 1 with evidence · 1 recorded Open in Studio
- Commodity prices (BoC index) 2 with evidence · 2 recorded Open in Studio
Sources for this section (6 datasets, 10 documents)
Data
- USD/CAD monthly average exchange rate (C$ per 1 USD), counterparty US (FXMUSDCAD; 1 series; latest October 2026; retrieved 2026-11-05)
- EUR/CAD monthly average exchange rate (C$ per 1 EUR), counterparty EU (FXMEURCAD; 1 series; latest October 2026; retrieved 2026-11-05)
- GBP/CAD monthly average exchange rate (C$ per 1 GBP), counterparty GB (FXMGBPCAD; 1 series; latest October 2026; retrieved 2026-11-05)
- JPY/CAD monthly average exchange rate (C$ per 1 JPY), counterparty JP (FXMJPYCAD; 1 series; latest October 2026; retrieved 2026-11-05)
- AUD/CAD monthly average exchange rate (C$ per 1 AUD), counterparty AU (FXMAUDCAD; 1 series; latest October 2026; retrieved 2026-11-05)
- US dollars per euro, monthly average (ECB reference rate) (ECB EXR; 1 series; latest October 2026; retrieved 2026-11-07)
Documents cited
- Bank of Canada: Tiff Macklem, Governor: Monetary policy at work, remarks to CFA Québec (7 February 2023) (retrieved 2026-11-07)
- Federal Reserve Board: Monetary Policy Report - July 2026, Part 1: Recent Economic and Financial Developments (retrieved 2026-10-25)
- Federal Reserve Board: Minutes of the Federal Open Market Committee, September 15-16, 2026 (retrieved 2026-11-07)
- European Central Bank: Economic Bulletin, Issue 6, 2026 (retrieved 2026-10-25)
- Ministry of Finance, Japan: Foreign Exchange Intervention Operations (April - June 2026) (retrieved 2026-10-25)
- Bank for International Settlements: Annual Economic Report 2026, Chapter I: Progress and peril (retrieved 2026-10-25)
- Bank of Canada: Summary of Governing Council deliberations: Fixed announcement date of July 15, 2026 (retrieved 2026-10-25)
- Bank of Canada: Monetary Policy Report, October 2026: Current conditions (retrieved 2026-11-07)
- Bank of Canada: Monetary Policy Report, July 2026: Overview (retrieved 2026-10-25)
- Bank of Canada: Monetary Policy Report, October 2026: Risks (retrieved 2026-11-07)
Each dataset is used under its licence; attribution and series-level detail are in each chart’s “About this data” panel. Limitations: Exchange rates here are monthly averages, so they do not show intramonth moves. Trade-weighted exchange rate indices, real exchange rates and positioning data are not included. The relationship between commodity prices and the Canadian dollar is a correlation of 12-month changes; it does not establish that either causes the other, and other forces such as interest rate differences act at the same time.
How open are the major economies to trade, who trades with whom, and how exposed is Canada?
In 2025, 72% of Canada's merchandise exports went to the United States, and trade equalled 63.5% of Canadian GDP against 78.5% for Germany and 38.0% for China
What happened
Trade is a much larger share of output in some economies than others. In 2025 exports plus imports of goods and services equalled 63.5% of GDP in Canada, 79.9% in Mexico, 86.4% in South Korea, 78.5% in Germany, 38.0% in China and 44.9% in Japan (2024). The United States figure was 25.0% in 2024.
Trade openness: exports plus imports
Percent of GDP.
Chart loads when it comes into view.
Latest values: Canada 63.51 (2025); United States 25.02 (2024); China 37.96 (2025); Japan 44.85 (2024); and 10 more in the data table.
Related relationships: United States · China · United Kingdom · Japan
Current account balances differ in sign (a negative number is a deficit). As a share of GDP they were 6.6% in South Korea, 4.4% in Germany, 4.9% in Japan and 3.8% in China, against -3.8% in the United States, -3.1% in the United Kingdom and -1.0% in Canada.
Current account balance
Percent of GDP; surplus above zero.
Chart loads when it comes into view.
Latest values: Canada -0.961 (2025); United States -3.825 (2025); China 3.77 (2025); Japan 4.865 (2025); and 9 more in the data table.
Related relationships: United States · China · United Kingdom · Japan
The WTO's October outlook expects world merchandise trade volume to grow 3.9% in 2026, up from 1.9% forecast in March, and 4.1% in 2027. It says the revision reflects evidence that global supply chains adapted to disruptions in energy and fertilizer markets, while strong investment in AI-related infrastructure boosted trade in AI-enabling goods.
Evidence: World Trade Organization: Global Trade Outlook and Statistics Update (news release, 8 October 2026)
Why it happened
Statistics Canada's September trade release reported that Canada's goods trade surplus with the world widened again, with exports to the United States up, mainly because of higher exports of crude oil and unwrought gold, and exports to other countries down for a second month after a record high in July. Its August release had noted that tariff announcements can prompt importers to bring shipments forward, so the monthly pattern is affected by the timing of tariff announcements and not only by underlying demand.
Evidence: Statistics Canada: The Daily: Canadian international merchandise trade, September 2026; Statistics Canada: The Daily: Canadian international merchandise trade, August 2026
The structural pattern in the annual data is long-standing. Canada's trade share was 82.8% of GDP in 2000 and is 63.5% now; Mexico's rose from 49.9% to 79.9% over the same years. The data show the change but do not explain it.
Why it matters
Trade connects the Canadian economy to world demand, supply and prices. A country in which trade is a large share of GDP is more exposed to developments abroad, and an economy that sends most of its exports to one market is exposed to that market in particular.
History
Canada's merchandise trade with the United States has long been dominant. In 2025 the United States took 72.3% of Canada's merchandise exports and supplied 45.9% of its imports. Among the partners listed, the United Kingdom was the second-largest export destination at 6.0%, followed by the European Union as a bloc at 5.5% and China at 4.5%. China supplied 11.5% of imports, Mexico 6.8% and the European Union 11.6%. The calendar-year shares are sums of monthly customs-basis data from Statistics Canada.
Canada’s main trading partners, calendar 2025
Share of Canada’s merchandise exports and imports (customs basis). The European Union and its member countries overlap; shares must not be summed across rows. Merchandise only.
Chart loads when it comes into view.
Top values: United States 72.33%; United Kingdom 6%; European Union 5.52%.
Across geographies
Merchandise exports in current US dollars show the scale: US$3.8 trillion for China, US$2.2 trillion for the United States, US$1.8 trillion for Germany and US$555 billion for Canada in the latest year the World Bank reports for each.
Merchandise exports
US$ billions, current.
Chart loads when it comes into view.
Latest values: Canada 554.7 (2025); China 3,772 (2025); United States 2,185 (2025); Germany 1,764 (2025); and 4 more in the data table.
Related relationships: United States · China · Japan · Mexico
What it influences
Canada's exposure to the United States is not uniform across provinces: the shares of provincial goods exports going to the United States are shown in the Canada report and the relationship explorer. Provinces and industries that export mostly to the United States are the most directly exposed to US demand and US border measures.
Evidence: relationship: Canada and United States; relationship: United States and Ontario; relationship: United States and Alberta; relationship: United States and Quebec
Canadian manufacturing sales and exports to the United States move together in the data (a correlation of 0.91 for 12-month changes), which is consistent with the exposure but does not prove that US demand drives Canadian manufacturing.
Evidence: relationship: Merchandise exports and Manufacturing
How exposed is Canada compared with its peers?
Canada sells abroad a much larger share of what it produces than the United States does. Exports of goods and services were 31.3% of GDP in Canada in 2025 against 11.0% in the United States in 2024, nearly three times as large a share. Among the economies compared here Canada sits in the middle: South Korea (45.8%), Germany (40.4%) and Mexico (39.6%) are more export-dependent, while China (21.1%), India (22.3%) and Japan (22.0% in 2024) are less so.
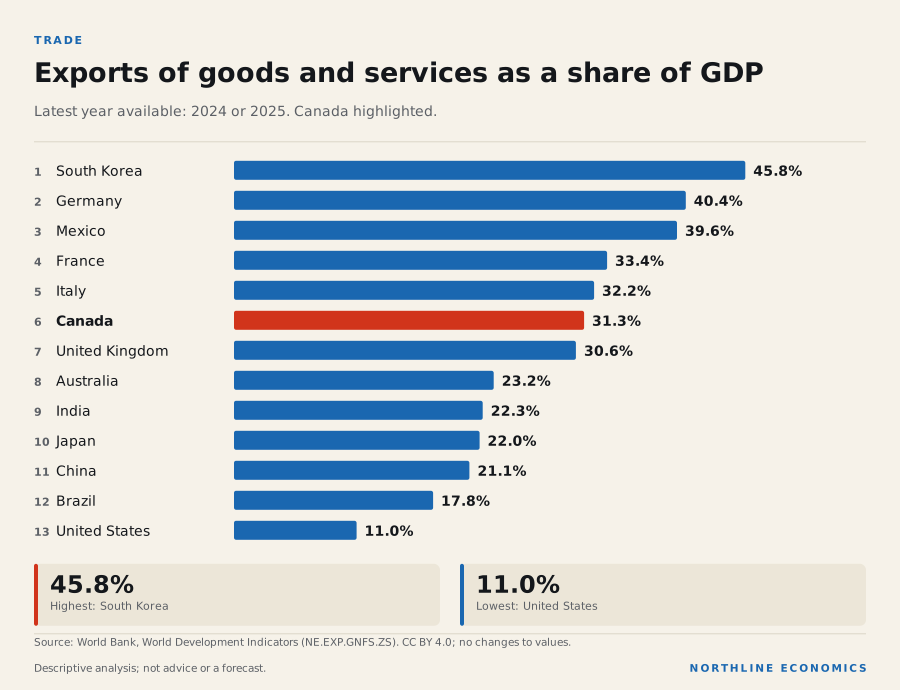
The data behind this graphic
| Item | Value |
|---|---|
| South Korea | 45.8% |
| Germany | 40.4% |
| Mexico | 39.6% |
| France | 33.4% |
| Italy | 32.2% |
| Canada | 31.3% |
| United Kingdom | 30.6% |
| Australia | 23.2% |
| India | 22.3% |
| Japan | 22.0% |
| China | 21.1% |
| Brazil | 17.8% |
| United States | 11.0% |
Openness is only part of exposure, because it says nothing about who the buyers are. The United States took 72.3% of Canada's merchandise exports in 2025, and that concentration is what makes tariff or border changes at that partner matter more than the headline share would suggest. The current account tells a different story: Canada's was -1.0% of GDP in 2025, a small deficit, against a surplus of 6.6% in South Korea and 4.4% in Germany and a balance of -3.8% in the United States.
What this means for Canadian decisions
For a business, the relevant number is exposure to a specific partner and product, not the national openness ratio. For a policymaker, Canada's current-account balance of -1.0% of GDP is a smaller deficit than the United States' or Australia's (-2.8%), though the figure says nothing about what is being financed. These are annual figures from the World Bank and lag the monthly trade statistics.
Risks
The United States announced new tariffs on a range of Canadian products on 22 July that took effect at the end of August, and Canada announced tariffs on select American goods at the end of August; some tariffs on electrical products were removed in September, according to Statistics Canada. The US tariffs, imposed under Section 338 of the Tariff Act of 1930 by proclamations signed on 20 July, are 50% on goods that the US Trade Representative put at nearly US$20 billion of imports from Canada; proclamations in September and October banned some Canadian products and changed the list of goods covered. The Bank of Canada described both situations as fluid. See the tariffs section for what is and is not known.
Evidence: Statistics Canada: The Daily: Canadian international merchandise trade, August 2026; Bank of Canada: Bank of Canada maintains the policy rate (2 September 2026); The White House (Fact Sheet): Fact Sheet: President Donald J. Trump Imposes Additional Tariffs on Canada (Section 338, 20 July 2026); Office of the United States Trade Representative: Ambassador Greer Issues Statement on President Trump Imposing Section 338 Tariffs on Canada; The White House (Fact Sheet): Fact Sheet: President Donald J. Trump Responds to Canada's Retaliation (Section 338, 8 September 2026); The White House (Fact Sheet): Fact Sheet: President Donald J. Trump Further Modifies Canadian Products Subject to Tariffs under Section 338 (23 October 2026)
What to watch
Statistics Canada's monthly merchandise trade release, the US Census Bureau's trade release and any further tariff changes announced by either government; the World Bank's annual updates for the cross-country picture.
Prepared with AI assistance.
Follow the relationships
- United States 12 with evidence · 12 recorded Open in Studio
- China 2 with evidence · 2 recorded Open in Studio
- European Union 2 with evidence · 2 recorded Open in Studio
- Mexico 2 with evidence · 2 recorded Open in Studio
- Japan 2 with evidence · 2 recorded Open in Studio
- United Kingdom 3 with evidence · 3 recorded Open in Studio
- Merchandise exports 4 with evidence · 4 recorded Open in Studio
- US tariff announcements and Canadian counter-measures (2026) 0 with evidence · 0 recorded Open in Studio
Upcoming releases
- 2026-12-08 Canadian international merchandise trade October 2026 · Statistics Canada
Sources for this section (4 datasets, 8 documents)
Data
- Trade (% of GDP) (all economies; World Bank) (WDI NE.TRD.GNFS.ZS; series; latest annual; retrieved 2026-10-23)
- Current account balance (% of GDP) (all economies; World Bank) (WDI BN.CAB.XOKA.GD.ZS; series; latest annual; retrieved 2026-10-23)
- Merchandise exports (current US$) (all economies; World Bank) (WDI TX.VAL.MRCH.CD.WT; series; latest annual; retrieved 2026-10-23)
- Exports of goods and services (% of GDP) (all economies; World Bank) (WDI NE.EXP.GNFS.ZS; series; latest annual; retrieved 2026-10-23)
Documents cited
- World Trade Organization: Global Trade Outlook and Statistics Update (news release, 8 October 2026) (retrieved 2026-10-25)
- Statistics Canada: The Daily: Canadian international merchandise trade, September 2026 (retrieved 2026-11-06)
- Statistics Canada: The Daily: Canadian international merchandise trade, August 2026 (retrieved 2026-10-22)
- Bank of Canada: Bank of Canada maintains the policy rate (2 September 2026) (retrieved 2026-10-22)
- The White House (Fact Sheet): Fact Sheet: President Donald J. Trump Imposes Additional Tariffs on Canada (Section 338, 20 July 2026) (retrieved 2026-11-07)
- Office of the United States Trade Representative: Ambassador Greer Issues Statement on President Trump Imposing Section 338 Tariffs on Canada (retrieved 2026-11-07)
- The White House (Fact Sheet): Fact Sheet: President Donald J. Trump Responds to Canada's Retaliation (Section 338, 8 September 2026) (retrieved 2026-11-07)
- The White House (Fact Sheet): Fact Sheet: President Donald J. Trump Further Modifies Canadian Products Subject to Tariffs under Section 338 (23 October 2026) (retrieved 2026-11-07)
Each dataset is used under its licence; attribution and series-level detail are in each chart’s “About this data” panel. Limitations: Annual trade-to-GDP and current-account data are from the World Bank (the current account originates with the IMF's balance of payments data, so it carries the IMF's own terms and is used for display with a visible condition). The World Bank's world aggregate for 2025 shows a jump in trade openness that looks like incomplete coverage and is not used. Bilateral trade flows between economies other than Canada are not included. The WTO figures come from its October news release.
What trade restrictions are in force, and are supply chains under strain?
Tariff action between Canada and the United States is documented in 2026; global tariff, subsidy and shipping data are not covered here
What happened
Statistics Canada reported that the United States announced new tariffs on a range of Canadian products on 22 July, that they took effect at the end of August, that Canada announced tariffs on select American goods at the end of August, and that some tariffs on electrical products were removed in September.
Evidence: Statistics Canada: The Daily: Canadian international merchandise trade, August 2026
The Bank of Canada described new US tariffs and Canadian counter-measures as following the breakdown of trade talks and described both situations as fluid. It said tariffs will raise costs for some businesses and could pass through to consumer prices over time.
Evidence: Bank of Canada: Bank of Canada maintains the policy rate (2 September 2026)
The US measures were set out in three proclamations signed on 20 July 2026 under Section 338 of the Tariff Act of 1930. They imposed additional tariffs of 50%, each on a different set of Canadian imports, ranging from wine to hockey sticks to cement, which the US Trade Representative put at nearly US$20 billion of imports from Canada. The White House said the tariffs apply whether or not a good qualifies under the Canada–United States–Mexico Agreement and, in July, that they would not apply to energy, potash or certain other goods. A proclamation of 18 August set their effective date at 22 August 2026. On 8 September five further proclamations banned imports of certain Canadian products, including alcohol and dairy products, from 29 September and changed the list of products subject to the tariffs from 15 September; the White House said Canada had that day imposed new retaliatory tariffs on about US$20 billion of US exports. A proclamation of 23 October changed the list again from 30 October.
Evidence: The White House (Fact Sheet): Fact Sheet: President Donald J. Trump Imposes Additional Tariffs on Canada (Section 338, 20 July 2026); Office of the United States Trade Representative: Ambassador Greer Issues Statement on President Trump Imposing Section 338 Tariffs on Canada; The White House (Presidential Actions): Temporary Suspension of Additional Duties to Offset Canadian Discrimination Against the Commerce of the United States With Respect to Alcoholic Beverages, Dairy, and Motor Vehicles (Proclamation, 18 August 2026); The White House (Fact Sheet): Fact Sheet: President Donald J. Trump Responds to Canada's Retaliation (Section 338, 8 September 2026); The White House (Fact Sheet): Fact Sheet: President Donald J. Trump Further Modifies Canadian Products Subject to Tariffs under Section 338 (23 October 2026)
This report records these events from the sources named. It does not list the products covered, which the proclamations' annexes set out and which have changed with each proclamation, and it does not estimate the value of trade affected beyond the figures quoted.
Why it happened
The Bank of Canada says the tariffs followed the breakdown of trade talks. The White House says the US tariffs respond to what it calls Canada's discriminatory treatment of US cars, alcohol and dairy. The reasons Canada gave for its counter-measures are not stated here.
Evidence: Bank of Canada: Bank of Canada maintains the policy rate (2 September 2026); The White House (Fact Sheet): Fact Sheet: President Donald J. Trump Imposes Additional Tariffs on Canada (Section 338, 20 July 2026)
Why it matters
Tariffs raise the price of the goods they cover, and the Bank of Canada says they could raise consumer prices over time. How large an effect is not stated in the sources cited, and none is estimated here.
Evidence: Bank of Canada: Bank of Canada maintains the policy rate (2 September 2026)
For the United States, where tariffs have been in place longer, the Federal Reserve minutes say the staff attributed the rise in inflation mostly to the effects of past tariff increases, higher energy and input costs from geopolitical developments and technology-related goods prices tied to the AI buildout, and projected that the effects of tariffs, geopolitical developments and the AI buildout were expected to wane, with inflation reaching 2 percent in 2029. The minutes do not apportion the rise among the three causes. The Bank of Canada's July deliberations separately attributed US inflation above target to tariffs, higher gasoline prices and persistent services inflation; its October report says US inflation has remained elevated and is expected to rise further, largely reflecting higher energy prices, with recent core pressures from transportation services prices and the effects of past tariffs.
Evidence: Federal Reserve Board: Minutes of the Federal Open Market Committee, September 15-16, 2026; Bank of Canada: Summary of Governing Council deliberations: Fixed announcement date of July 15, 2026; Bank of Canada: Monetary Policy Report, October 2026: Global economy
Statistics Canada notes that tariff announcements can prompt importers to bring shipments forward, which affects the monthly trade data around announcement dates. That is a data-interpretation caution, not an estimate of the tariffs' economic effect.
Evidence: Statistics Canada: The Daily: Canadian international merchandise trade, August 2026
The Bank of Canada's July Monetary Policy Report named the evolution of the Canada–US trade relationship as one of the two most important risks to its inflation outlook, and its October report says it remains one of the two. In October the Bank also said new US tariffs restrain exports and trade uncertainty dampens business investment and household spending.
Evidence: Bank of Canada: Monetary Policy Report, July 2026: Overview; Bank of Canada: Monetary Policy Report, October 2026: Risks; Bank of Canada: Monetary Policy Report, October 2026: Current conditions
History
A US presidential proclamation imposed a 10 percent duty on articles imported into the United States from February 24, 2026, with exceptions that included goods entering duty-free from Canada or Mexico under the Canada-United States-Mexico Agreement, and set it to run through 12:01 a.m. on July 24, 2026 unless extended by an Act of Congress. On July 23 the US Trade Representative announced separate tariffs under Section 301 on 60 economies for failing to impose and enforce a ban on imports made with forced labour, at 10 percent for Canada, Mexico and the United Kingdom among others. Later changes to either measure are not traced here.
Evidence: The White House (Presidential Actions): Imposing a Temporary Import Surcharge to Address Fundamental International Payments Problems (Section 122 proclamation); Office of the United States Trade Representative: USTR Takes Action in Forced Labor Section 301 Investigations
A White House fact sheet of April 2026 says articles made entirely or almost entirely of aluminum, steel or copper pay a flat 50% on their full value. A fuller dated history of tariff actions is not held.
Across geographies
Tariff and restriction events involving China, the European Union, India, Mexico and other economies are not recorded here, because this report cites no official source for them. What the sources do give is how trade differs by region in 2026; they do not separate the effect of tariffs from energy disruption or AI investment.
The WTO's October update expects world merchandise trade volume to grow 3.9% in 2026, up from 1.9% in its March forecast, because supply chains adapted to disruptions in energy and fertilizer markets and AI-related investment boosted trade in AI-enabling goods. It projects the fastest merchandise export growth in Asia (9.9%), followed by North America (5.7%), with Europe's exports roughly flat (-0.1%); on imports it expects North America to grow only 1.4% and Europe 0.5%. Canada is inside the North America figure and is not shown separately, so these do not show how Canadian trade performed.
Evidence: World Trade Organization: Global Trade Outlook and Statistics Update (news release, 8 October 2026)
What it influences
The link from US trade policy to Canadian manufacturing remains a hypothesis here, and the correlation between exports to the United States and manufacturing sales is 0.91. That is an observed association over time and not an estimate of tariff effects.
Evidence: relationship: Merchandise exports and Manufacturing
Risks
Supply chains:
The World Bank's September 2026 Global Monthly, prepared by Tommy Chrimes, Bram Gootjes, Nikita Perevalov and Rafaela Martinho Henriques of its Prospects Group, says global supply chain pressures remained elevated in August, reflecting long supplier delivery times and high ocean freight rates.
The WTO says crude oil exports from the Middle East fell by roughly a quarter and LNG exports by nearly half in the first half of 2026 but increased shipments from other suppliers helped offset the loss, and that fertilizer imports held close to recent averages despite severe disruption, so supply chains adapted.
Evidence: World Trade Organization: Global Trade Outlook and Statistics Update (news release, 8 October 2026)
Industrial policy and subsidies: Not assessed here.
What to watch
Further tariff announcements by either government, published in the US Federal Register and the Canada Gazette; Statistics Canada's next trade release on 8 December; the Bank of Canada's next announcement on 9 December 2026.
Prepared with AI assistance.
Follow the relationships
- US tariff announcements and Canadian counter-measures (2026) 0 with evidence · 0 recorded Open in Studio
- US trade policy toward Canada 0 with evidence · 0 recorded Open in Studio
- Manufacturing 12 with evidence · 12 recorded Open in Studio
- Merchandise exports 4 with evidence · 4 recorded Open in Studio
- Consumer price inflation 1 with evidence · 1 recorded Open in Studio
- Business investment 0 with evidence · 0 recorded Open in Studio
Upcoming releases
- 2026-12-08 Canadian international merchandise trade October 2026 · Statistics Canada
Sources for this section (0 datasets, 18 documents)
Documents cited
- Statistics Canada: The Daily: Canadian international merchandise trade, August 2026 (retrieved 2026-10-22)
- Bank of Canada: Bank of Canada maintains the policy rate (2 September 2026) (retrieved 2026-10-22)
- The White House (Fact Sheet): Fact Sheet: President Donald J. Trump Imposes Additional Tariffs on Canada (Section 338, 20 July 2026) (retrieved 2026-11-07)
- Office of the United States Trade Representative: Ambassador Greer Issues Statement on President Trump Imposing Section 338 Tariffs on Canada (retrieved 2026-11-07)
- The White House (Presidential Actions): Temporary Suspension of Additional Duties to Offset Canadian Discrimination Against the Commerce of the United States With Respect to Alcoholic Beverages, Dairy, and Motor Vehicles (Proclamation, 18 August 2026) (retrieved 2026-11-07)
- The White House (Fact Sheet): Fact Sheet: President Donald J. Trump Responds to Canada's Retaliation (Section 338, 8 September 2026) (retrieved 2026-11-07)
- The White House (Fact Sheet): Fact Sheet: President Donald J. Trump Further Modifies Canadian Products Subject to Tariffs under Section 338 (23 October 2026) (retrieved 2026-11-07)
- Federal Reserve Board: Minutes of the Federal Open Market Committee, September 15-16, 2026 (retrieved 2026-11-07)
- Bank of Canada: Summary of Governing Council deliberations: Fixed announcement date of July 15, 2026 (retrieved 2026-10-25)
- Bank of Canada: Monetary Policy Report, October 2026: Global economy (retrieved 2026-11-07)
- Bank of Canada: Monetary Policy Report, July 2026: Overview (retrieved 2026-10-25)
- Bank of Canada: Monetary Policy Report, October 2026: Risks (retrieved 2026-11-07)
- Bank of Canada: Monetary Policy Report, October 2026: Current conditions (retrieved 2026-11-07)
- The White House (Presidential Actions): Imposing a Temporary Import Surcharge to Address Fundamental International Payments Problems (Section 122 proclamation) (retrieved 2026-11-07)
- Office of the United States Trade Representative: USTR Takes Action in Forced Labor Section 301 Investigations (retrieved 2026-11-07)
- The White House (Fact Sheet): Fact Sheet: President Donald J. Trump Strengthens Tariffs on Steel, Aluminum, and Copper Imports (retrieved 2026-10-25)
- World Trade Organization: Global Trade Outlook and Statistics Update (news release, 8 October 2026) (retrieved 2026-10-25)
- World Bank Group: Global Monthly, September 2026 (retrieved 2026-10-25)
Each dataset is used under its licence; attribution and series-level detail are in each chart’s “About this data” panel. Limitations: No consolidated official database of tariffs is held here. Tariff events must be read one at a time from official notices (the US Federal Register, the Canada Gazette, the Department of Finance) and recorded with their effective dates; this report relies on Statistics Canada and Bank of Canada releases and on White House and US Trade Representative statements that describe them. Supply-chain pressure, container freight, port congestion and shipping-route data are proprietary or have not been evaluated; none is shown. Industrial policy (subsidies, local-content rules, export controls) is not tracked.
What has happened to energy prices in 2026, and what does it mean for energy-producing and energy-importing economies?
Brent crude was US$125.00 a barrel in October 2026, 75.8% above its February level, while European gas is up 153.6% since February at US$28.50
What happened
World energy prices rose sharply in March 2026 and have stayed high. Brent crude averaged US$71.10 a barrel in February and US$103.70 in March, reached US$120.40 in April, eased to US$83.40 in July and rose again to US$125.00 in October 2026. West Texas Intermediate, the benchmark for North American crude, was US$97.70 in October 2026, up from US$64.60 in February.
Crude oil prices
US dollars per barrel, monthly average (World Bank Pink Sheet). WTI is the benchmark for Canadian light crude; Brent and Dubai are the other main references.
Chart loads when it comes into view.
Latest values: Crude oil, WTI 97.7 (2026-10); Crude oil, Brent 125 (2026-10); Crude oil, Dubai 102.7 (2026-10).
Related relationships: World oil price (WTI) · 10 relationships use this data as evidence
Natural gas diverged by region. The European price was US$28.50 per million BTU in October 2026, against US$11.24 in February; the Japanese LNG price is shown in the figure below; the US price was US$2.96, below its February level of US$3.61.
Natural gas prices
Monthly average, US$ per million BTU.
Chart loads when it comes into view.
Latest values: Natural gas, US 2.96 (2026-10); Natural gas, Europe 28.5 (2026-10); Liquefied natural gas, Japan 16.59 (2026-10).
Related relationships: European natural gas price · 1 relationship use this data as evidence
The International Energy Agency's October Oil Market Report expects world oil demand to fall by 2.6 million barrels a day on average in 2026 and by 2.5 million barrels a day year on year in the fourth quarter, and describes the supply recovery as fragile.
Evidence: International Energy Agency: Oil Market Report - October 2026
Why it happened
The Bank of Canada's October report says persistent disruptions to oil supply from the Gulf region have led to a sharp increase in crude oil prices, and its 28 October statement says the conflict is in its eighth month with no clear path to resolution.
Evidence: Bank of Canada: Monetary Policy Report, October 2026: Current conditions; Bank of Canada: Bank of Canada raises the policy rate by 25 basis points to 2½% (28 October 2026)
Statistics Canada reported that crude oil prices rose in September to their highest level since May amid uncertainty about the wars in the Middle East. These statements describe the conflict as the reason, and the timing in the data (a jump from February to March) is consistent with them.
Evidence: Statistics Canada: The Daily: Consumer Price Index, September 2026
The World Bank's April 2026 Commodity Markets Outlook says that before the conflict, vessels passing the Strait of Hormuz carried close to 35 per cent of global seaborne trade in crude oil and 20 per cent of that in refined petroleum products, and that the reduction in global oil supply in March 2026, about 10 million barrels per day, was the largest oil supply shock on record. The WTO's October update says crude oil exports from the Middle East fell by roughly 24% in the first half of 2026, but that increased shipments from other suppliers limited the fall in global crude oil exports to around 6%.
Evidence: World Bank Group: Commodity Markets Outlook, April 2026; World Trade Organization: Global Trade Outlook and Statistics Update (news release, 8 October 2026)
This report does not model the supply disruption. The IEA highlights, the World Bank's outlook and the WTO's update quoted above are the supply-side sources cited, and none gives current volumes by route or producer in the passages quoted here.
Why it matters
Energy is an input to nearly everything and a major export for some economies. High prices raise costs and inflation for importers and raise incomes for producers. The transfer between the two falls on different regions inside a single country: in Canada, the producing provinces and the consuming ones.
History
The Brent price's two-year high is shown above. For longer perspective, WTI averaged US$16.50 in April 2020 and peaked at US$114.60 in June 2022 over the past ten years. The European gas price peaked at US$70.04 in August 2022.
Across geographies
Energy dependence differs widely. Net energy imports were -95.0% of energy use in Canada in 2024, -211.2% in Australia and -9.8% in the United States (negative values are net exporters), against 87.3% in Japan, 83.2% in South Korea, 70.3% in Germany, 67.5% for the euro area (2023) and 36.0% in India. A price rise is therefore a gain for the first group and a cost for the second. Renewable sources supplied 67.0% of Canada's electricity in 2021, 77.4% of Brazil's, 39.8% of Germany's and 20.3% of the United States'.
Net energy imports
Percent of energy use. Negative = net exporter.
Chart loads when it comes into view.
Latest values: Canada -95.02 (2024); United States -9.781 (2024); China 24.02 (2024); Japan 87.28 (2024); and 9 more in the data table.
Related relationships: United States · China · United Kingdom · Japan
Renewable share of electricity output
Percent.
Chart loads when it comes into view.
Latest values: Canada 67.02 (2021); United States 20.27 (2021); China 28.43 (2021); Japan 21.1 (2021); and 9 more in the data table.
Related relationships: United States · China · United Kingdom · Japan
What it influences
In March 2015 a Bank of Canada official said the decline in oil prices since June 2014 was unambiguously negative for the Canadian economy: Canadians' real incomes had contracted in the fourth quarter of 2014, and business investment in the oil and gas sector was expected to fall in 2015. Alberta's Budget 2026 fiscal plan puts the net fiscal impact of a fall of one US dollar a barrel in the WTI price at about $680 million over a full year. Energy products were 26.3% of Canadian merchandise exports in September 2026, and crude oil exports were C$14.7 billion in the month.
Evidence: Rhys Mendes, Opening Statement before the House of Commons Standing Committee on Finance (Bank of Canada), 12 March 2015; National Bank Economics summary of Alberta Budget 2026 revenue sensitivities; Bank of Canada: Rhys Mendes, Opening Statement before the House of Commons Standing Committee on Finance, 12 March 2015; Government of Alberta (Treasury Board and Finance): Budget 2026: Focused on what matters, Fiscal Plan 2026-29 (Open Government Licence - Alberta)
In the data, the 12-month change in the WTI price and the 12-month change in Alberta employment have a correlation of 0.38 over the same months and 0.28 when employment is compared six months later. For Calgary the same-month correlation is 0.37, for Edmonton 0.41 and for Toronto, shown as a comparison, 0.37. These are descriptive; the relationship graph holds them as observed correlations, not effects.
Evidence: relationship: World oil price (WTI) and Alberta; relationship: World oil price (WTI) and Edmonton; relationship: World oil price (WTI) and Calgary
For consumers, the CPI gasoline index was 27.8% higher in September 2026 than a year earlier.
Evidence: relationship: World oil price (WTI) and Consumer energy and gasoline prices; relationship: World oil price (WTI) and Consumer energy and gasoline prices
Risks
The energy outlook depends on events in the Middle East, which this report cannot forecast. The Bank of Canada's October projection assumes that shipping through the Strait of Hormuz gradually returns to normal and refinery margins ease; the Bank says further supply disruptions could push fuel prices higher than projected, while a quick resolution of the conflict would lead oil prices to decline further and faster than assumed. The IEA describes the supply recovery as fragile.
Evidence: Bank of Canada: Monetary Policy Report, October 2026: Risks; International Energy Agency: Oil Market Report - October 2026
A fall in oil prices would reverse the gains to producing economies, and a further rise would add to the inflation and growth pressures described elsewhere in this report.
What to watch
Monthly Pink Sheet updates; the next IEA Oil Market Report; Statistics Canada's monthly crude oil and merchandise trade data; the Bank of Canada's next announcement on 9 December 2026. Natural gas, electricity and LNG in Canada are covered in the Canada report's industry section.
Prepared with AI assistance.
Follow the relationships
- World oil price (WTI) 16 with evidence · 16 recorded Open in Studio
- European natural gas price 1 with evidence · 1 recorded Open in Studio
- Middle East conflict and disrupted energy shipping (2026) 1 with evidence · 1 recorded Open in Studio
- Business investment in oil and gas 0 with evidence · 0 recorded Open in Studio
- Consumer energy and gasoline prices 3 with evidence · 3 recorded Open in Studio
- Crude oil production 1 with evidence · 1 recorded Open in Studio
- Alberta 14 with evidence · 17 recorded Open in Studio
- Calgary 1 with evidence · 2 recorded Open in Studio
- Edmonton 1 with evidence · 2 recorded Open in Studio
Upcoming releases
- 2026-12-08 Canadian international merchandise trade October 2026 · Statistics Canada
Sources for this section (5 datasets, 9 documents)
Data
- Crude oil, Brent, monthly average price (Pink Sheet (monthly prices); 4 series; latest October 2026; retrieved 2026-11-05)
- International merchandise trade by commodity, monthly (12-10-0163-01; 2 series; latest September 2026; retrieved 2026-11-05)
- Consumer Price Index, monthly, not seasonally adjusted (18-10-0004-01; 1 series; latest September 2026; retrieved 2026-10-23)
- Energy imports, net (% of energy use) (all economies; World Bank) (WDI EG.IMP.CONS.ZS; series; latest annual; retrieved 2026-10-23)
- Renewable electricity output (% of total electricity output) (all economies; World Bank) (WDI EG.ELC.RNEW.ZS; series; latest annual; retrieved 2026-10-23)
Documents cited
- International Energy Agency: Oil Market Report - October 2026 (retrieved 2026-10-23)
- Bank of Canada: Monetary Policy Report, October 2026: Current conditions (retrieved 2026-11-07)
- Bank of Canada: Bank of Canada raises the policy rate by 25 basis points to 2½% (28 October 2026) (retrieved 2026-11-07)
- Statistics Canada: The Daily: Consumer Price Index, September 2026 (retrieved 2026-11-07)
- World Bank Group: Commodity Markets Outlook, April 2026 (retrieved 2026-11-07)
- World Trade Organization: Global Trade Outlook and Statistics Update (news release, 8 October 2026) (retrieved 2026-10-25)
- Bank of Canada: Rhys Mendes, Opening Statement before the House of Commons Standing Committee on Finance, 12 March 2015 (retrieved 2026-11-07)
- Government of Alberta (Treasury Board and Finance): Budget 2026: Focused on what matters, Fiscal Plan 2026-29 (Open Government Licence - Alberta) (retrieved 2026-11-07)
- Bank of Canada: Monetary Policy Report, October 2026: Risks (retrieved 2026-11-07)
Each dataset is used under its licence; attribution and series-level detail are in each chart’s “About this data” panel. Limitations: Prices are monthly averages of benchmark prices compiled by the World Bank (WTI, Brent and Dubai crude; US, European and Japanese gas), not Canadian heavy-oil prices such as Western Canadian Select, which are not included. The IEA statements come from the published highlights of its October report, not from the full report. US Energy Information Administration data are not included; electricity generation, power prices, storage levels and Canadian pipeline and LNG data are not shown. The relationship between oil prices and Alberta employment is a correlation; it does not measure how oil prices affect employment.
Which commodity prices matter to Canada, and what are they doing?
Copper averaged US$14,508 a tonne in October 2026 and wheat was 37.3% above a year earlier, while potash averaged US$357.50
What happened
Most metal prices are higher than a year earlier, though gold and silver are well below their early-2026 highs and iron ore, also in the metals figure, changed by -12.3% over twelve months. Copper averaged US$14,508 a tonne in October 2026, 35.1% higher than a year earlier, and aluminum, nickel and zinc are shown in the figure rebased to the start of the period. Gold averaged US$4,105 an ounce in October 2026, after reaching US$5,020 in February 2026; silver averaged US$57.00.
Base metals and iron ore
Indexed so the start of the period = 100, because prices are in different units.
Chart loads when it comes into view.
Latest values: Copper 14,510 (2026-10); Aluminum 3,061 (2026-10); Nickel 15,440 (2026-10); Zinc 3,818 (2026-10); and 1 more in the data table.
Gold and silver
US dollars per troy ounce.
Chart loads when it comes into view.
Latest values: Gold 4,105 (2026-10); Silver 57 (2026-10).
Fertilizer and grain prices have moved differently. Potash (potassium chloride), which Canada exports in large volumes, averaged US$357.50 a tonne, below its US$405.00 peak of May 2026. Urea was US$420.00 and DAP US$803.10. US hard red winter wheat averaged US$317.00 a tonne, 37.3% above a year earlier.
Fertilizers
US dollars per tonne. Potash (potassium chloride) is a major Canadian export.
Chart loads when it comes into view.
Latest values: Potassium chloride 357.5 (2026-10); Urea 420 (2026-10); DAP 803.1 (2026-10).
Grains and oilseeds
Indexed so the start of the period = 100. Canada is a major wheat and canola (rapeseed) producer.
Chart loads when it comes into view.
Latest values: Wheat, US HRW 317 (2026-10); Maize 226.5 (2026-10); Soybeans 515 (2026-10); Rapeseed oil 1,405 (2026-10).
Why it happened
The World Bank's April 2026 Commodity Markets Outlook describes the war in the Middle East as a historic shock to commodity markets, resulting in the largest oil supply loss on record, while saying global production capacity is sufficient but access is temporarily impeded.
Evidence: World Bank Group: Commodity Markets Outlook, April 2026
It forecasts overall commodity prices to rise 16% in 2026, driven by soaring energy and fertilizer prices and record-high prices for several key metals, and copper to increase about 21 percent in 2026 to a record annual high on tight supplies and firm demand from emerging industries.
Evidence: World Bank Group: Commodity Markets Outlook (April 2026) and Pink Sheet note; World Bank Group: Commodity Markets Outlook, April 2026
On fertilizer, the same outlook says the recent surge in its fertilizer price index largely reflects the impact of the closure of the Strait of Hormuz on exports of fertilizers and inputs, projects urea prices to rise by nearly 60 percent in 2026 before declining in 2027 as exports from the Middle East recover and natural gas prices moderate, and says that in the longer term significant new production capacity, particularly in Canada, the world's largest potash producer and exporter, could exert further downward pressure on potash prices.
Evidence: World Bank Group: Commodity Markets Outlook, April 2026
The Food and Agriculture Organization's September index says a rise in a cereal component was largely associated with logistical constraints in the Black Sea region. The World Bank's April outlook was published before the second rise in oil prices: Brent averaged US$83.40 a barrel in July and US$125.00 in October 2026.
Evidence: Food and Agriculture Organization of the United Nations: FAO Food Price Index (September 2026 release); World Bank Group: Commodity Markets Outlook, April 2026
The WTO's October release says global supply chains adapted to disruptions in energy and fertilizer markets.
Evidence: World Trade Organization: Global Trade Outlook and Statistics Update (news release, 8 October 2026)
Who gains and who pays
The twelve-month moves are very uneven, which matters for who benefits. Silver rose 15.4%, wheat 37.3% and copper 35.1%, while the Bank of Canada's energy index rose 38.1% and its total index 23.5% (to September 2026). Potash, which Canada exports in large volumes, rose only 1.6%, and urea rose 6.5%.
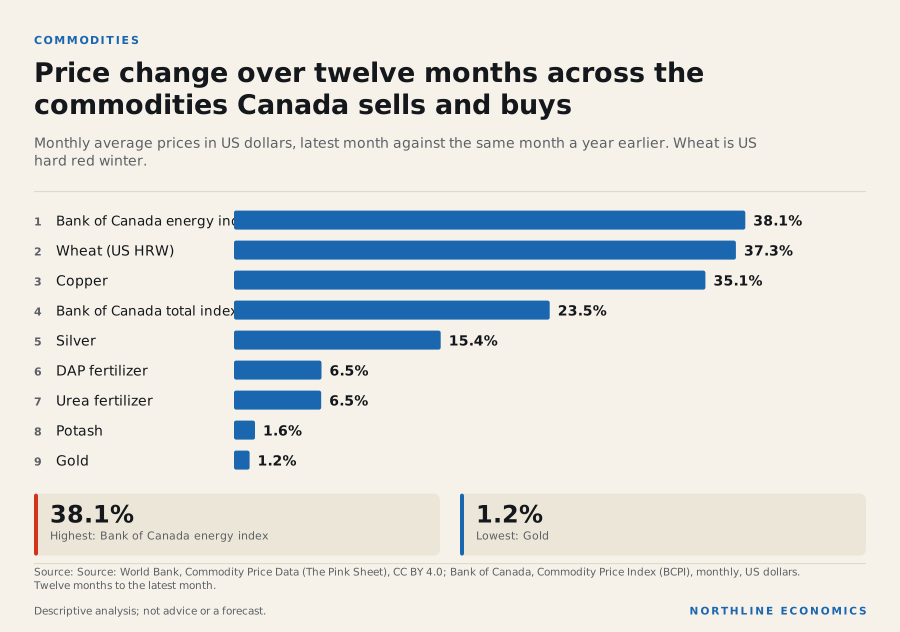
The data behind this graphic
| Item | Value |
|---|---|
| Bank of Canada energy index | 38.1% |
| Wheat (US HRW) | 37.3% |
| Copper | 35.1% |
| Bank of Canada total index | 23.5% |
| Silver | 15.4% |
| DAP fertilizer | 6.5% |
| Urea fertilizer | 6.5% |
| Potash | 1.6% |
| Gold | 1.2% |
Three comparisons follow from the table, each about price moves and not about profits. Grain prices rose far faster than fertilizer prices, so what farmers sell rose faster than much of what they buy; potash exporters, though, saw little of the gain that metals and energy producers did. The energy index rose faster than the total index, so energy is pulling the Bank of Canada's measure of Canadian export commodity prices up; producing regions gain on export value while industries that use fuel or copper as inputs pay more. And gold rose 1.2% over the year, less than copper's 35.1%.
These are monthly averages in US dollars, so Canadian-dollar returns also depend on the exchange rate, which this section does not adjust for. The figures show direction, not forecast.
Why it matters
Commodity prices feed into export revenue for Canada's mining, potash, grain and forestry sectors and into input costs for manufacturing, construction and farming. The Bank of Canada's commodity price index summarises export-weighted commodity prices: its total index stands at 747.7 in September 2026, 23.5% above a year earlier, and its energy component at 1,636.5.
History
Gold's average of US$1,561 in January 2020 compares with US$4,105 now. Copper's was US$6,031 in January 2020. Both are shown in the figures above.
Across geographies
World prices are the same for every seller, but their impact differs by economy. Canada's exports of metals and minerals, potash and grains are shown in the Canada report's trade and industry sections; provincial exposure to resources is in the relationship explorer.
What it influences
Higher commodity prices are associated with a stronger Canadian dollar in the data (see the currency section) and, for energy prices, with higher Alberta employment growth: the correlation between the 12-month change in the energy commodity price index and in Alberta employment is 0.41 over the same months. These are associations, not measured effects.
Evidence: relationship: Commodity prices (BoC index) and Canadian dollar (C$ per US$); relationship: Commodity prices (BoC index) and Alberta
Risks
Commodity prices are volatile, and a fall in prices after a rise would cut export revenue. This report has no forecasts of commodity prices and gives none.
What to watch
The World Bank's monthly Pink Sheet and the Bank of Canada's monthly commodity price index; Statistics Canada's merchandise trade release for export volumes and values.
Prepared with AI assistance.
Follow the relationships
- Commodity prices (BoC index) 2 with evidence · 2 recorded Open in Studio
- Canadian dollar (C$ per US$) 1 with evidence · 1 recorded Open in Studio
- Forestry, fishing, mining, quarrying, oil and gas 11 with evidence · 11 recorded Open in Studio
- Agriculture 10 with evidence · 10 recorded Open in Studio
Sources for this section (3 datasets, 4 documents)
Data
- Iron ore, cfr spot, monthly average price (Pink Sheet (monthly prices); 9 series; latest October 2026; retrieved 2026-11-05)
- BCPI energy, monthly (M.ENER; 1 series; latest September 2026; retrieved 2026-11-05)
- BCPI total, monthly (M.BCPI; 1 series; latest September 2026; retrieved 2026-11-05)
Documents cited
- World Bank Group: Commodity Markets Outlook, April 2026 (retrieved 2026-11-07)
- World Bank Group: Commodity Markets Outlook (April 2026) and Pink Sheet note (retrieved 2026-10-25)
- Food and Agriculture Organization of the United Nations: FAO Food Price Index (September 2026 release) (retrieved 2026-10-25)
- World Trade Organization: Global Trade Outlook and Statistics Update (news release, 8 October 2026) (retrieved 2026-10-25)
Each dataset is used under its licence; attribution and series-level detail are in each chart’s “About this data” panel. Limitations: Prices are monthly averages compiled by the World Bank; spot prices on any day can differ. Critical minerals (lithium, cobalt, graphite, rare earths) are not in the extract used and are not assessed. Production, inventories and trade volumes by commodity are not included, so supply and demand explanations cannot be given from data here. The institutions quoted below give their own explanations; the data here cannot test them.
Where is industry concentrated, what is the technology upcycle doing to trade and investment, and where does Canada fit?
Manufacturing is 27.4% of GDP in South Korea and 24.7% in China but 9.3% in Canada (2022); euro area industrial production was 97.6 in August 2026 on a 2021 = 100 scale
What happened
Industry makes up very different shares of national output. Manufacturing value added was 27.4% of GDP in South Korea, 24.7% in China, 20.0% in Mexico, 18.8% in Japan, 17.6% in Germany, 10.5% in the United States (2021) and 9.3% in Canada (2022); the reference years differ.
Manufacturing value added
Percent of GDP.
Chart loads when it comes into view.
Latest values: Canada 9.324 (2022); United States 10.53 (2021); China 24.73 (2025); Japan 18.82 (2024); and 9 more in the data table.
Related relationships: United States · China · United Kingdom · Japan
In the euro area, industrial production (mining, manufacturing and energy, 2021 = 100, seasonally adjusted) was 97.6 in August 2026, a change of -1.1% over twelve months. Germany's index was 90.7, France's 102.4, Italy's 92.8 and Spain's 103.8.
Industrial production in the euro area’s largest economies
Index, 2021 = 100, seasonally and calendar adjusted; mining, manufacturing and energy (Eurostat).
Chart loads when it comes into view.
Latest values: Euro area 97.6 (2026-08); Germany 90.7 (2026-08); France 102.4 (2026-08); Italy 92.8 (2026-08); and 1 more in the data table.
Related relationships: Euro area
Why it happened
The Bank of Canada's October 2026 report says global growth remains resilient, boosted by strong AI-related investment, and that investment related to artificial intelligence continues to support economic activity in the United States and parts of Asia.
Evidence: Bank of Canada: Monetary Policy Report, October 2026: Global economy
The WTO's October outlook says demand for AI-enabling goods such as semiconductors and servers accounted for 47% of the growth in world merchandise trade in the first half of 2026. It describes a demand surge for a narrow group of goods; the data in this report cannot show which economies produce them.
Evidence: World Trade Organization: Global Trade Outlook and Statistics Update (news release, 8 October 2026)
Why it matters
Industrial structure shapes which economies gain when a particular kind of demand rises. A technology-hardware boom benefits producers of chips, servers and the materials and equipment they need; it does little directly for an economy that mostly exports commodities. Whether Canada benefits is not shown by any data here.
History
Germany's manufacturing share was 20.3% of GDP in 2000 and is 17.6% now; South Korea's was 26.6% and is 27.4%; Canada's was 17.3% and was 9.3% in 2022, the latest year available.
Across geographies
Research and development spending as a share of GDP is highest in South Korea (4.9%), the United States (3.4%) and Japan (3.4%); Canada's is 1.8%. The latest year for Korea, the United States and Japan is 2023; Canada's is 2024.
Research and development spending
Percent of GDP.
Chart loads when it comes into view.
Latest values: Canada 1.791 (2024); United States 3.447 (2023); China 2.577 (2023); Japan 3.441 (2023); and 9 more in the data table.
Related relationships: United States · China · United Kingdom · Japan
What it influences
Canadian manufacturing sales move closely with exports to the United States in the data: the correlation between 12-month changes in the two is 0.91, an association and not a measure of US demand.
Evidence: relationship: Merchandise exports and Manufacturing
Statistics Canada reports that manufacturing output rose in August, for the fifth time in seven months, and that its advance estimate for September shows decreases in manufacturing; Canadian manufacturing is covered in the Canada report's industry section.
Evidence: Statistics Canada: The Daily: Gross domestic product by industry, August 2026
The WTO says trade in AI-enabling goods accelerated to 67% growth in the first half of 2026, raising its share of world merchandise trade to 14.8% from 7 to 8% between 2016 and 2023, that the top ten traders accounted for around 85% of world exports of these goods in 2025, and that a disruption in AI investment would weaken trade through the sector's import intensity and wealth effects.
Evidence: World Trade Organization: Global Trade Outlook and Statistics - Update: October 2026 (full report)
The International Energy Agency projects that data centre electricity consumption will more than double to around 945 TWh by 2030, and says data centres account for nearly half of electricity demand growth to 2030 in the United States.
Evidence: International Energy Agency: Energy and AI: Executive summary
China's statistics bureau reports that high-tech manufacturing grew 14.3 percent in January to September 2026 against 5.7 percent for manufacturing as a whole.
Eurostat reports that euro-area industrial production decreased 0.5% in August 2026 compared with July while capital goods output rose 3.0%.
Evidence: Eurostat: Industrial production down by 0.5% in the euro area and by 0.3% in the EU (August 2026)
Risks
The WTO's October outlook says the upgrade to its 2026 trade forecast reflects evidence that supply chains adapted to disruptions in energy and fertilizer markets while strong investment in AI-related infrastructure boosted trade in AI-enabling goods. Concentration of the technology upcycle in a few economies and sectors, and a reversal if demand for AI-related goods falls, are risks this report does not quantify.
Evidence: World Trade Organization: Global Trade Outlook and Statistics Update (news release, 8 October 2026)
Infrastructure and industrial development
Not assessed. No international infrastructure indicator (investment, quality, project pipelines) has been included. Canada's infrastructure is covered in the Canada report to the extent that building investment data allow.
What to watch
Eurostat's industrial production release (monthly); Statistics Canada's monthly GDP by industry (the September data are due on 30 November); the WTO's quarterly goods-trade barometer, which is not included.
Prepared with AI assistance.
Follow the relationships
- Manufacturing 12 with evidence · 12 recorded Open in Studio
- Business investment 0 with evidence · 0 recorded Open in Studio
- Labour productivity 0 with evidence · 0 recorded Open in Studio
Sources for this section (3 datasets, 7 documents)
Data
- Industrial production index (mining, manufacturing, energy; 2021=100), seasonally and calendar adjusted: Euro area – 20 countries (2023-2025) (Eurostat sts_inpr_m; 5 series; latest August 2026; retrieved 2026-11-05)
- Manufacturing, value added (% of GDP) (all economies; World Bank) (WDI NV.IND.MANF.ZS; series; latest annual; retrieved 2026-10-23)
- Research and development expenditure (% of GDP) (all economies; World Bank) (WDI GB.XPD.RSDV.GD.ZS; series; latest annual; retrieved 2026-10-23)
Documents cited
- Bank of Canada: Monetary Policy Report, October 2026: Global economy (retrieved 2026-11-07)
- World Trade Organization: Global Trade Outlook and Statistics Update (news release, 8 October 2026) (retrieved 2026-10-25)
- Statistics Canada: The Daily: Gross domestic product by industry, August 2026 (retrieved 2026-11-07)
- World Trade Organization: Global Trade Outlook and Statistics - Update: October 2026 (full report) (retrieved 2026-11-07)
- International Energy Agency: Energy and AI: Executive summary (retrieved 2026-10-25)
- National Bureau of Statistics of China: National Economy was Generally Stable with New Achievement Made in High-Quality Development in the First Three Quarters (retrieved 2026-10-25)
- Eurostat: Industrial production down by 0.5% in the euro area and by 0.3% in the EU (August 2026) (retrieved 2026-10-25)
Each dataset is used under its licence; attribution and series-level detail are in each chart’s “About this data” panel. Limitations: Industrial production is available only for the euro area and its four largest members (Eurostat). US, Japanese, Chinese and Korean industrial production, purchasing managers' indices, semiconductor and data-centre statistics and infrastructure spending are not included. Manufacturing and industry shares are annual World Bank estimates with different reference years. The statements about artificial intelligence and trade come from the Bank of Canada's October 2026 Monetary Policy Report and from the WTO's October release and report. No numbers on AI investment are given.
How tight are labour markets in the major economies, and how are populations changing?
In the latest month for each, unemployment was 4.2% in the United States (September 2026), 6.5% in the euro area (September 2026), 4.7% in the United Kingdom (July 2026) and 6.7% in Canada (October 2026), while ageing is far advanced in Japan (30.0% aged 65 and over) and early in India (7.4%)
What happened
In the latest months unemployment was 4.2% in the United States (September 2026), 6.5% in the euro area (September 2026), 4.7% in the United Kingdom (July 2026) and 6.7% in Canada (October 2026). Within the euro area: 4.1% in Germany, 8.5% in France, 6.3% in Italy and 10.3% in Spain.
Unemployment rates: United States, euro area, United Kingdom and Canada
Percent, seasonally adjusted, monthly. Each country’s survey and definitions differ; the UK series is a three-month rolling measure.
Chart loads when it comes into view.
Latest values: United States 4.2 (2026-09); Euro area 6.5 (2026-09); United Kingdom 4.7 (2026-07); Canada 6.7 (2026-10).
Related relationships: United States · United Kingdom · Canada · Euro area
Unemployment in the euro area and its largest economies
Percent of the labour force, seasonally adjusted, monthly (Eurostat). Definitions follow the ILO but country surveys differ.
Chart loads when it comes into view.
Latest values: Euro area 6.5 (2026-09); Germany 4.1 (2026-09); France 8.5 (2026-09); Italy 6.3 (2026-09); and 1 more in the data table.
Related relationships: Euro area
In the United States, payroll employment totalled 159.0 million jobs in September 2026, 0.3% above a year earlier, and average hourly earnings of private-sector employees were US$37.81 an hour, up 3.0% over twelve months.
US jobs and earnings growth
Percent change from a year earlier (derived by Northline from BLS levels): total nonfarm payroll employment and average hourly earnings of private-sector employees.
Chart loads when it comes into view.
Latest values: Payroll employment 0.31 (2026-09); Average hourly earnings 3.02 (2026-09).
Related relationships: United States
Why it happened
The monthly series record levels, not causes.
In its September release Statistics Canada reported that employment had fallen that month, with losses concentrated in educational services, health care and social assistance and manufacturing, and that the participation rate was the lowest since December 1997 outside 2020. It added that population ageing resumed its trend in 2025 and 2026 after sharp increases in immigration offset it in 2023 and 2024.
Evidence: Statistics Canada: The Daily: Labour Force Survey, September 2026
Its October survey showed employment little changed and the unemployment rate up, as more people searched for work; the rate was 6.7% in October 2026.
Evidence: Statistics Canada: Labour Force Survey, October 2026 (The Daily)
Why it matters
The labour market links output to household income. A low unemployment rate can coexist with weak labour supply: Japan's modelled rate is 2.5% and its population growth rate -0.5%. A falling participation rate, which Statistics Canada reported for Canada in September, means the unemployment rate alone can understate weakness.
Evidence: Statistics Canada: The Daily: Labour Force Survey, September 2026
History
Unemployment in the World Bank's annual (modelled ILO) data was 5.7% in Canada in 2019, 9.7% in 2020 and 6.9% in 2025; the United States' was 3.7% in 2019, 8.1% in 2020 and 4.2% in 2025.
Ageing is the slow-moving force. The share of the population aged 65 and over was 30.0% in Japan, 23.7% in Germany, 22.9% in the euro area, 20.3% in South Korea, 20.3% in Canada, 18.4% in the United States, 14.9% in China and 7.4% in India. South Korea's share was 7.1% in 2000; Canada's was 12.5%.
Population aged 65 and over
Percent of population.
Chart loads when it comes into view.
Latest values: Canada 20.26 (2025); United States 18.39 (2025); China 14.91 (2025); Japan 29.99 (2025); and 10 more in the data table.
Related relationships: United States · China · United Kingdom · Japan
Across geographies
Population is growing 0.9% a year in Canada (2025, World Bank), 1.5% in Australia, 0.9% in India and 0.5% in the United States, and is shrinking in China (-0.2%), Japan (-0.5%) and South Korea (-0.1%). Labour force participation was 66.5% in Australia, 64.5% in Canada, 64.6% in China, 61.7% in the United States, 60.6% in Germany and 55.3% in France.
Population growth
Annual percent change.
Chart loads when it comes into view.
Latest values: Canada 0.939 (2025); United States 0.523 (2025); China -0.17 (2025); Japan -0.492 (2025); and 10 more in the data table.
Related relationships: United States · China · United Kingdom · Japan
Labour force participation
Percent of population aged 15+ (modelled ILO estimate).
Chart loads when it comes into view.
Latest values: Canada 64.52 (2025); United States 61.7 (2025); China 64.55 (2025); Japan 63.45 (2025); and 9 more in the data table.
Related relationships: United States · China · United Kingdom · Japan
Statistics Canada reported that Canada's population growth continued to slow, with July-to-July growth the lowest since 1944/1945, that the number of non-permanent residents fell by the largest annual amount on record, and that Alberta had the fastest growth among provinces. The latest quarterly Canadian population estimate is 41.8 million (1 July 2026).
Evidence: Statistics Canada: The Daily: Canada's population estimates, second quarter 2026
Canada among nine advanced economies
Canada's labour market has an unusual combination: one of the most active workforces and one of the highest unemployment rates. The participation rate was 64.5% in 2025, second only to Australia's 66.5% among the nine economies compared here, yet unemployment of 6.9% was the second highest after France's 7.5%. Because many people look for work but not all find it, Canada's employment-to-population ratio of 60.1% ranks only fourth, behind Australia (63.8%), South Korea (62.6%) and Japan (61.9%).
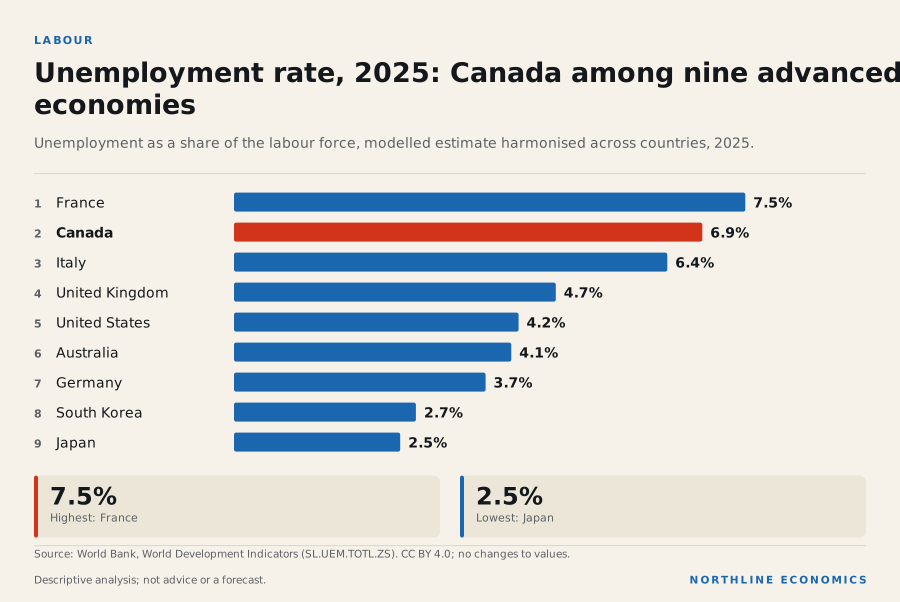
The data behind this graphic
| Item | Value |
|---|---|
| France | 7.5% |
| Canada | 6.9% |
| Italy | 6.4% |
| United Kingdom | 4.7% |
| United States | 4.2% |
| Australia | 4.1% |
| Germany | 3.7% |
| South Korea | 2.7% |
| Japan | 2.5% |
Population growth is the context. Canada's population grew 0.9% in 2025, second only to Australia's 1.5%, while Japan's changed -0.5% and Italy's, South Korea's and Germany's were close to flat. More people entering the labour force can raise unemployment for a time if hiring does not keep pace, but these data do not show that this is happening or how much it explains.
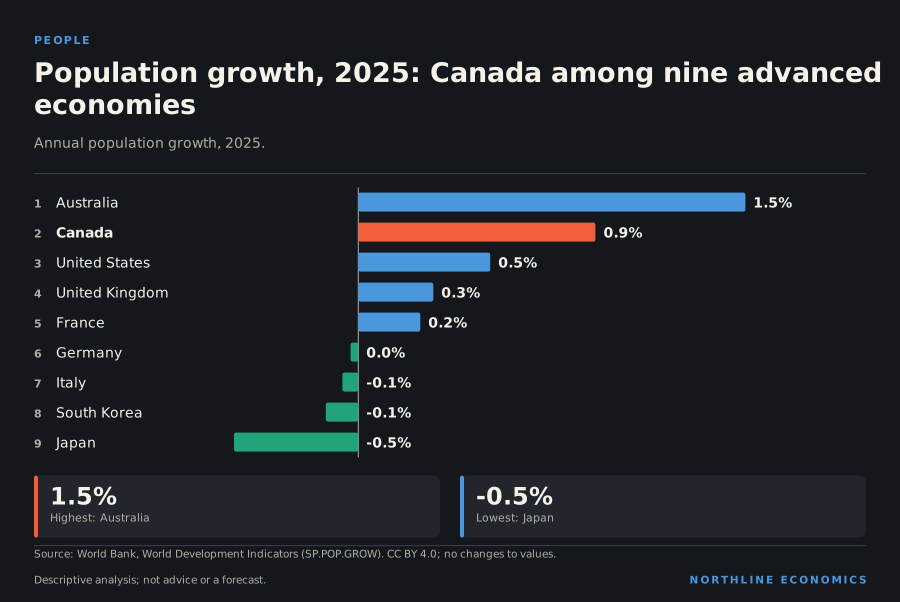
The data behind this graphic
| Item | Value |
|---|---|
| Australia | 1.5% |
| Canada | 0.9% |
| United States | 0.5% |
| United Kingdom | 0.3% |
| France | 0.2% |
| Germany | 0.0% |
| Italy | -0.1% |
| South Korea | -0.1% |
| Japan | -0.5% |
Age structure adds to the picture. Canada has 20.3% of its population aged 65 or older, below Germany's 23.7%, Italy's 25.1% and Japan's 30.0%, but above the United States' 18.4%. A faster-growing population is one way a country eases the pressure of ageing; whether the labour market can absorb that growth is the question the unemployment rate poses.
What this means for Canadian decisions
For an employer, unemployment is higher than in most peer economies, and the national average hides large provincial differences (see the provincial labour-market note). For a planner, high participation and high unemployment together do not show whether labour supply or demand is the constraint, and population growth has since slowed, as Statistics Canada reports above. These are annual 2025 figures on harmonised definitions and differ from the monthly Statistics Canada rates elsewhere in this report.
What it influences
Canada's population change depends heavily on federal immigration policy: the 2027–2029 levels plan, published in November 2026, keeps permanent resident admissions at 380,000 a year and sets new temporary-resident arrivals at 370,000 a year. How population change feeds housing demand and the labour market is discussed in the Canada report; the link to housing demand remains a hypothesis here.
Evidence: YYC Economy, Calgary Economic Outlook 2027, sections 2 and 4; Statistics Canada: The Daily: Canada's population estimates, second quarter 2026; Immigration, Refugees and Citizenship Canada: Supplementary Information for the 2026-2028 Immigration Levels Plan; Immigration, Refugees and Citizenship Canada: Supplementary Information for the 2027-2029 Immigration Levels Plan
The International Labour Organization projects the global unemployment rate to stay at 4.9 per cent in 2026, about 186 million people, says ageing populations are slowing labour force growth in richer economies, and projects employment growth of 0.5 per cent in upper-middle-income, 1.8 per cent in lower-middle-income and 3.1 per cent in low-income economies.
The United Nations projects world population to peak at around 10.3 billion in the mid-2080s, notes that 63 countries, including China, Germany, Japan and Russia, have already passed their peak, and says immigration is projected to be the main driver of population growth in 52 countries through 2054, including Australia, Canada and the United States.
The Federal Reserve said in July that a marked slowdown in US immigration and ongoing declines in participation due to ageing had slowed labour supply growth.
Evidence: Board of Governors of the Federal Reserve System: Monetary Policy Report, July 2026: Summary
Risks
A shrinking or ageing workforce limits potential growth; sharp swings in migration, as in Canada's case, make population-based planning difficult. This report does not quantify either.
What to watch
US employment reports (BLS), the euro area and UK labour market releases (Eurostat, ONS), and Statistics Canada's Labour Force Survey; Canada's next annual immigration levels plan.
Prepared with AI assistance.
Follow the relationships
- Employment 0 with evidence · 0 recorded Open in Studio
- Population growth 0 with evidence · 0 recorded Open in Studio
- Federal immigration levels 0 with evidence · 0 recorded Open in Studio
- Wages 0 with evidence · 0 recorded Open in Studio
- United States 12 with evidence · 12 recorded Open in Studio
- Euro area 2 with evidence · 2 recorded Open in Studio
- United Kingdom 3 with evidence · 3 recorded Open in Studio
Upcoming releases
- 2026-12-04 Labour Force Survey November 2026 · Statistics Canada
Sources for this section (12 datasets, 7 documents)
Data
- US unemployment rate, 16 years and over, seasonally adjusted (BLS LNS14000000; 1 series; latest September 2026; retrieved 2026-11-05)
- Unemployment rate, seasonally adjusted, share of the labour force: Euro area – 21 countries (from 2026) (Eurostat une_rt_m; 5 series; latest September 2026; retrieved 2026-11-05)
- UK unemployment rate, aged 16 and over, seasonally adjusted (ONS LMS / MGSX; 1 series; latest July 2026; retrieved 2026-11-05)
- Labour force characteristics, monthly, seasonally adjusted and trend-cycle (14-10-0287-01; 1 series; latest October 2026; retrieved 2026-11-07)
- US total nonfarm payroll employment, seasonally adjusted (BLS CES0000000001; 1 series; latest September 2026; retrieved 2026-11-05)
- US average hourly earnings of all employees, total private, seasonally adjusted (BLS CES0500000003; 2 series; latest September 2026; retrieved 2026-11-05)
- Population estimates, quarterly (17-10-0009-01; 1 series; latest 1 July 2026; retrieved 2026-10-23)
- Unemployment, total (% of total labor force) (modeled ILO estimate) (all economies; World Bank) (WDI SL.UEM.TOTL.ZS; series; latest annual; retrieved 2026-10-23)
- Population growth (annual %) (all economies; World Bank) (WDI SP.POP.GROW; series; latest annual; retrieved 2026-10-23)
- Population ages 65 and above (% of total population) (all economies; World Bank) (WDI SP.POP.65UP.TO.ZS; series; latest annual; retrieved 2026-10-23)
- Labor force participation rate, total (% of total population ages 15+) (modeled ILO estimate) (all economies; World Bank) (WDI SL.TLF.CACT.ZS; series; latest annual; retrieved 2026-10-23)
- Employment to population ratio, 15+, total (%) (modeled ILO estimate) (all economies; World Bank) (WDI SL.EMP.TOTL.SP.ZS; series; latest annual; retrieved 2026-10-23)
Documents cited
- Statistics Canada: The Daily: Labour Force Survey, September 2026 (retrieved 2026-10-25)
- Statistics Canada: Labour Force Survey, October 2026 (The Daily) (retrieved 2026-11-07)
- Statistics Canada: The Daily: Canada's population estimates, second quarter 2026 (retrieved 2026-11-07)
- Immigration, Refugees and Citizenship Canada: Supplementary Information for the 2027-2029 Immigration Levels Plan (retrieved 2026-11-06)
- International Labour Organization: Global job quality stagnates despite resilient growth (Employment and Social Trends 2026) (retrieved 2026-10-25)
- United Nations, Department of Economic and Social Affairs, Population Division: World Population Prospects 2024: Summary of Results (retrieved 2026-10-25)
- Board of Governors of the Federal Reserve System: Monetary Policy Report, July 2026: Summary (retrieved 2026-10-25)
Each dataset is used under its licence; attribution and series-level detail are in each chart’s “About this data” panel. Limitations: Unemployment definitions follow the ILO but surveys differ across countries; the UK figure is a three-month rolling measure and the euro area aggregate is EA21 for unemployment. The US series from the public BLS interface starts in January 2024. Annual World Bank unemployment and participation figures are modelled ILO estimates and are not directly comparable with the monthly survey figures. Wage data for countries other than the United States and Canada, vacancies, labour productivity by sector and migration flows between countries (other than five-year UN net migration estimates) are not included.
How do housing markets compare across countries, and what is the Canadian picture?
Cross-country housing comparisons are not published here; Canada's own housing market is in the Canada report
What happened
No comparable cross-country housing series is held, so the picture below is each authority's own statement for its market, not a ranking.
The US Federal Housing Finance Agency's index shows house prices up 2.1 percent between the second quarter of 2025 and the second quarter of 2026.
The UK's house price index shows annual inflation of 0.9% in the 12 months to August 2026.
Eurostat reports that house prices rose 4.0% in the euro area and 4.7% in the EU in the second quarter of 2026 on a year earlier, with falls in Finland, Luxembourg and France and large rises in Portugal and Bulgaria.
Evidence: Eurostat: House prices up by 4.0% in the euro area (Euro indicators, Q2 2026)
The World Bank's July 2026 China Economic Update says real estate investment fell 16.2 percent year on year in January to May 2026 as the property sector adjusts to weaker demand.
Evidence: World Bank Group: China Economic Update, July 2026: Rebalancing Growth
Why it happened
CMHC reported that the six-month trend of housing starts was virtually flat in September, and its deputy chief economist said a key risk for Canada now is not building enough during this period of softening housing markets across the country. The global drivers of Canadian housing, such as mortgage rates tied to bond yields, are shown in the bond market section.
Evidence: Canada Mortgage and Housing Corporation: Housing starts and construction data, September 2026
Why it matters
Housing is the largest asset and largest expense for most households, and it links financial conditions to the real economy through construction and household spending.
The Bank of Canada describes rate-sensitive sectors such as housing as often slowing first when the policy rate rises.
Evidence: relationship: Household mortgage debt-servicing costs and Housing demand; relationship: Household mortgage debt-servicing costs and Household spending; Bank of Canada: Tiff Macklem, Governor: Monetary policy at work, remarks to CFA Québec (7 February 2023)
History
The Federal Reserve's May 2026 financial stability report says US residential prices remained well above their historical relationship with fundamentals even as price growth slowed, but that credit standards have remained tight relative to the early 2000s, suggesting that elevated prices are not the result of weak credit standards.
Its July monetary policy report describes US housing activity as stagnant, with sales of existing homes and construction of new single-family homes little changed. For Canada, see the Canada report's housing section.
Evidence: Board of Governors of the Federal Reserve System: Monetary Policy Report, July 2026: Summary
Across geographies
The European Central Bank's May 2026 financial stability review says housing supply has failed to keep pace with rising demand in several euro-area countries and that rising measures of overvaluation combined with tightening financial conditions slightly raised tail risks for residential prices in early 2026.
Evidence: European Central Bank: Financial Stability Review, May 2026
The World Bank says China's estimated time to clear existing inventory was 30 months in March 2026, home buyer sentiment remains cautious on expectations of further price declines and concerns over unfinished pre-sold projects, and developer financing declined for twelve months. The Canada report compares housing across Canadian metropolitan areas using Statistics Canada and CMHC data.
Evidence: World Bank Group: China Economic Update, July 2026: Rebalancing Growth
What it influences
The Bank of England's July 2026 financial stability report says mortgage rates have increased consistent with higher market interest rates and projects that a little over 5 million households will see repayments increase by the end of 2028.
Evidence: Bank of England: Financial Stability Report, July 2026
The World Bank warns that if the Chinese property downturn deepens it could compound pressures on consumer spending and investment in real estate and related sectors.
Evidence: World Bank Group: Rebalancing Growth: China Economic Update (press release)
Risks
CMHC's Fall 2026 Housing Supply Report estimates a national supply gap in annual starts needed to restore pre-pandemic affordability by 2036 of 187,000 to 238,000 units a year. Long-term yields are covered in the bond market section; this report does not estimate their effect on builders and buyers.
Evidence: Canada Mortgage and Housing Corporation: Fall 2026 Housing Supply Report
What to watch
CMHC's monthly housing starts, Statistics Canada's new housing price index, the Bank of Canada's mortgage-rate series and Eurostat's quarterly house price index.
Prepared with AI assistance.
Follow the relationships
- Housing costs (prices and rents) 1 with evidence · 1 recorded Open in Studio
- Residential construction 2 with evidence · 2 recorded Open in Studio
- Prime and posted mortgage rates 4 with evidence · 4 recorded Open in Studio
- Household mortgage debt-servicing costs 4 with evidence · 4 recorded Open in Studio
Upcoming releases
- 2026-12-09 Bank of Canada interest rate announcement · Bank of Canada
- 2027-01-27 Bank of Canada interest rate announcement and Monetary Policy Report · Bank of Canada
Sources for this section (0 datasets, 12 documents)
Documents cited
- Federal Housing Finance Agency: U.S. House Prices Rise 2.1 Percent Year over Year; Up 0.3 Percent Quarter over Quarter (FHFA HPI, Q2 2026) (retrieved 2026-10-25)
- HM Land Registry / Office for National Statistics (UK HPI): UK House Price Index Summary: August 2026 (retrieved 2026-10-25)
- Eurostat: House prices up by 4.0% in the euro area (Euro indicators, Q2 2026) (retrieved 2026-10-25)
- World Bank Group: China Economic Update, July 2026: Rebalancing Growth (retrieved 2026-10-25)
- Canada Mortgage and Housing Corporation: Housing starts and construction data, September 2026 (retrieved 2026-10-22)
- Bank of Canada: Tiff Macklem, Governor: Monetary policy at work, remarks to CFA Québec (7 February 2023) (retrieved 2026-11-07)
- Board of Governors of the Federal Reserve System: Financial Stability Report, May 2026: 1. Asset Valuations (retrieved 2026-10-25)
- Board of Governors of the Federal Reserve System: Monetary Policy Report, July 2026: Summary (retrieved 2026-10-25)
- European Central Bank: Financial Stability Review, May 2026 (retrieved 2026-10-25)
- Bank of England: Financial Stability Report, July 2026 (retrieved 2026-10-25)
- World Bank Group: Rebalancing Growth: China Economic Update (press release) (retrieved 2026-10-25)
- Canada Mortgage and Housing Corporation: Fall 2026 Housing Supply Report (retrieved 2026-11-07)
Each dataset is used under its licence; attribution and series-level detail are in each chart’s “About this data” panel. Limitations: House price indices for other countries are published by the BIS, the OECD, Eurostat, national statistical offices and private providers with different definitions (new versus existing homes, quality adjustment, geographic coverage); none is included here. Eurostat's index covers only the euro area and the European Union, so it would not give a global comparison with Canada. No comparable rent or affordability series is held here.
Which governments carry the most debt, and what do higher yields do to the cost?
On the World Bank's central-government measure, debt was 115.8% of GDP in the United States against 64.1% in Canada in 2024; the US ten-year yield now stands at 4.84%
What happened
Central government debt as a share of GDP was 130.7% in the United Kingdom (2024; see History on an unexplained break in this series), 115.8% in the United States (2024), 81.9% in Brazil, 64.1% in Canada, 50.3% in Mexico and 47.8% in South Korea. Japan, China, the euro area and Germany have no recent value in the database. Net lending (+) or borrowing (-) of the government, as a share of GDP, was -7.2% in the United States (2024), -6.9% in the United Kingdom, -5.9% in Mexico and -1.2% in Canada.
Government debt
Central government debt, percent of GDP. Coverage differs by country; general-government debt (used by the IMF) is larger for many economies.
Chart loads when it comes into view.
Latest values: Canada 64.13 (2024); United States 115.8 (2024); India 46.52 (2018); United Kingdom 130.7 (2024); and 6 more in the data table.
Related relationships: United States · China · United Kingdom · Japan
Government net lending (+) or borrowing (−)
Percent of GDP.
Chart loads when it comes into view.
Latest values: Canada -1.169 (2024); United States -7.189 (2024); India -5.26 (2022); United Kingdom -6.862 (2024); and 7 more in the data table.
Related relationships: United States · China · United Kingdom · Japan
Why it happened
The World Bank data do not say why debt levels differ.
For Canada, the Department of Finance's Fiscal Monitor for August reports that revenues for April to August were up 7.1% on a year earlier, largely on personal income tax, other revenues and GST, with lower customs import duties and energy tax revenues offsetting part of the increase, and that public debt charges increased 9.1%, primarily because of a larger stock of marketable bonds with higher average effective interest rates; the federal deficit for the five months was $5.4 billion against $11.1 billion a year earlier.
Evidence: Department of Finance Canada: The Fiscal Monitor, August 2026
In July the Federal Reserve said the US federal budget deficit had been around 6 percent of GDP in fiscal 2025 and so far in fiscal 2026, notably larger than before the pandemic, reflecting both noninterest outlays outpacing receipts and higher debt-servicing costs, and that federal debt held by the public was close to its historical peak at the end of World War II.
In August the US Treasury expected to borrow $739 billion in privately held net marketable debt in July to September 2026, $68 billion more than announced in May, mainly because of lower projected net cash flows.
In its quarterly refunding statement of 4 November 2026 the Treasury said that, based on current projected borrowing needs, it anticipates maintaining nominal coupon and floating-rate note (FRN) auction sizes for the next several quarters; its August statement had said for at least the next several quarters.
Evidence: U.S. Department of the Treasury: Quarterly Refunding Statement of Assistant Secretary for Financial Markets, November 4, 2026; U.S. Department of the Treasury: Quarterly Refunding Statement, August 2026
The UK Office for National Statistics reports borrowing of nearly £25 billion in September 2026, central government debt interest of £10.9 billion, and debt that provisionally exceeded £3 trillion for the first time though lower as a proportion of the economy than a year earlier.
Evidence: Office for National Statistics: Public sector finances, UK: September 2026
The ECB projects the euro-area budget deficit to rise to 3.6% of GDP in 2026 and the debt ratio to reach just below 90% of GDP in 2028.
Evidence: European Central Bank: Economic Bulletin, Issue 6, 2026
Eurostat's October 2026 release gives the outturn behind that projection: the euro-area government deficit was unchanged at 3.0% of GDP in 2024 and 2025, while the debt ratio rose from 86.6% to 87.7% (EU: from 80.3% to 81.5%). Within the euro area the highest debt ratios were in Greece (145.4%), Italy (136.7%), France (115.7%), Belgium and Spain, and twelve EU member states had government debt ratios higher than 60% of GDP. This is general-government debt, a wider measure than the World Bank central-government figures above.
For the United Kingdom, the Debt Management Office's revised net financing requirement for 2026-27 is £251.2 billion, with planned gross gilt sales of £246.2 billion. The Bank of England's gilt sales under quantitative tightening (see the central-bank section) are a separate flow that the Bank says it will conduct so as not to disrupt market functioning.
Evidence: UK Debt Management Office: Revision to the DMO Financing Remit 2026-27; Bank of England: Monetary Policy Summary and Minutes, September 2026
The sources cited describe three different fiscal positions with different mechanisms: the United States, where the Federal Reserve points to deficits driven by outlays outpacing receipts and higher debt-servicing costs; the euro area, where the ECB projects a rising deficit and Germany's infrastructure and defence package is named as a driver; and the United Kingdom, where the Bank of England stresses the growth-adjusted interest rate and the ECB points to political uncertainty in yields. No source cited ranks them against each other. Japan and China are not described here.
The ECB's financial stability review says that high deficits leave governments less room to respond to shocks and that concerns about US fiscal credibility could contribute to market stress.
Evidence: European Central Bank: Financial Stability Review, May 2026
The Bank of England notes that an important determinant of debt-to-GDP is the growth-adjusted interest rate, and that sovereign debt issuance is at historical highs and shortening in maturity.
Evidence: Bank of England: Financial Stability Report, July 2026
The BIS says hedge funds play an increasing role in intermediating government debt through leveraged, funding-dependent strategies and that fiscal space may shrink well before any limit implied by long-run fundamentals is reached.
The Bank of Canada says ageing populations and increased defence spending suggest government debt loads will continue to expand.
Evidence: Bank of Canada: Financial Stability Report 2026: Financial markets
Why it matters
A government that borrows heavily is exposed to the level of interest rates: as old bonds mature and are refinanced at higher yields, the interest bill rises.
Evidence: relationship: Government of Canada bond yields and Government finances
Canada's own debt charges rose in April to August 2026 mainly because a larger stock of marketable bonds carried higher average effective interest rates, which is the mechanism. Federal government interest expense was C$13.9 billion in Q2 2026.
Evidence: relationship: Government of Canada bond yields and Government finances; Department of Finance Canada: The Fiscal Monitor, August 2026
History
The United States' central government debt was 85.2% of GDP in 2010, 100.2% in 2019 and 115.8% in 2024. Canada's was 53.1%, 53.4% and 64.1%. The United Kingdom's was 130.5% in 2010, 159.0% in 2019 and 130.7% in 2024. Its series drops from 183.8% in 2021 to 138.2% in 2022, a fall in one year that the World Bank's notes for the series do not explain, so the change since 2019 should be read with that break in mind.
Across geographies
On the central-government measure, Canada's debt is lower than that of the United States and the United Kingdom. This is not a comparison of total public debt: provincial and state borrowing is outside the central-government measure.
Three sources give deficit figures that look comparable but are not. Canada's Budget 2026 projects a federal deficit of $62.3 billion, or 1.8 per cent of GDP, for 2026-27, falling to 1.3 per cent by 2030-31; Eurostat reports a euro-area general-government deficit of 3.0% of GDP for 2025, and the ECB projects 3.6% in 2026. The Canadian figure is a federal budget projection made in November 2026 and excludes provincial deficits; the European figures are an outturn and a projection for all levels of government. A like-for-like comparison would need general-government data, which this report does not have.
Evidence: Department of Finance Canada: Budget 2026, Economic and fiscal overview; Eurostat: Euro area government deficit at 3.0% and EU at 3.1% of GDP (October 2026 second notification); European Central Bank: Economic Bulletin, Issue 6, 2026
For developing economies, UNCTAD says global public debt continued to rise in 2025, with over two thirds held by developed countries that account for less than a fifth of the world's population, that interest rates on developing countries' public debt are structurally higher and have been raised further by responses to recent conflicts, that the interest bill reached close to $1 trillion in 2025, and that in Africa and Latin America and the Caribbean governments spend more per person on interest than on health or education. Tax revenue (central government, share of GDP) was 26.9% in the United Kingdom, 22.8% in France, 13.7% in Canada and 10.8% in the United States, so the revenue base differs as well.
Evidence: UNCTAD: A World of Debt 2026: Rising debt costs and stalling development
Tax revenue
Percent of GDP (central government).
Chart loads when it comes into view.
Latest values: Canada 13.71 (2024); United States 10.77 (2024); China 7.018 (2024); Japan 11.14 (1993); and 9 more in the data table.
Related relationships: United States · China · United Kingdom · Japan
What it influences
High debt and rising yields reduce the room for governments to cut taxes or raise spending without adding to borrowing. How far this binds depends on each government's debt maturity structure and credit standing, which are not assessed here.
Risks
If long-term yields stay at the levels in the bond market section, interest costs would rise for governments with large, short-maturity or floating-rate debt. This report cannot show which governments those are.
Evidence: relationship: Government of Canada bond yields and Government finances
What to watch
The Department of Finance's monthly Fiscal Monitor, the federal government's next budget or economic statement, Statistics Canada's quarterly government finance statistics, and (not included here) the US Treasury's monthly statement.
Prepared with AI assistance.
Follow the relationships
- Government finances 1 with evidence · 1 recorded Open in Studio
- Government of Canada bond yields 5 with evidence · 5 recorded Open in Studio
- US Treasury yields 4 with evidence · 4 recorded Open in Studio
Upcoming releases
- 2026-11-23 Quarterly financial statistics for enterprises Third quarter 2026 · Statistics Canada
Sources for this section (4 datasets, 16 documents)
Data
- Statement of government operations and balance sheet, government finance statistics, quarterly (10-10-0015-01; 1 series; latest Q2 2026; retrieved 2026-10-23)
- Central government debt, total (% of GDP) (all economies; World Bank) (WDI GC.DOD.TOTL.GD.ZS; series; latest annual; retrieved 2026-10-23)
- Net lending (+) / net borrowing (-) (% of GDP) (all economies; World Bank) (WDI GC.NLD.TOTL.GD.ZS; series; latest annual; retrieved 2026-10-23)
- Tax revenue (% of GDP) (all economies; World Bank) (WDI GC.TAX.TOTL.GD.ZS; series; latest annual; retrieved 2026-10-23)
Documents cited
- Department of Finance Canada: The Fiscal Monitor, August 2026 (retrieved 2026-11-07)
- Federal Reserve Board: Monetary Policy Report - July 2026, Part 1: Recent Economic and Financial Developments (retrieved 2026-10-25)
- U.S. Department of the Treasury: Treasury Announces Marketable Borrowing Estimates (July-September 2026) (retrieved 2026-10-25)
- U.S. Department of the Treasury: Quarterly Refunding Statement of Assistant Secretary for Financial Markets, November 4, 2026 (retrieved 2026-11-07)
- U.S. Department of the Treasury: Quarterly Refunding Statement, August 2026 (retrieved 2026-10-25)
- Office for National Statistics: Public sector finances, UK: September 2026 (retrieved 2026-10-25)
- European Central Bank: Economic Bulletin, Issue 6, 2026 (retrieved 2026-10-25)
- Eurostat: Euro area government deficit at 3.0% and EU at 3.1% of GDP (October 2026 second notification) (retrieved 2026-11-07)
- UK Debt Management Office: Revision to the DMO Financing Remit 2026-27 (retrieved 2026-10-25)
- Bank of England: Monetary Policy Summary and Minutes, September 2026 (retrieved 2026-11-07)
- European Central Bank: Financial Stability Review, May 2026 (retrieved 2026-10-25)
- Bank of England: Financial Stability Report, July 2026 (retrieved 2026-10-25)
- Bank for International Settlements: Annual Economic Report 2026, Chapter II: High public debt and shifting financial markets: challenges for central banks (retrieved 2026-10-25)
- Bank of Canada: Financial Stability Report 2026: Financial markets (retrieved 2026-10-25)
- Department of Finance Canada: Budget 2026, Economic and fiscal overview (retrieved 2026-11-07)
- UNCTAD: A World of Debt 2026: Rising debt costs and stalling development (retrieved 2026-10-25)
Each dataset is used under its licence; attribution and series-level detail are in each chart’s “About this data” panel. Limitations: World Bank central-government debt covers the central (federal) government only. General-government debt, which includes states, provinces and social security funds and is the figure most often quoted, is larger for many economies (including Canada); it is published by the IMF, whose series is not used here. Data for China, Japan, the euro area, Germany and France are missing in the World Bank database for recent years, and Germany's central-government debt series ends in 1990 and is not shown. The latest year varies from 2018 to 2024. The US Treasury's debt and deficit data are not included. Fiscal projections and debt-sustainability analysis are not assessed. Japan's and China's sovereign debt are not described. The Canadian federal deficit projection is quoted from Budget 2026, tabled on 5 November 2026.
Where is investment being made, and who is attracting foreign capital?
Investment equals 40.5% of GDP in China and 34.6% in India but 17.1% in Brazil; foreign direct investment into Canada is 3.0% of GDP
What happened
Investment, measured as gross capital formation, was 40.5% of GDP in China (2024), 34.6% in India, 29.1% in South Korea, 27.7% in Japan (2024), 24.5% in Australia, 22.6% in Mexico, 23.2% in Canada, 21.5% in the United States (2024), 19.7% in the United Kingdom and 17.1% in Brazil.
Investment: gross capital formation
Percent of GDP.
Chart loads when it comes into view.
Latest values: Canada 23.15 (2025); United States 21.53 (2024); China 40.48 (2024); Japan 27.68 (2024); and 10 more in the data table.
Related relationships: United States · China · United Kingdom · Japan
Foreign direct investment inflows were 3.4% of GDP in Brazil, 3.0% in Canada, 2.4% in Mexico, 2.1% in Australia and 1.0% in the United States in 2025.
Foreign direct investment, net inflows
Percent of GDP. Volatile; financial centres distort aggregates.
Chart loads when it comes into view.
Latest values: Canada 3.023 (2025); United States 0.998 (2025); China 0.41 (2025); Japan 1.033 (2025); and 9 more in the data table.
Related relationships: United States · China · United Kingdom · Japan
Why it happened
The United Nations Conference on Trade and Development's World Investment Report 2026 says global foreign direct investment flows rose 6 per cent in 2025, to US$1.6 trillion, that the growth in the value of FDI projects was driven largely by data centres, followed by oil and gas and semiconductors, and that most other sectors, including renewable energy, infrastructure other than data centres and manufacturing, saw significant declines.
Evidence: UNCTAD: World Investment Report 2026, Chapter I: International investment trends
It adds that governments are steering investment toward priority sectors with incentives, subsidies and screening, and that low-income and lower-middle-income economies captured only about 10 per cent of that investment in 2020 to 2025.
Governments adopted a record number of investment policy measures in 2025.
Evidence: UNCTAD: World Investment Report 2026, Chapter II: Investment policy trends
For Canada the report says inflows were broadly stable, concentrated in energy, critical minerals and infrastructure-related sectors, that uncertainty about the review of the United States-Mexico-Canada Agreement affected the investment environment, and that the value of announced projects in globally integrated manufacturing industries in Canada more than halved, driven primarily by shifts in the automotive industry. For the world as a whole it says the outlook for 2026 faces significant downside risks from trade policy uncertainty and geopolitical tensions.
Evidence: UNCTAD: World Investment Report 2026, Chapter I: International investment trends
Why it matters
Investment builds the capital stock that raises productivity and future output.
The Bank of Canada's October report says that robust spending on machinery and equipment, including AI-related investment, and activity in the oil and gas sector boosted business investment in Canada when growth picked up in the second quarter of 2026, and it expects new US tariffs to restrain exports and trade uncertainty to dampen business investment.
Evidence: Bank of Canada: Monetary Policy Report, October 2026: Current conditions
History
China's investment rate was 46.1% of GDP in 2010 and is 40.5%; India's was 39.8% and is 34.6%; Canada's was 23.5% and is 23.2%; the United States' was 18.7% and is 21.5%.
Across geographies
For Canada, quarterly data show net foreign direct investment into Canada of C$23.2 billion in Q2 2026 and Canadian direct investment abroad of C$14.4 billion. Real business gross fixed capital formation, which includes housing, was C$428.0 billion at an annual rate in the same quarter.
What it influences
Trade uncertainty and energy prices are two factors the sources cited tie to investment in Canada: UNCTAD says uncertainty about the review of the United States-Mexico-Canada Agreement affected the investment environment, and a Bank of Canada official said in March 2015 that, after the fall in oil prices since June 2014, business investment in the oil and gas sector was expected to fall in 2015. The data here cannot quantify either for 2026.
Evidence: Rhys Mendes, Opening Statement before the House of Commons Standing Committee on Finance (Bank of Canada), 12 March 2015; UNCTAD: World Investment Report 2026, Chapter I: International investment trends; Bank of Canada: Rhys Mendes, Opening Statement before the House of Commons Standing Committee on Finance, 12 March 2015
Risks
Investment tends to be among the most volatile parts of GDP. A prolonged period of trade uncertainty or tighter financial conditions could weigh on it; this report does not estimate by how much.
What to watch
Statistics Canada's quarterly national accounts and balance of payments, and the Bank of Canada's Business Outlook Survey (not included here).
Prepared with AI assistance.
Follow the relationships
- Business investment 0 with evidence · 0 recorded Open in Studio
- Business investment in oil and gas 0 with evidence · 0 recorded Open in Studio
- US tariff announcements and Canadian counter-measures (2026) 0 with evidence · 0 recorded Open in Studio
Upcoming releases
- 2026-11-30 Gross domestic product, income and expenditure Third quarter 2026 · Statistics Canada
Sources for this section (4 datasets, 5 documents)
Data
- Balance of international payments, flows of Canadian direct investment abroad and foreign direct investment in Canada, quarterly (36-10-0025-01; 2 series; latest Q2 2026; retrieved 2026-10-23)
- Gross domestic product, expenditure-based, Canada, quarterly (36-10-0104-01; 1 series; latest Q2 2026; retrieved 2026-10-23)
- Gross capital formation (% of GDP) (all economies; World Bank) (WDI NE.GDI.TOTL.ZS; series; latest annual; retrieved 2026-10-23)
- Foreign direct investment, net inflows (% of GDP) (all economies; World Bank) (WDI BX.KLT.DINV.WD.GD.ZS; series; latest annual; retrieved 2026-10-23)
Documents cited
- UNCTAD: World Investment Report 2026, Chapter I: International investment trends (retrieved 2026-10-25)
- UNCTAD: World Investment Report 2026, Chapter III: International investment in a turbulent era: Trends and policy response (retrieved 2026-10-25)
- UNCTAD: World Investment Report 2026, Chapter II: Investment policy trends (retrieved 2026-10-25)
- Bank of Canada: Monetary Policy Report, October 2026: Current conditions (retrieved 2026-11-07)
- Bank of Canada: Rhys Mendes, Opening Statement before the House of Commons Standing Committee on Finance, 12 March 2015 (retrieved 2026-11-07)
Each dataset is used under its licence; attribution and series-level detail are in each chart’s “About this data” panel. Limitations: Gross capital formation includes housing, public investment and inventories as well as business investment. Foreign direct investment inflows in the World Bank data originate with the IMF's balance of payments statistics (a third-party source that carries its own terms) and are volatile; flows through financial centres inflate them for some economies. Portfolio flows, bank lending flows, sovereign wealth fund activity and announced projects are not covered. The latest year of gross capital formation is 2024 or 2025.
How are emerging and developing economies doing relative to the advanced ones?
Lower-middle-income economies grew 6.0% in 2025, upper-middle-income 4.2% and high-income 1.9%
What happened
By the World Bank's income groups, growth in 2025 was 6.0% in lower-middle-income economies, 4.2% in upper-middle-income economies, 1.9% in high-income economies and 5.3% in low-income economies. The largest emerging economies in the sample grew 7.6% (India), 5.0% (China), 2.3% (Brazil), 5.1% (Indonesia) and 0.6% (Mexico).
Growth by income group
World Bank income classification (high, upper-middle, lower-middle, low income), not the IMF’s "advanced economies".
Chart loads when it comes into view.
Latest values: World 2.921 (2025); High income 1.907 (2025); Upper-middle income 4.205 (2025); Lower-middle income 5.962 (2025); and 1 more in the data table.
Why it happened
The World Bank's June 2026 Global Economic Prospects expects growth in emerging market and developing economies (EMDEs) to decelerate to 3.6 percent in 2026 and to rebound to an average of 4.2 percent over 2027–28; excluding China, it forecasts growth slowing from 3.9 percent in 2025 to 3.2 percent in 2026. It says EMDEs excluding China and India face almost a full decade of lost convergence with advanced-economy income levels, and that elevated debt and borrowing costs, along with new pressures such as spending on security needs and higher energy prices, are increasingly constraining their fiscal space.
Evidence: World Bank: Global Economic Prospects, June 2026 (full report, CC BY 3.0 IGO)
The Bank of Canada's October 2026 report says investment related to artificial intelligence continues to support activity in the United States and parts of Asia, while high energy costs weigh on growth in the euro area and other energy-importing economies.
Evidence: Bank of Canada: Monetary Policy Report, October 2026: Global economy
Why it matters
Emerging and developing economies are home to most of the world's people, and their demand affects commodity prices and Canadian exporters. This report does not measure their contribution to world demand. Canada's direct trade with the largest of them is small relative to its trade with the United States (see the trade section).
History
GDP per person at purchasing-power parity in China rose from $4,066 in 2000 to $25,067 in 2025, in India from $3,010 to $10,039, in Brazil from $14,005 to $20,025 and in Mexico from $20,470 to $21,912. Mexico's GDP per person rose 7.0% over the 25 years, against 39.8% in the United States.
Across geographies
India is 16% as productive per worker as the United States on the World Bank measure, China 31%, Brazil 27% and Mexico 31%. Inflation in 2025 was 5.0% in Brazil, 3.8% in Mexico, 2.4% in India and 0.1% in China.
Living standards: GDP per capita at purchasing-power parity
Constant 2021 international dollars per person.
Chart loads when it comes into view.
Latest values: Canada 57,990 (2025); United States 76,930 (2025); China 25,070 (2025); Japan 48,280 (2025); and 9 more in the data table.
Related relationships: United States · China · United Kingdom · Japan
Not one emerging world
The label hides large differences. Real GDP growth in 2025 ran from 7.6% in India to 0.6% in Mexico among the large emerging economies in this report. China (5.0%) and Indonesia (5.1%) grew at about the same pace; Brazil's 2.3% was close to the United States' 2.2%; and Mexico grew more slowly than Canada's 1.7%. Grouped by income, lower-middle-income economies grew 6.0%, against 1.9% for the high-income group.
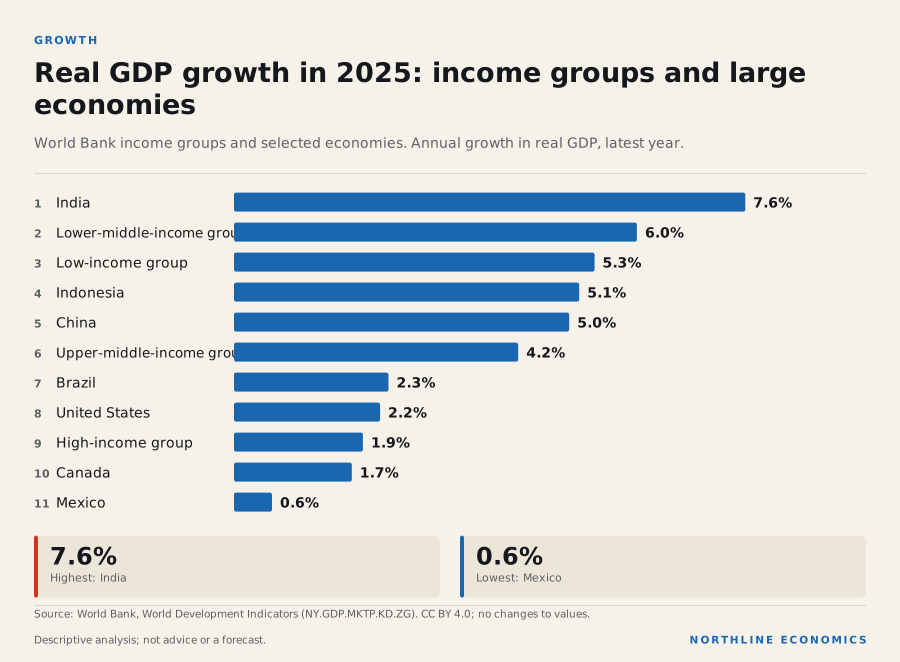
The data behind this graphic
| Item | Value |
|---|---|
| India | 7.6% |
| Lower-middle-income group | 6.0% |
| Low-income group | 5.3% |
| Indonesia | 5.1% |
| China | 5.0% |
| Upper-middle-income group | 4.2% |
| Brazil | 2.3% |
| United States | 2.2% |
| High-income group | 1.9% |
| Canada | 1.7% |
| Mexico | 0.6% |
Investment shows a similar split. Gross capital formation was 40.5% of GDP in China, 34.6% in India and 30.6% in Indonesia, against 22.6% in Mexico and 17.1% in Brazil, the lowest of the five and below Canada's 23.2%. This is a pattern across five countries, not evidence that investment alone causes growth; it does suggest that the slow-growing large economies are also the ones adding the least capital.
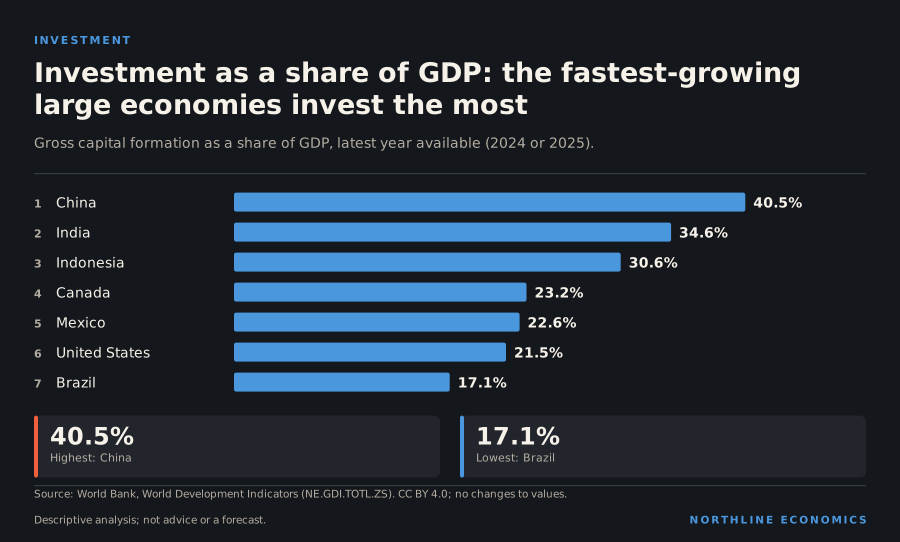
The data behind this graphic
| Item | Value |
|---|---|
| China | 40.5% |
| India | 34.6% |
| Indonesia | 30.6% |
| Canada | 23.2% |
| Mexico | 22.6% |
| United States | 21.5% |
| Brazil | 17.1% |
Prices and age structure differ too. Consumer price inflation in 2025 was 5.0% in Brazil, the highest of the five, and 3.8% in Mexico, while China's was 0.1%, close to zero; the series does not say whether that reflects weak demand, falling food prices or other causes. China is also ageing: 14.9% of its people are 65 or older, more than Brazil's 11.5% and about twice India's 7.4%, although well below Canada's 20.3%.
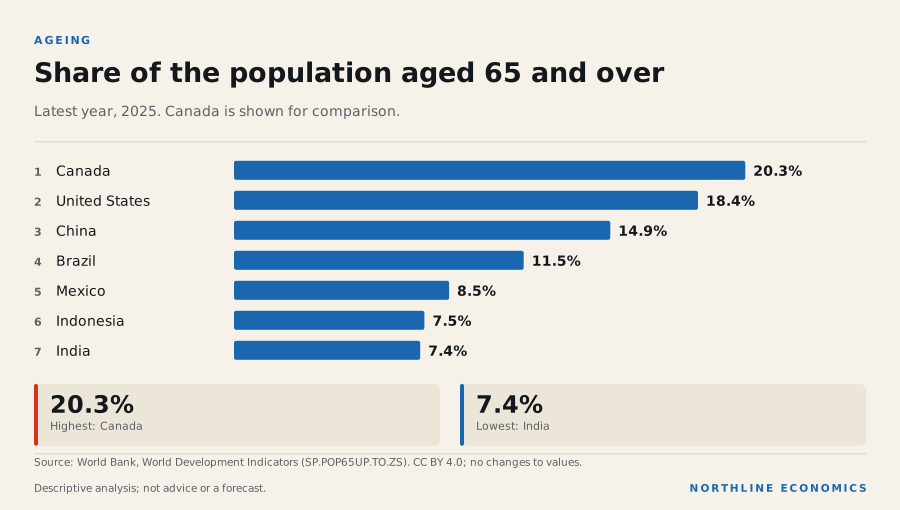
The data behind this graphic
| Item | Value |
|---|---|
| Canada | 20.3% |
| United States | 18.4% |
| China | 14.9% |
| Brazil | 11.5% |
| Mexico | 8.5% |
| Indonesia | 7.5% |
| India | 7.4% |
What this means for Canadian decisions
For an exporter, investor or lender, "emerging markets" is not a market. The growth, investment, inflation and age profiles above point to different customers, different currency and price risks, and different time horizons for each economy. Canada's actual exposure is small and concentrated, as the trade section shows, so the first question is which country, which product and which year, not which category. These figures are annual and describe the past; they are not forecasts, and several lag by a year or more.
What it influences
China was the destination for 4.5% of Canada's merchandise exports in 2025 and the source of 11.5% of its imports, so Canada's direct trade exposure to China is larger on the import side. Mexico supplied 6.8% of imports. Indirect exposure through commodity prices is not measured.
Evidence: relationship: Canada and China; relationship: China and Canada
Risks
The World Bank's International Debt Report says low- and middle-income countries' interest payments on external debt reached an all-time high for the second year in a row, increasing 2.2 percent in 2024 to US$415.4 billion, because persistently high interest rates combined with elevated debt stocks made servicing more expensive.
The World Bank's June report also says these economies face a major jobs challenge, as 1.2 billion young people are expected to reach working age by 2035.
Evidence: World Bank: Global Economic Prospects, June 2026 (full report, CC BY 3.0 IGO)
What to watch
The IMF's next World Economic Outlook (not included here), the World Bank's twice-yearly Global Economic Prospects, and national statistical releases for China and India (not included here).
Prepared with AI assistance.
Follow the relationships
- China 2 with evidence · 2 recorded Open in Studio
- World economic growth 0 with evidence · 0 recorded Open in Studio
Sources for this section (6 datasets, 3 documents)
Data
- GDP growth (annual %) (all economies; World Bank) (WDI NY.GDP.MKTP.KD.ZG; series; latest annual; retrieved 2026-10-23)
- GDP per capita, PPP (constant 2021 international $) (all economies; World Bank) (WDI NY.GDP.PCAP.PP.KD; series; latest annual; retrieved 2026-10-23)
- GDP per person employed (constant 2021 PPP $) (all economies; World Bank) (WDI SL.GDP.PCAP.EM.KD; series; latest annual; retrieved 2026-10-23)
- Inflation, consumer prices (annual %) (all economies; World Bank) (WDI FP.CPI.TOTL.ZG; series; latest annual; retrieved 2026-10-23)
- Gross capital formation (% of GDP) (all economies; World Bank) (WDI NE.GDI.TOTL.ZS; series; latest annual; retrieved 2026-10-23)
- Population ages 65 and above (% of total population) (all economies; World Bank) (WDI SP.POP.65UP.TO.ZS; series; latest annual; retrieved 2026-10-23)
Documents cited
- World Bank: Global Economic Prospects, June 2026 (full report, CC BY 3.0 IGO) (retrieved 2026-11-07)
- Bank of Canada: Monetary Policy Report, October 2026: Global economy (retrieved 2026-11-07)
- World Bank: International Debt Report 2025, Chapter 1: Analysis of External Debt Stock and Debt Flows as of End-2024 (retrieved 2026-10-25)
Each dataset is used under its licence; attribution and series-level detail are in each chart’s “About this data” panel. Limitations: The World Bank classifies economies by income group, not by the IMF's 'advanced' and 'emerging' categories, so the groups here are not the ones used in IMF commentary. Group aggregates are the World Bank's. Timely monthly data for emerging economies are not included. Sovereign debt distress, capital flow reversals and currency data for emerging markets are not assessed.
What could change the picture, and what is on the other side of the ledger?
The risks this report's sources name are the Middle East war and energy prices, the Canada–US trade dispute and tighter financial conditions; no forecast is published here
What happened
Three developments dominate the sources cited in this report. First, a war in the Middle East that, according to the Bank of Canada and Statistics Canada, is keeping energy prices high: Brent crude was US$125.00 in October 2026. Second, a trade dispute between Canada and the United States, with new tariffs and counter-measures since July (the tariffs section lists the US proclamations of July, August, September and October). Third, a rise in government bond yields, with the US ten-year at 4.84% and policy rates raised by the Federal Reserve, the ECB, the Bank of Canada and the Bank of England.
Crude oil prices
US dollars per barrel, monthly average (World Bank Pink Sheet). WTI is the benchmark for Canadian light crude; Brent and Dubai are the other main references.
Chart loads when it comes into view.
Latest values: Crude oil, WTI 97.7 (2026-10); Crude oil, Brent 125 (2026-10); Crude oil, Dubai 102.7 (2026-10).
Related relationships: World oil price (WTI) · 10 relationships use this data as evidence
Ten-year government bond yields: Canada, United States and euro area
Percent, daily. United States: Treasury constant-maturity yield (Federal Reserve H.15). Canada: Bank of Canada benchmark. Euro area: ECB estimate for AAA-rated central-government bonds, not the Bund and not an average of all members.
Chart loads when it comes into view.
Latest values: Canada 3.67 (2026-11-05); United States 4.84 (2026-11-05); Euro area (AAA) 3.294 (2026-11-05).
Related relationships: Government of Canada bond yields · US Treasury yields · Euro area government bond yields (AAA) · 6 relationships use this data as evidence
Why it happened
The sources name the causes only at the level of events.
The Bank of Canada said in September that the continuing conflict in the Middle East was keeping energy prices high, and that new US tariffs and Canadian counter-measures had followed the breakdown of trade talks.
Evidence: Bank of Canada: Bank of Canada maintains the policy rate (2 September 2026)
The Bank of Canada's October report says higher energy prices are weighing on economic activity, while global growth remains resilient, boosted by strong AI-related investment. This report does not analyse the origins of either conflict, and cites no source on them.
Evidence: Bank of Canada: Monetary Policy Report, October 2026: Global economy
Why it matters
In October the Bank of Canada named the evolution of energy prices and Canada's trade relationship with the United States as the two most important risks to its inflation outlook; its projection assumes that shipping through the Strait of Hormuz gradually returns to normal and refinery margins ease.
Evidence: Bank of Canada: Monetary Policy Report, October 2026: Risks
History
The 2022 energy and inflation shock is the closest recent precedent in the data here: World Bank annual inflation reached 8.0% for the world and 8.5% for the euro area that year, and the European gas price peaked at US$70.04 in August 2022. The euro area's monthly rate is now 4.0%, below that 2022 annual average (the two are different measures, so the comparison is only indicative). Whether the 2026 rise will persist is not known.
Across geographies
Exposure differs. The World Bank's net energy imports data in the energy section show Canada, the United States and Australia as net exporters, which gain from higher energy prices, and Japan, South Korea, Germany and India as net importers, which lose. The Canada–US dispute concerns two economies whose trade is dominated, on the Canadian side, by the United States: 72% of Canada's merchandise exports in 2025.
On the conflict's trade effects, the WTO says Middle East crude oil exports fell by roughly 24% and liquefied natural gas exports by 47% in the first half of 2026, and that increased shipments from other suppliers limited the decline in global crude oil exports to around 6%; it projects the Middle East's own merchandise exports to fall by 17.2% in 2026. Exposure is therefore uneven by region and by commodity, and importers were cushioned by substitution.
Evidence: World Trade Organization: Global Trade Outlook and Statistics Update (news release, 8 October 2026)
Financial exposure also differs. The Bank of England says gilt and euro-area yields rose more than US Treasury yields after the conflict began, reflecting concerns over their exposure to imported energy costs, though that trend has since reversed, and Japan's Ministry of Finance reports foreign exchange intervention of ¥11,734.9 billion in April to June 2026. The two are separate observations from separate institutions; neither source links the intervention to the energy shock.
Evidence: Bank of England: Financial Stability Report, July 2026; Ministry of Finance, Japan: Foreign Exchange Intervention Operations (April - June 2026)
What it influences
The chain runs from the Middle East conflict to oil prices, to consumer energy prices, to inflation, and from inflation to policy rates. Each link has its own evidence class, sensitivities are not multiplied along the chain and no end-to-end effect on any variable is estimated.
Evidence: relationship: Middle East conflict and disrupted energy shipping (2026) and World oil price (WTI); relationship: World oil price (WTI) and Consumer energy and gasoline prices; relationship: Consumer energy and gasoline prices and Consumer price inflation; Bank of Canada: Monetary policy at work (2023); Bank of Canada: Bank of Canada maintains the policy rate (2 September 2026)
Risks
The risks and opportunities below are those documented in the sources cited; each rests on the source named.
Risks:
- Energy prices: gasoline and fuel oil drove the September acceleration in Canadian inflation (Statistics Canada), and the Bank of Canada raised its rate to reduce the risk that continuing high energy prices spread to other prices (Bank of Canada). The data to watch are the Brent price and the CPI energy components.
- Trade conflict: tariffs raise costs for businesses and could pass through to consumer prices (Bank of Canada); announcements distort monthly trade data (Statistics Canada). The data to watch are Canadian exports to the United States and manufacturing sales.
- Financial conditions: the Bank of Canada's October report lists the risk that global financial conditions tighten more than expected and long-term bond yields rise further (Bank of Canada). The data to watch are bond yields and mortgage rates.
- Weak domestic demand in Canada: the Bank's October report says the effects of uncertainty, particularly around the Canada–US trade relationship, could be larger than expected, lowering household spending and business investment (Bank of Canada).
Opportunities:
- Technology investment: strong AI-related investment is boosting global growth (Bank of Canada) and 47% of the growth in world goods trade in the first half of 2026 came from AI-enabling goods (WTO). The data to watch are the WTO's goods trade barometer and euro area and Asian industrial production; whether Canada gains is not shown.
- Energy exports: higher oil prices raise the value of Canadian energy exports (C$20.6 billion in September 2026), though volumes and costs matter too.
Not assessed in this section: other geopolitical conflicts, cyber risk, climate-related disruption, sovereign debt distress, financial-sector stress.
What to watch
The Bank of Canada's next announcement on 9 December 2026; the next IEA Oil Market Report; further tariff changes; the Federal Reserve's decision on 9 December and the ECB's on 17 December; the IMF's World Economic Outlook, which is not included here and which this report recommends reading directly.
Prepared with AI assistance.
Follow the relationships
- Middle East conflict and disrupted energy shipping (2026) 1 with evidence · 1 recorded Open in Studio
- US tariff announcements and Canadian counter-measures (2026) 0 with evidence · 0 recorded Open in Studio
- US Treasury yields 4 with evidence · 4 recorded Open in Studio
- World oil price (WTI) 16 with evidence · 16 recorded Open in Studio
- World economic growth 0 with evidence · 0 recorded Open in Studio
Upcoming releases
- 2026-12-09 Bank of Canada interest rate announcement · Bank of Canada
- 2026-12-09 FOMC interest rate decision and Summary of Economic Projections · Federal Reserve (FOMC)
- 2027-01-27 Bank of Canada interest rate announcement and Monetary Policy Report · Bank of Canada
- 2027-01-27 FOMC interest rate decision · Federal Reserve (FOMC)
Sources for this section (5 datasets, 6 documents)
Data
- Crude oil, Brent, monthly average price (Pink Sheet (monthly prices); 2 series; latest October 2026; retrieved 2026-11-05)
- US Treasury yield, 10-year (Federal Reserve statistical release H.15; 1 series; latest 5 November 2026; retrieved 2026-11-07)
- Consumer prices, harmonised index (HICP), annual rate of change: Euro area (EA11-1999, EA12-2001, EA13-2007, EA15-2008, EA16-2009, EA17-2011, EA18-2014, EA19-2015, EA20-2023, EA21-2026) (Eurostat prc_hicp_minr; 1 series; latest October 2026; retrieved 2026-11-05)
- International merchandise trade by commodity, monthly (12-10-0163-01; 1 series; latest September 2026; retrieved 2026-11-05)
- Inflation, consumer prices (annual %) (all economies; World Bank) (WDI FP.CPI.TOTL.ZG; series; latest annual; retrieved 2026-10-23)
Documents cited
- Bank of Canada: Bank of Canada maintains the policy rate (2 September 2026) (retrieved 2026-10-22)
- Bank of Canada: Monetary Policy Report, October 2026: Global economy (retrieved 2026-11-07)
- Bank of Canada: Monetary Policy Report, October 2026: Risks (retrieved 2026-11-07)
- World Trade Organization: Global Trade Outlook and Statistics Update (news release, 8 October 2026) (retrieved 2026-10-25)
- Bank of England: Financial Stability Report, July 2026 (retrieved 2026-10-25)
- Ministry of Finance, Japan: Foreign Exchange Intervention Operations (April - June 2026) (retrieved 2026-10-25)
Each dataset is used under its licence; attribution and series-level detail are in each chart’s “About this data” panel. Limitations: This section is a register of documented risks, not a forecast and not a ranking by probability. Each entry rests on the sources named in the sentence. No quantitative scenario or sensitivity analysis is made. Risks that are widely discussed but not assessed in this section (for example other regional conflicts, cyber risk, climate-related disruption, financial-sector stress, sovereign debt distress in emerging markets) are listed as not assessed and are not ranked.
How is Canada doing against the world, and how do global forces reach Canada's provinces and cities?
Canada ranked 5th of 13 in growth and 4th of 13 in GDP per person in 2025; its policy rate is 2.50% after a late-October increase, while the Fed and the ECB raised theirs earlier in the year
What happened
On the World Bank's annual data for the thirteen economies compared in this report, Canada's 2025 GDP growth of 1.7% ranks 5th of 13, GDP per person at purchasing-power parity ($57,990) ranks 4th of 13, output per worker ($113,563) ranks 6th of 13 and trade as a share of GDP (63.5%) ranks (among the economies with 2025 data) 6th of 11. The unemployment rate in the annual data (6.9%) ranks 2nd of 13 (highest first). Canada is a net energy exporter: net energy imports are -95.0% of energy use.
Against the three most comparable monthly series, in the latest data: inflation is 3.1% in Canada, 3.7% in the United States, 4.0% in the euro area and 3.5% in the United Kingdom; unemployment is 6.7% in Canada, 4.2% in the United States, 6.5% in the euro area and 4.7% in the United Kingdom; and policy rates are 2.50% (Canada), 3.88% (United States, effective rate) and 2.50% (euro area deposit rate).
Unemployment rates: United States, euro area, United Kingdom and Canada
Percent, seasonally adjusted, monthly. Each country’s survey and definitions differ; the UK series is a three-month rolling measure.
Chart loads when it comes into view.
Latest values: United States 4.2 (2026-09); Euro area 6.5 (2026-09); United Kingdom 4.7 (2026-07); Canada 6.7 (2026-10).
Related relationships: United States · United Kingdom · Canada · Euro area
Why it happened
Position is an outcome of many things not measured here. Two facts from the sources cited describe the 2026 picture.
The Bank of Canada's October report says Canadian economic growth picked up in the second quarter of 2026, driven mainly by solid consumption and strong gains in investment and exports, and that housing activity remains weak.
Evidence: Bank of Canada: Monetary Policy Report, October 2026: Current conditions
Statistics Canada reported that in September 2026 the participation rate was the lowest since December 1997 outside 2020.
Evidence: Statistics Canada: The Daily: Labour Force Survey, September 2026
Canada's central bank was in a different position from the Fed in September, and the two banks gave different reasons. The Bank of Canada left its policy rate unchanged on 2 September, saying demand for labour remains subdued and indicators point to continued excess supply in the economy, while it also said upside risks to inflation had increased. On 28 October it raised the rate. The Federal Reserve minutes record that the staff attributed US inflation mostly to past tariff increases, higher energy and input costs and AI-related goods prices, that some participants worried that after more than five years of inflation above 2 percent, elevated inflation could begin to affect expectations, and that several participants viewed the policy rate as not restrictive or only mildly restrictive. The Fed raised its target range at that meeting; the Bank of Canada held.
Evidence: Bank of Canada: Bank of Canada maintains the policy rate (2 September 2026); Bank of Canada: Bank of Canada raises the policy rate by 25 basis points to 2½% (28 October 2026); Federal Reserve Board: Minutes of the Federal Open Market Committee, September 15-16, 2026
Peers also differ from each other. The Bank of Canada's October report says yields in Canada have increased but by less than in the United States, and that the Canadian dollar weakened somewhat because of US-dollar strength but has since recovered to around 71 US cents. The Bank of England's committee, by contrast, held Bank Rate in a 6–3 vote in September, with three members preferring an increase, and raised it to 4% in an 8–1 vote announced on 5 November.
Evidence: Bank of Canada: Monetary Policy Report, October 2026: Current conditions; Bank of England: Monetary Policy Summary and Minutes, September 2026; Bank of England: Monetary Policy Summary and minutes of the Monetary Policy Committee meeting ending on 4 November 2026
Why it matters
Canada's position shapes how outside forces feed through. A small, open, energy-exporting economy that sends most exports to one market is helped by energy prices and exposed to that market's demand and policy. The data in this section show each of those characteristics; they do not by themselves show how Canada will fare.
History
Canada's GDP per person at purchasing-power parity was 75% of the US level in 2025. In 2000 Canada's was $48,399 and the United States' $55,046. Australia's rose 33.5% over the 25 years to 2025 against Canada's 19.8%.
Across geographies
Global developments reach Canada's provinces unevenly. The share of each province's domestic merchandise exports going to the United States in 2025 ranged from 90% in New Brunswick to 35% in Newfoundland and Labrador, with 85% in Alberta, 72% in Ontario and 51% in British Columbia; energy products were 76% of Alberta's exports, 33% of Saskatchewan's and 54% of Newfoundland and Labrador's. Statistics Canada customs data attribute exports to the province of origin of the goods.
What it influences
The relationship explorer holds these exposures as documented-exposure edges, one per province. They say how much of a province's exports go to the United States or consist of energy; they do not say how a change in US demand or oil prices would change a province's output.
Evidence: relationship: United States and Alberta; relationship: United States and Ontario; relationship: United States and British Columbia; relationship: United States and Quebec; relationship: World oil price (WTI) and Alberta; relationship: World oil price (WTI) and Saskatchewan; relationship: World oil price (WTI) and Newfoundland and Labrador
Observed correlations between oil prices and employment in Calgary (0.37), Edmonton (0.41) and Toronto (0.37) are similar in size. A similar coefficient in all three means this measure does not distinguish oil-producing from non-producing cities, and it should not be read as evidence that oil drives employment in any of them.
Evidence: relationship: World oil price (WTI) and Calgary; relationship: World oil price (WTI) and Edmonton; relationship: World oil price (WTI) and Toronto
Calgary, Edmonton, Toronto, Vancouver, Montréal, Ottawa and the other cities covered each have a city page.
Risks
See the risks section: the three developments that dominate the sources cited there affect Canada through energy prices (a gain on the export side, a cost for consumers), the United States as the main export market (tariffs and demand) and global financial conditions (yields and mortgage rates).
What to watch
The Bank of Canada's next announcement on 9 December 2026 (it said there could be a need to increase the policy rate further); Statistics Canada's monthly releases; the Federal Reserve and ECB decisions; Canada's performance relative to the United States on growth, inflation and unemployment.
Prepared with AI assistance.
| Indicator | Canada | Year | Rank | Highest · lowest |
|---|---|---|---|---|
| GDP per capita (PPP, $) | 57,990 | 2025 | 4 of 13 | United States 76,931 · India 10,039 |
| GDP growth (%) | 1.7 | 2025 | 6 of 13 | India 7.6 · Germany 0.2 |
| Inflation (%) | 2.1 | 2025 | 10 of 13 | Brazil 5.0 · China 0.1 |
| Unemployment (%, modelled) | 6.9 | 2025 | 2 of 13 | France 7.5 · Japan 2.5 |
| Trade openness (% of GDP) | 64 | 2025 | 5 of 13 | South Korea 86 · United States 25 |
| Output per worker (PPP $) | 113,563 | 2025 | 5 of 13 | United States 156,983 · India 24,842 |
| R&D (% of GDP) | 1.8 | 2024 | 9 of 13 | South Korea 4.9 · Mexico 0.3 |
| Manufacturing (% of GDP) | 9.3 | 2022 | 11 of 13 | South Korea 27.4 · Australia 5.3 |
Rankings are descriptive and not a verdict on policy. Rank is among the 13 national economies tracked (EU and euro area aggregates excluded); years differ by indicator; 1 is the highest value, not necessarily the best outcome. Continue to the Canada report →
Follow the relationships
- Canada 12 with evidence · 22 recorded Open in Studio
- Alberta 14 with evidence · 17 recorded Open in Studio
- Ontario 9 with evidence · 12 recorded Open in Studio
- British Columbia 10 with evidence · 12 recorded Open in Studio
- Quebec 9 with evidence · 11 recorded Open in Studio
- Newfoundland and Labrador 10 with evidence · 11 recorded Open in Studio
- Calgary 1 with evidence · 2 recorded Open in Studio
- Edmonton 1 with evidence · 2 recorded Open in Studio
- Toronto 1 with evidence · 2 recorded Open in Studio
- Vancouver 0 with evidence · 1 recorded Open in Studio
- Montréal 0 with evidence · 1 recorded Open in Studio
- Ottawa–Gatineau 0 with evidence · 1 recorded Open in Studio
Upcoming releases
- 2026-11-16 Consumer Price Index October 2026 · Statistics Canada
- 2026-12-04 Labour Force Survey November 2026 · Statistics Canada
- 2026-12-09 Bank of Canada interest rate announcement · Bank of Canada
- 2027-01-27 Bank of Canada interest rate announcement and Monetary Policy Report · Bank of Canada
Sources for this section (17 datasets, 7 documents)
Data
- Consumer Price Index, monthly, not seasonally adjusted (18-10-0004-01; 1 series; latest September 2026; retrieved 2026-10-23)
- US CPI-U, 12-month change (BLS CUUR0000SA0; 1 series; latest September 2026; retrieved 2026-11-05)
- Consumer prices, harmonised index (HICP), annual rate of change: Euro area (EA11-1999, EA12-2001, EA13-2007, EA15-2008, EA16-2009, EA17-2011, EA18-2014, EA19-2015, EA20-2023, EA21-2026) (Eurostat prc_hicp_minr; 1 series; latest October 2026; retrieved 2026-11-05)
- UK CPI, 12-month rate (ONS MM23 / D7G7; 1 series; latest September 2026; retrieved 2026-11-05)
- Labour force characteristics, monthly, seasonally adjusted and trend-cycle (14-10-0287-01; 1 series; latest October 2026; retrieved 2026-11-07)
- US unemployment rate, 16 years and over, seasonally adjusted (BLS LNS14000000; 1 series; latest September 2026; retrieved 2026-11-05)
- Unemployment rate, seasonally adjusted, share of the labour force: Euro area – 21 countries (from 2026) (Eurostat une_rt_m; 1 series; latest September 2026; retrieved 2026-11-05)
- UK unemployment rate, aged 16 and over, seasonally adjusted (ONS LMS / MGSX; 1 series; latest July 2026; retrieved 2026-11-05)
- Bank of Canada target for the overnight rate (business daily) (V39079; 1 series; latest 5 November 2026; retrieved 2026-11-07)
- US federal funds effective rate, weekly average (Federal Reserve statistical release H.15; 1 series; latest 4 November 2026; retrieved 2026-11-07)
- ECB deposit facility rate (ECB FM; 1 series; latest 7 November 2026; retrieved 2026-11-07)
- GDP growth (annual %) (all economies; World Bank) (WDI NY.GDP.MKTP.KD.ZG; series; latest annual; retrieved 2026-10-23)
- GDP per capita, PPP (constant 2021 international $) (all economies; World Bank) (WDI NY.GDP.PCAP.PP.KD; series; latest annual; retrieved 2026-10-23)
- GDP per person employed (constant 2021 PPP $) (all economies; World Bank) (WDI SL.GDP.PCAP.EM.KD; series; latest annual; retrieved 2026-10-23)
- Trade (% of GDP) (all economies; World Bank) (WDI NE.TRD.GNFS.ZS; series; latest annual; retrieved 2026-10-23)
- Unemployment, total (% of total labor force) (modeled ILO estimate) (all economies; World Bank) (WDI SL.UEM.TOTL.ZS; series; latest annual; retrieved 2026-10-23)
- Energy imports, net (% of energy use) (all economies; World Bank) (WDI EG.IMP.CONS.ZS; series; latest annual; retrieved 2026-10-23)
Documents cited
- Bank of Canada: Monetary Policy Report, October 2026: Current conditions (retrieved 2026-11-07)
- Statistics Canada: The Daily: Labour Force Survey, September 2026 (retrieved 2026-10-25)
- Bank of Canada: Bank of Canada maintains the policy rate (2 September 2026) (retrieved 2026-10-22)
- Bank of Canada: Bank of Canada raises the policy rate by 25 basis points to 2½% (28 October 2026) (retrieved 2026-11-07)
- Federal Reserve Board: Minutes of the Federal Open Market Committee, September 15-16, 2026 (retrieved 2026-11-07)
- Bank of England: Monetary Policy Summary and Minutes, September 2026 (retrieved 2026-11-07)
- Bank of England: Monetary Policy Summary and minutes of the Monetary Policy Committee meeting ending on 4 November 2026 (retrieved 2026-11-06)
Each dataset is used under its licence; attribution and series-level detail are in each chart’s “About this data” panel. Limitations: Rankings use World Bank annual data for thirteen economies chosen by Northline (which overlap: the euro area includes Germany and France), with different latest years for some indicators, and describe position, not performance or policy. Timely comparisons use different national definitions. Provincial and city links are documented exposure shares and observed correlations, not estimates of how a global change would affect them; the sections for individual provinces and cities are in the Canada and city reports.
How unequal are the major economies, and how far apart are rich and poor countries?
Inequality ranges from 23.0 on the Gini index in India to 50.3 in Brazil among the economies charted, and 52.5% of people in low-income economies live below the international extreme-poverty line
What happened
The latest Gini index values for the economies charted run from 23.0 in India (2023) to 50.3 in Brazil (2024). Canada's is 31.5 (2022), the United States' 41.8 (2024), the United Kingdom's 32.4 (2021), Germany's 33.7 (2022), Mexico's 42.6 (2024) and China's 36.0 (2022).
Income inequality: the Gini index
Gini index of income or consumption from household surveys (0 = perfect equality, 100 = perfect inequality). Surveys are not annual and use different bases across economies, so points are survey years and levels are indicative, not exactly comparable.
Chart loads when it comes into view.
Latest values: Canada 31.5 (2022); United States 41.8 (2024); China 36 (2022); Japan 32.3 (2020); and 9 more in the data table.
Related relationships: United States · China · United Kingdom · Japan
Extreme poverty, the share of people living below the World Bank's international extreme-poverty line, was 52.5% in low-income economies, 12.4% in lower-middle-income economies, 2.1% in upper-middle-income economies and 0.6% in high-income economies in 2024; for the world as a whole it was 10.1%.
Extreme poverty by income group
Share of the population living below US$3.00 a day (2021 purchasing-power-parity prices), World Bank estimates; group aggregates are the World Bank’s.
Chart loads when it comes into view.
Latest values: World 10.1 (2024); High income 0.6 (2024); Upper-middle income 2.1 (2024); Lower-middle income 12.4 (2024); and 1 more in the data table.
Why it happened
The World Bank says the number of people worldwide living in extreme poverty declined from around 2.3 billion in 1990 to 811 million in 2026.
Its June 2026 Global Economic Prospects says nearly one in two developing economies has failed since 2019 to narrow the income gap with the most prosperous economies, that real per capita GDP growth in low-income countries is forecast to average 2.7 percent a year over 2026-28, unevenly distributed and insufficient to reduce poverty, and that rising government debt leads to higher interest rates, higher debt-service payments and a greater likelihood of debt distress.
Evidence: World Bank: Global Economic Prospects, June 2026 (full report, CC BY 3.0 IGO)
The United Nations' World Social Report 2026 says more than 50 countries experienced rising income inequality between 2000 and 2024, including 23 high-income countries, and calls for renewed international cooperation to expand fiscal space and reduce debt-service burdens.
Not assessed: within-country inequality beyond the Gini panel, wealth inequality, and the causes of the differences between countries, for which the sources cited give only the broad pattern above.
Why it matters
How income is shared affects consumer demand, public finances and political choices about taxes and spending; extreme poverty marks where basic needs are unmet. The Gini index summarises the whole distribution in one number and cannot show who gains or loses.
History
Life expectancy at birth in 2024 was 80.4 years in high-income economies, 76.0 in upper-middle-income, 69.5 in lower-middle-income and 65.2 in low-income economies. In China it rose from 72.3 years in 2000 to 78.0, in India from 62.7 to 72.2 and in Canada from 79.2 to 82.1.
Life expectancy at birth
Years. World Bank series built from national and UN estimates.
Chart loads when it comes into view.
Latest values: Canada 82.11 (2024); United States 78.89 (2024); China 78.02 (2024); Japan 84.04 (2024); and 10 more in the data table.
Related relationships: United States · China · United Kingdom · Japan
Across geographies
GDP per person at purchasing-power parity in 2025 was $59,556 in high-income economies and $2,481 in low-income economies, so the low-income average was 4% of the high-income average.
What it influences
The same report says that of the 1.1 billion people living in multidimensional poverty, 887 million are exposed to at least one major climate hazard. No relationship in the recorded graph links inequality or poverty to another variable.
Not assessed: how aid, remittances and debt relief affect poverty in any single country; this edition cites no source on those.
Two kinds of gap: between countries and within them
The figures describe two different problems. Between income groups the gaps are very large: 52.5% of people in low-income economies live below the extreme-poverty line against 0.6% in high-income economies, and life expectancy at birth is 65.2 years against 80.4. Within countries the pattern is looser. The Gini index is 50.3 in Brazil and 42.6 in Mexico, but also 41.8 in the United States, a high-income economy that is more unequal on this measure than China (36.0) or Canada (31.5). In these figures, income level does not predict how evenly income is shared.
Be careful with the lowest values. India's 23.0 is the lowest in the sample, but survey-based measures can be built from household consumption rather than income, which usually looks more equal, and the series here does not say which basis each country uses. Compare countries only with that caveat, and compare each country with its own earlier surveys where possible.
What this means for Canadian decisions
For a business entering a market, average income and the distribution of income answer different questions: the first sizes demand, the second shows how much of it sits with a small group. For policymakers and analysts, Canada's Gini of 31.5 (2022) is lower than that of the United States, the United Kingdom (32.4) and Germany (33.7). Those are survey years that differ between countries, and the index summarises the whole distribution in one number, so it cannot show who gains or loses.
Risks
Survey-based measures are revised when new surveys or purchasing-power benchmarks arrive, and a few surveys can change a country's position. Points in the chart are survey years, not a continuous record, and the latest year differs by economy (see the periods above).
What to watch
The World Bank's next update of its poverty and inequality data. No release date for it is in the calendar this site holds, and none is assumed.
Prepared with AI assistance.
Follow the relationships
- World economic growth 0 with evidence · 0 recorded Open in Studio
Sources for this section (4 datasets, 3 documents)
Data
- Gini index (all economies; World Bank) (WDI SI.POV.GINI; series; latest annual; retrieved 2026-10-23)
- Poverty headcount ratio at $3.00 a day (2021 PPP) (% of population) (all economies; World Bank) (WDI SI.POV.DDAY; series; latest annual; retrieved 2026-10-23)
- Life expectancy at birth, total (years) (all economies; World Bank) (WDI SP.DYN.LE00.IN; series; latest annual; retrieved 2026-10-23)
- GDP per capita, PPP (constant 2021 international $) (all economies; World Bank) (WDI NY.GDP.PCAP.PP.KD; series; latest annual; retrieved 2026-10-23)
Documents cited
- World Bank Group: Poverty (World Bank topic page) (retrieved 2026-11-02)
- World Bank: Global Economic Prospects, June 2026 (full report, CC BY 3.0 IGO) (retrieved 2026-11-07)
- United Nations, Department of Economic and Social Affairs: World Social Report 2026: The New Economics of Social Inclusion (retrieved 2026-10-25)
Each dataset is used under its licence; attribution and series-level detail are in each chart’s “About this data” panel. Limitations: The Gini index comes from household surveys that are not annual and use different bases (income or consumption), so levels are indicative and years differ by economy; only survey years exist. Group aggregates for the Gini do not exist in this dataset. Poverty is measured at one international line (US$3.00 a day, 2021 prices) and says nothing about poverty by national lines, wealth, or inequality within regions. Differences between economies reflect many things the data do not separate. This section cites no source that explains the differences.
How are economies changing in what they produce, where people live and how much they invest in technology?
Agriculture is 16.2% of output in India (2025) and 1.9% in Canada (2022), urban residents are 35.7% of India's people against 82.9% of Canada's, and research spending ranges from 0.3% of GDP in Mexico to 4.9% in South Korea
What happened
Agriculture adds 16.2% of output in India, 13.1% in Indonesia, 6.7% in China and 6.1% in Brazil, against 1.9% in Canada (2022), 0.9% in the United States (2021) and 0.6% in the United Kingdom. By income group it is 27.2% in low-income economies and 1.3% in high-income economies.
Agriculture’s share of the economy
Value added by agriculture, forestry and fishing, percent of GDP.
Chart loads when it comes into view.
Latest values: Canada 1.933 (2022); United States 0.943 (2021); China 6.659 (2025); Japan 0.958 (2024); and 9 more in the data table.
Related relationships: United States · China · United Kingdom · Japan
Manufacturing adds 27.4% of output in South Korea, 24.7% in China, 18.8% in Japan (2024), 17.6% in Germany, 20.0% in Mexico, 10.5% in the United States (2021) and 9.3% in Canada (2022).
Manufacturing value added
Percent of GDP.
Chart loads when it comes into view.
Latest values: Canada 9.324 (2022); United States 10.53 (2021); China 24.73 (2025); Japan 18.82 (2024); and 9 more in the data table.
Related relationships: United States · China · United Kingdom · Japan
Why it happened
Sector shares change for many reasons that these series do not separate.
UNCTAD reports that in developing Asia announced manufacturing investment contracted by about 28 per cent in 2025, linking the slowdown to restrictive tariff measures, trade policy uncertainty and the postponement or scaling down of investment decisions.
Evidence: UNCTAD: World Investment Report 2026, Chapter I: International investment trends
It says the reconfiguration of global supply chains presents both challenges and opportunities, widening the gap between better-positioned developing economies and others.
China's statistics bureau reports that manufacturing investment was down 2.1 percent in January to September 2026.
Not assessed: why sector shares of output and employment and urbanisation have changed over time, which no source cited explains; the paragraphs above describe investment and trade patterns, not the shares themselves.
Why it matters
The mix of what an economy produces shapes its exposure to commodity prices, trade measures and technology change, and its need for workers with particular skills. This section describes the mix; it does not forecast how it will change.
History
Urban population share
Percent of the total population living in urban areas as each country defines them (definitions differ).
Chart loads when it comes into view.
Latest values: Canada 82.88 (2025); United States 80.19 (2025); China 66.34 (2025); Japan 92.3 (2025); and 10 more in the data table.
Related relationships: United States · China · United Kingdom · Japan
Urban residents were 57.8% of the world's people in 2025, up from 42.8% in 1990. In China the urban share rose from 26.2% in 1990 to 66.3%, and in India from 25.6% to 35.7%.
Across geographies
Internet use was 23.4% of the population in low-income economies and 94.2% in high-income economies in 2025; in Canada it was 94.4% (2024), in India 70.0% and in Indonesia 72.8% (2024).
Research and development spending was 4.9% of GDP in South Korea (2023), 3.4% in the United States (2023), 3.2% in Germany, 2.6% in China, 2.7% in the United Kingdom and 1.8% in Canada (2024).
Research and development spending
Percent of GDP.
Chart loads when it comes into view.
Latest values: Canada 1.791 (2024); United States 3.447 (2023); China 2.577 (2023); Japan 3.441 (2023); and 9 more in the data table.
Related relationships: United States · China · United Kingdom · Japan
Internet use
Percent of the population using the internet (ITU estimates distributed by the World Bank).
Chart loads when it comes into view.
Latest values: Canada 94.35 (2024); United States 94.69 (2024); China 91.6 (2025); Japan 85.54 (2024); and 10 more in the data table.
Related relationships: United States · China · United Kingdom · Japan
The same transition at different speeds
Across income groups, the economy changes shape in a recognisable order. Agriculture's share of GDP falls steeply: 27.2% in low-income economies, 17.8% in lower-middle-income, 6.9% in upper-middle-income and 1.3% in high-income economies. Urbanisation and connectivity rise alongside: the urban share of the population climbs from 35.2% to 80.2%, and the share of people using the internet from 23.4% to 94.2%.
Manufacturing is the exception. Its share of GDP is 8.5% in low-income economies, rises to 21.0% in the upper-middle-income group and falls back to 12.0% in high-income economies. China (24.7%) sits at the peak; Mexico (20.0%) is close behind; Canada's 9.3% (2022) is below the high-income group's. Group averages describe a pattern across countries, not a path every country follows, and the latest year differs between economies.
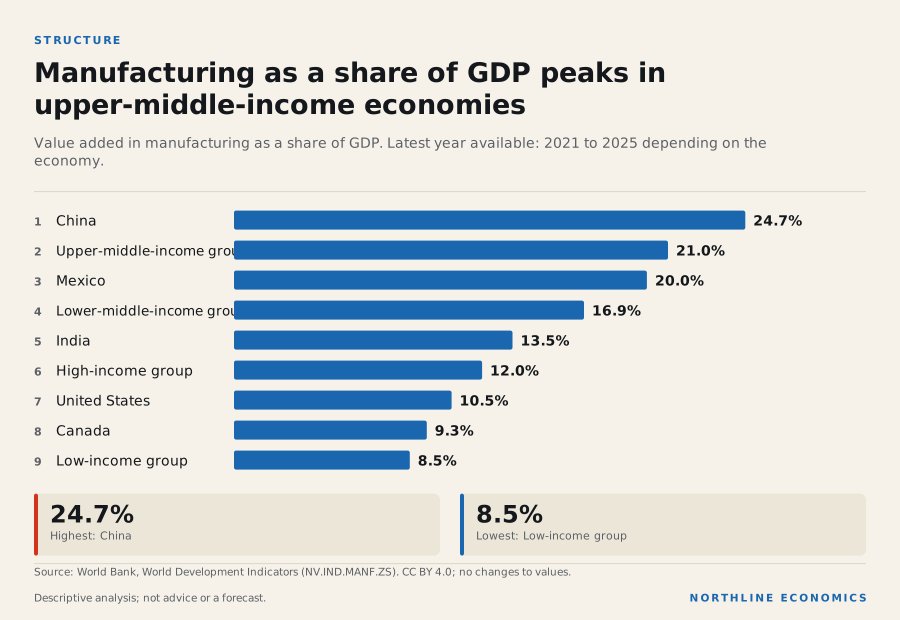
The data behind this graphic
| Item | Value |
|---|---|
| China | 24.7% |
| Upper-middle-income group | 21.0% |
| Mexico | 20.0% |
| Lower-middle-income group | 16.9% |
| India | 13.5% |
| High-income group | 12.0% |
| United States | 10.5% |
| Canada | 9.3% |
| Low-income group | 8.5% |
Innovation spending separates the high-income group more clearly. Research and development was 2.9% of GDP in the high-income group, 3.4% in the United States and 2.6% in China, against 1.8% in Canada (2024) and 0.6% in India. China has already passed the upper-middle-income average of 2.0%; Canada has not reached the high-income average.
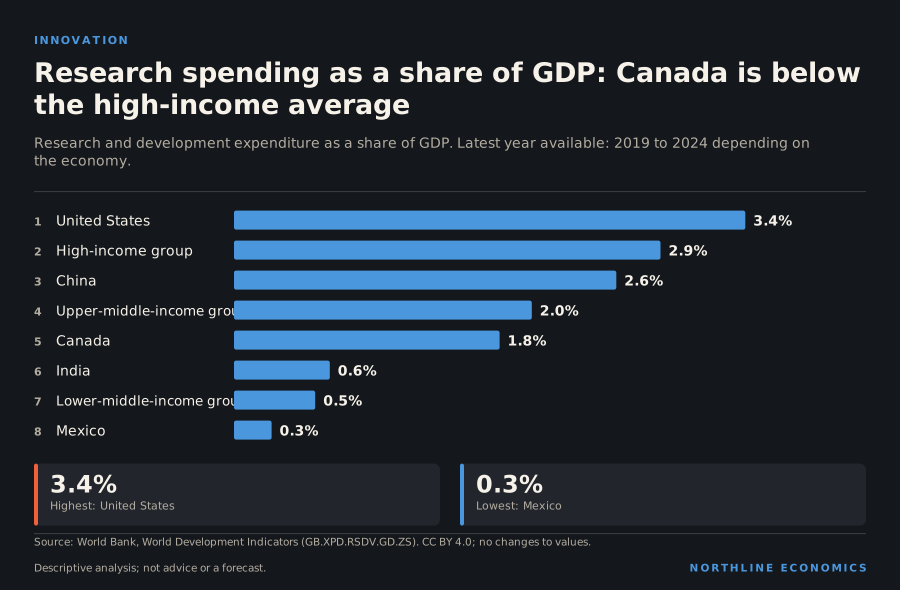
The data behind this graphic
| Item | Value |
|---|---|
| United States | 3.4% |
| High-income group | 2.9% |
| China | 2.6% |
| Upper-middle-income group | 2.0% |
| Canada | 1.8% |
| India | 0.6% |
| Lower-middle-income group | 0.5% |
| Mexico | 0.3% |
What this means for Canadian decisions
For an investor or business planner, the sequence matters more than any single figure. Economies at the manufacturing peak buy machinery, inputs and energy; economies that are urbanising and connecting fast buy infrastructure and services; high-income economies compete on knowledge, where Canada's research spending is below the high-income average. These are descriptions of the past, measured in different years, and they do not forecast any country's path.
What it influences
Statistics Canada reports that wholesale trade and manufacturing were the top contributors to growth in business labour productivity in the second quarter of 2026.
The World Bank's June 2026 Global Economic Prospects says higher productivity related to AI adoption could raise trend global growth. No relationship in the recorded graph links sector shares, urbanisation or research spending to another variable.
Evidence: World Bank: Global Economic Prospects, June 2026 (full report, CC BY 3.0 IGO)
Not assessed: how quickly the shifts described above will continue; no source cited gives a projection of sector shares.
Risks
Shares of GDP change when prices change, so a sector's share can move without any change in the volume it produces. Spending on research is an input, not a measure of what it achieves. Years differ across the series and countries, so the figures above are not a single-year snapshot.
What to watch
The World Bank's and UNESCO's next updates of these series. No release dates are in the calendar this site holds, and none is assumed.
Prepared with AI assistance.
Follow the relationships
- China 2 with evidence · 2 recorded Open in Studio
Sources for this section (5 datasets, 5 documents)
Data
- Agriculture, forestry, and fishing, value added (% of GDP) (all economies; World Bank) (WDI NV.AGR.TOTL.ZS; series; latest annual; retrieved 2026-10-23)
- Manufacturing, value added (% of GDP) (all economies; World Bank) (WDI NV.IND.MANF.ZS; series; latest annual; retrieved 2026-10-23)
- Urban population (% of total population) (all economies; World Bank) (WDI SP.URB.TOTL.IN.ZS; series; latest annual; retrieved 2026-10-23)
- Individuals using the Internet (% of population) (all economies; World Bank) (WDI IT.NET.USER.ZS; series; latest annual; retrieved 2026-10-23)
- Research and development expenditure (% of GDP) (all economies; World Bank) (WDI GB.XPD.RSDV.GD.ZS; series; latest annual; retrieved 2026-10-23)
Documents cited
- UNCTAD: World Investment Report 2026, Chapter I: International investment trends (retrieved 2026-10-25)
- UNCTAD: World Investment Report 2026, Chapter III: International investment in a turbulent era: Trends and policy response (retrieved 2026-10-25)
- National Bureau of Statistics of China: National Economy was Generally Stable with New Achievement Made in High-Quality Development in the First Three Quarters (retrieved 2026-10-25)
- Statistics Canada: The Daily: Labour productivity, hourly compensation and unit labour cost, second quarter 2026 (retrieved 2026-10-25)
- World Bank: Global Economic Prospects, June 2026 (full report, CC BY 3.0 IGO) (retrieved 2026-11-07)
Each dataset is used under its licence; attribution and series-level detail are in each chart’s “About this data” panel. Limitations: Sector shares, urban shares and research spending come from different sources and years (see each period), and countries define 'urban' differently. A share of GDP says how much value an industry adds, not how many people it employs or how important it is to trade or security. Artificial intelligence, automation and industrial policy are not measured in these data: this section does not assess them.
Decisions and releases in the coming weeks
From the institutions’ own published schedules (see the release calendar for all of them, with filters). A scheduled date is not an outcome.
| Date | Release or decision | Source |
|---|---|---|
| 2026-11-16 · 08:30 ET | Consumer Price Index · October 2026 | Statistics Canada, Major economic releases |
| 2026-11-18 · 10:00 ET | Outdoor Recreation Economic Statistics, U.S. and States, 2025 | US Bureau of Economic Analysis |
| 2026-11-20 · 08:30 ET | Activities of U.S. Multinational Enterprises, 2024 | US Bureau of Economic Analysis |
| 2026-11-25 · 08:30 ET | GDP (Second Estimate) and Corporate Profits, 3rd Quarter 2026 | US Bureau of Economic Analysis |
| 2026-11-25 · 08:30 ET | Personal Income and Outlays, October 2026 | US Bureau of Economic Analysis |
| 2026-11-30 · 08:30 ET | Gross domestic product by industry · September 2026 | Statistics Canada, Major economic releases |
| 2026-11-30 · 08:30 ET | Gross domestic product, income and expenditure · Third quarter 2026 | Statistics Canada, Major economic releases |
| 2026-12-02 · 08:30 ET | GDP by County and Personal Income by County, 2025 | US Bureau of Economic Analysis |
| 2026-12-04 · 08:30 ET | Labour Force Survey · November 2026 | Statistics Canada, Major economic releases |
| 2026-12-08 · 08:30 ET | Canadian international merchandise trade · October 2026 | Statistics Canada, Major economic releases |
| 2026-12-08 · 08:30 ET | U.S. International Trade in Goods and Services, October 2026 | US Bureau of Economic Analysis |
| 2026-12-09 | Bank of Canada interest rate announcement | Bank of Canada |
| 2026-12-09 | FOMC interest rate decision and Summary of Economic Projections | Federal Reserve (FOMC) |
| 2026-12-10 · 08:30 ET | Real Personal Consumption Expenditures by State and Real Personal Income by State, 2025 | US Bureau of Economic Analysis |
| 2026-12-14 · 08:30 ET | Consumer Price Index · November 2026 | Statistics Canada, Major economic releases |
| 2026-12-17 | Bank of England Bank Rate decision (MPC) | Bank of England |
| 2026-12-17 | ECB monetary policy decision and press conference | European Central Bank |
| 2026-12-18 · 08:30 ET | U.S. International Transactions and Investment Position, 3rd Quarter 2026 | US Bureau of Economic Analysis |
Full release calendar. US Bureau of Labor Statistics and Eurostat release dates are not listed: the BLS schedule page refused automated access and Eurostat publishes no readable forward calendar.
Twelve economies in a paragraph each
Structure, recent performance, strengths and vulnerabilities, and the connection to Canada. Every number is a reference to a registered series or document.
| Economy | Profile |
|---|---|
| United States | The world’s largest economy at market exchange rates grew 2.2% in 2025 with the highest output per worker in the sample; its ten-year yield is 4.84% and inflation 3.7% |
| China | China grew 5.0% in 2025 with consumer prices flat (0.1%), investment at 40.5% of GDP in 2024 and a shrinking population |
| Euro area and European Union | The euro area grew 1.4% in 2025; inflation is now 4.0%, the ECB’s deposit rate 2.50% |
| Germany | Germany’s economy grew 0.2% in 2025 after contracting in 2023 and 2024; industrial production was 90.7 in August 2026 on a 2021 = 100 scale |
| France | France grew 0.8% in 2025 and had unemployment of 8.5% in September 2026; the government balance was -5.2% of GDP in 2024 |
| United Kingdom | UK inflation was 3.5% in September 2026 and unemployment 4.7% in July 2026; central government debt was 130.7% of GDP in 2024 |
| Japan | Japan grew 1.2% in 2025 with unemployment of 2.5%, an ageing population (30.0% aged 65 and over) and net energy imports of 87.3% of energy use |
| India | India grew 7.6% in 2025, ranked 1st of 13 in growth among the thirteen economies, with 1.46 billion people and GDP per person of $10,039 |
| South Korea | South Korea has the sample’s highest manufacturing share (27.4% of GDP), research spending (4.9%) and current account surplus (6.6%), and GDP per person has risen 110.9% since 2000 |
| Mexico | Mexico’s trade equals 79.9% of GDP, but growth was 0.6% in 2025 and output per worker is lower than in 2000 |
| Brazil | Brazil grew 2.3% in 2025 with inflation of 5.0%, and 77.4% of its electricity came from renewable sources in 2021 |
| Australia | Australia is a net energy exporter (net energy imports -211.2% of energy use) with the fastest population growth in the sample (1.5% in 2025) and inflation of 2.9% |
Each economy opens on its country page.
Further World Bank indicators
Indicators from the first edition that no section above discusses. They carry their sources and limits; they have no written analysis.
Growth by region
World Bank regional aggregates.
Chart loads when it comes into view.
Latest values: East Asia & Pacific 3.997 (2025); Europe & Central Asia 1.703 (2025); Latin America & Caribbean 2.322 (2025); Middle East, North Africa, Afghanistan & Pakistan 2.745 (2025); and 3 more in the data table.
GDP deflator inflation
Annual percent change in the economy-wide price index.
Chart loads when it comes into view.
Latest values: Canada 2.553 (2025); United States 2.801 (2025); China -0.922 (2025); Japan 3.422 (2025); and 10 more in the data table.
Related relationships: United States · China · United Kingdom · Japan
Real interest rates
Lending rate adjusted for inflation (GDP deflator). The World Bank series ends in 2017 for several major economies, so it is shown for completeness and is flagged as aging.
Chart loads when it comes into view.
Latest values: Canada 0.126 (2017); United States -1.256 (2021); China 5.153 (2024); Japan 0.972 (2017); and 7 more in the data table.
Related relationships: United States · China · United Kingdom · Japan
Broad money
Percent of GDP.
Chart loads when it comes into view.
Latest values: Canada 122.6 (2008); United States 99.72 (2025); China 227.7 (2024); Japan 246.8 (2025); and 7 more in the data table.
Related relationships: United States · China · United Kingdom · Japan
Coal prices
US dollars per tonne, monthly average.
Chart loads when it comes into view.
Latest values: Coal, Australian 152.3 (2026-10); Coal, South African 100 (2026-10).
Energy use per person
Kilograms of oil equivalent per capita.
Chart loads when it comes into view.
Latest values: Canada 7,119 (2024); United States 6,454 (2024); China 2,947 (2024); Japan 3,004 (2024); and 9 more in the data table.
Related relationships: United States · China · United Kingdom · Japan
Services share of the economy
Percent of GDP.
Chart loads when it comes into view.
Latest values: Canada 64.11 (2022); United States 76.26 (2021); China 57.7 (2025); Japan 71.43 (2024); and 9 more in the data table.
Related relationships: United States · China · United Kingdom · Japan
Population
Millions of people.
Chart loads when it comes into view.
Latest values: Canada 41.65 (2025); China 1,407 (2025); India 1,464 (2025); United States 341.8 (2025); and 9 more in the data table.
Related relationships: United States · China · United Kingdom · Japan
Net migration
Persons, five-year net estimate (UN). Positive = net inflow.
Chart loads when it comes into view.
Latest values: Canada 326.2 (2025); United States 1,231 (2025); Australia 137.1 (2025); United Kingdom 389.9 (2025); and 4 more in the data table.
Related relationships: United States · United Kingdom · Japan · Canada
Unemployment (modelled ILO estimates)
Percent of labour force. Not directly comparable with national survey rates.
Chart loads when it comes into view.
Latest values: Canada 6.907 (2025); United States 4.198 (2025); China 4.615 (2025); Japan 2.451 (2025); and 10 more in the data table.
Related relationships: United States · China · United Kingdom · Japan
Human capital: tertiary enrolment
Gross enrolment ratio, percent.
Chart loads when it comes into view.
Latest values: Canada 76.27 (2023); United States 79.36 (2022); China 76.88 (2024); Japan 64.49 (2023); and 9 more in the data table.
Related relationships: United States · China · United Kingdom · Japan
Government expense and tax revenue
Percent of GDP, Canada against peers: expense.
Chart loads when it comes into view.
Latest values: Canada 19.06 (2023); United States 24.43 (2023); Japan 20.06 (2022); India 13.73 (2022); and 8 more in the data table.
Related relationships: United States · China · United Kingdom · Japan
Real GDP growth, quarter on quarter
Percent change from the previous quarter, seasonally and calendar adjusted (Eurostat). Quarterly changes are volatile and revised.
Chart loads when it comes into view.
Latest values: Euro area 0.4 (2026 Q3); Germany 0.2 (2026 Q3); France -0.1 (2026 Q3); Italy 0 (2026 Q3); and 1 more in the data table.
Related relationships: Euro area
US Treasury yields across maturities
Percent, daily, constant-maturity (Federal Reserve H.15).
Chart loads when it comes into view.
Latest values: 3-month 4.17 (2026-11-05); 2-year 4.46 (2026-11-05); 10-year 4.84 (2026-11-05); 30-year 5.25 (2026-11-05).
Related relationships: US Treasury yields · 4 relationships use this data as evidence
United Kingdom: real GDP growth, quarter on quarter
Percent change from the previous quarter, seasonally adjusted (ONS).
Chart loads when it comes into view.
Latest values: United Kingdom 0.5 (2026 Q2).
Related relationships: United Kingdom
From the world into Canada and its cities
Documented trade exposures, mechanisms with sources, observed correlations and clearly labelled hypotheses, in one explorer.
Examples recorded in the relationship graph, each with its evidence class: the United States as destination for most of Canada’s merchandise exports (documented exposure); oil prices and Canadian energy investment (a Bank of Canada statement about 2014–15); the policy rate and household mortgage costs (Bank of Canada staff note); and several hypotheses that stay hypotheses until a source is read.
Open the relationship explorer → · Start from the oil price · Start from the United States
How to read this report
Every chart states its source, retrieval date, latest observation and freshness.
- Annual economy data: World Bank World Development Indicators (CC BY 4.0 for World Bank-produced data; indicators compiled from other organisations, for example the IMF, ILO and IEA, carry a visible condition). Monthly prices: World Bank Pink Sheet and Bank of Canada.
- Timely indicators: Eurostat (CC BY 4.0, Eurostat-produced statistics), the European Central Bank (free reuse with the source credited and data unmodified; its Data Portal terms on automated access were not located), the US Federal Reserve Board (public domain, cite the Board), the UK Office for National Statistics (Open Government Licence v3.0) and the US Bureau of Labor Statistics (public API; BLS cannot vouch for derived analyses). Terms read on 23 October 2026 through a retrieval tool; none has been confirmed by a lawyer.
- Not used because terms are unconfirmed or permission is required: IMF, OECD, Bank of England, Bank of Japan, BIS and the US Treasury site. Each is listed with its reason on the methodology page.
- The latest year differs by indicator and country: the map and tables state the year. "Aging" means the latest observation is older than expected for that frequency.
- Forecasts, scenarios and observations are never mixed. No forecast is published here; other institutions' forecasts are quoted only as theirs, with the source read.