Forecasting products, tested before they are offered
Most economic forecasts cannot be shown to beat a simple benchmark. We tested 80 combinations of Canadian indicators and horizons against a fair benchmark on data the model had not seen: 1 was reliably better. So Northline does not sell forecasts it cannot support. It offers planning ranges with a measured hit rate, and rate scenarios you can check by hand, and connects them to your own costs and borrowing.
These ranges describe how past data have behaved and have not been independently reviewed; they are not forecasts. Free to explore; a free account is needed to run scenarios.
Input-cost planning ranges
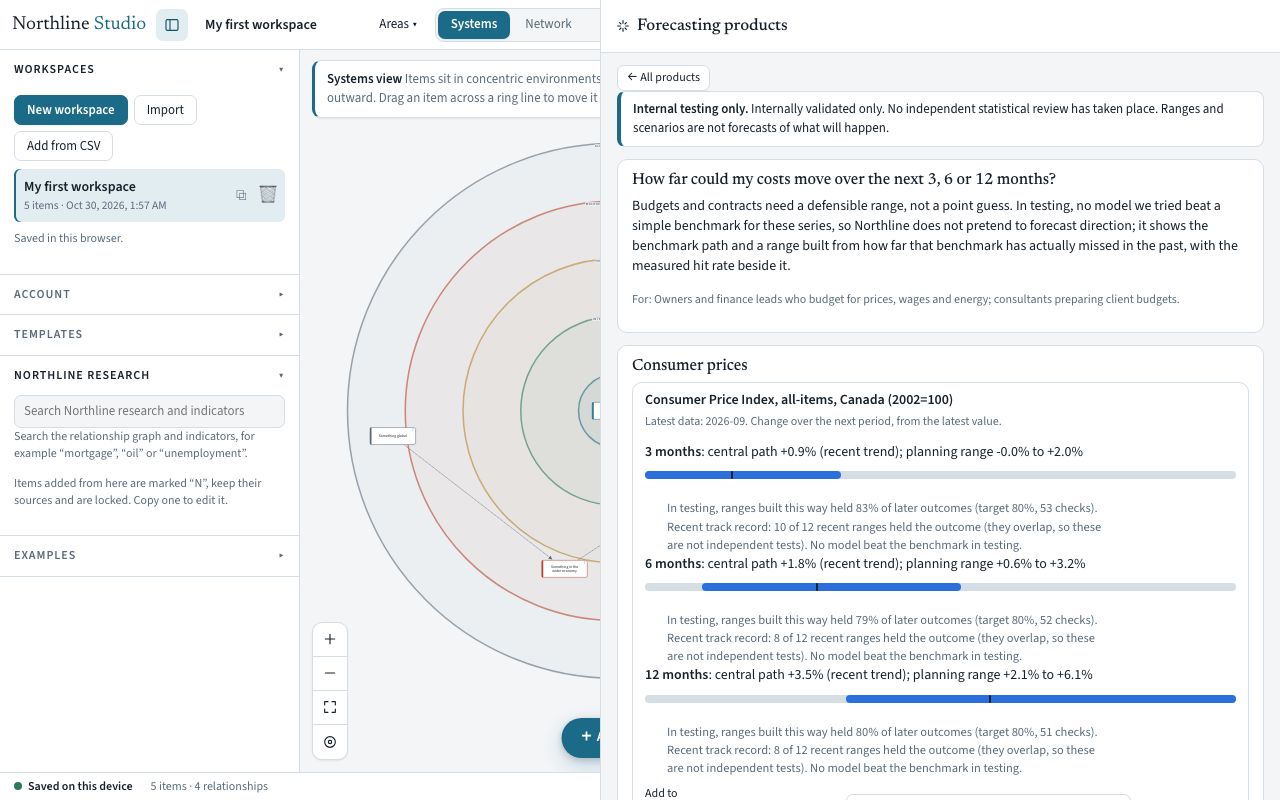
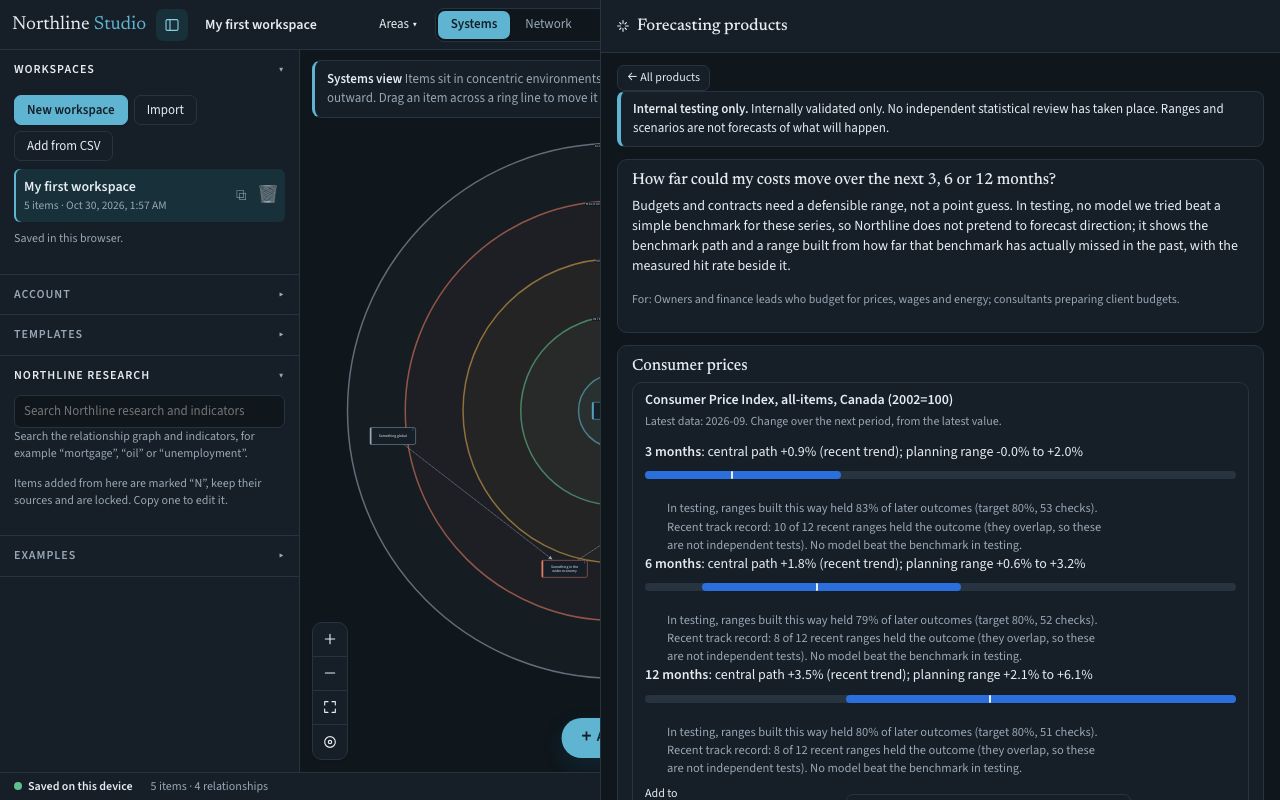
How far could my costs move over the next 3, 6 or 12 months?
Budgets and contracts need a defensible range, not a point guess. In testing, no model we tried beat a simple benchmark for these series, so Northline does not pretend to forecast direction; it shows the benchmark path and a range built from how far that benchmark has actually missed in the past, with the measured hit rate beside it.
| Indicator | Central path | Planning range | Held in testing | Recent track record |
|---|---|---|---|---|
| Consumer Price Index, all-items, Canada (2002=100) | +3.5% | +2.1% to +6.1% | 80% | 8 of 12 |
| Consumer Price Index, Canada: Food (2002=100) | +4.9% | +2.2% to +9.8% | 80% | 11 of 12 |
| Consumer Price Index, Canada: Transportation (2002=100) | +4.0% | -3.9% to +11% | 88% | 12 of 12 |
| Average hourly wage rate, Canada: Total employees, all industries | +4.2% | +2.3% to +6.9% | 86% | 9 of 12 |
| Consumer Price Index, Canada: Energy (2002=100) | 0.0% | -12% to +17% | 84% | 9 of 12 |
"Held in testing" is the share of later outcomes inside 80% ranges built the same way, out of sample (target 80%; across all series tested it ranged from 55% to 100%). The track record counts overlapping recent ranges, so it is not twelve independent tests. The ends of a range are not limits on what can happen.
- This is not a forecast of direction. The central path is the stronger of "no change" and "recent trend".
- A range is built from past errors; a new kind of shock can exceed it. Its ends are not limits on what can happen.
- In testing, 80% ranges covered between about 68% and 91% of later outcomes depending on the series; the figure for each series is shown.
- National figures; your own costs may follow them differently. That response is your assumption.
Borrowing-cost sensitivity
If the Bank of Canada moves its rate, what happens to my interest bill?
The prime rate that prices most floating-rate business credit follows the Bank of Canada target rate closely and almost immediately in the data. Where a relationship is that direct, honest value is a clear, checkable calculation of what a rate change would mean for the interest bill, not a forecast of what the Bank will do (in testing, no model beat "no change" for rates).
Observed 2010-01 to 2026-10: the prime rate stayed 1.96 to 2.37 points above the Bank of Canada target, and moved 0.97 points per point of policy change over 67 non-overlapping three-month windows (standard error 0.01). Enter your floating-rate borrowing and the share that reprices, and Studio shows the arithmetic.
- This is a conditional scenario, not a prediction that rates will move.
- Pass-through is the observed history of the prime rate; lenders' margins and your own contract terms are yours to enter.
- Mortgage rates follow bond yields as well as the policy rate; they are not quantified here.
House-price planning ranges (research preview)
How far could new-house prices move over the next 1 to 12 months?
The new housing price index is smooth and persistent, so a simple momentum model beat its benchmark out of sample at one month in testing. That is the only forecasting claim in this study that survived correction for testing many series. It is shown as a research preview with the benchmark path and range, not as a released forecast.
Open in Studio →What we tested and do not offer as forecasts
You should know where the data run out.
- Unemployment and employment forecasts. No model beat the benchmark at any tested horizon (error ratio 0.86 to 3.23, none significant).
- Oil, natural gas and exchange-rate price forecasts. No model beat the benchmark. Range and sensitivity tools are offered instead; USD/CAD has too little published history (about 115 months) to test.
- CPI, wage and earnings direction forecasts. After comparing with a trend benchmark, no model was reliably better. Planning ranges are offered instead.
- Housing starts, mortgage balances, manufacturing sales, Alberta unemployment. No reliable skill beyond the benchmark (starts: one month only, before correction). Not offered as forecasts.
- Interest-rate forecasts (policy, prime, mortgage rates). No model beat "no change" and the error ranges covered only 55% to 79% of outcomes. Conditional sensitivity is offered instead.
Carry the range into your own numbers
Economic change, scenario, your exposure, financial implications, decisions.
One click turns a range or a rate scenario into scenarios in your business analysis. You state how strongly your costs, sales and borrowing respond; Northline never supplies that. Results show what each number rests on, and the ranges are labelled as ranges, not forecasts.
Start a business analysis → · Try the illustrative example →