Latest values, rankings and charts for New Brunswick, all computed from Statistics Canada data held by this platform. The economic story below explains with attributed statements from official sources; the profile only computes. Forecasts quoted are their publishers' and Northline publishes none.
Data profile with a sourced economic storyEvery statement in the data profile below is computed from a published series and links to its source in the chart footers. Rankings compare places on the same definition and period; they describe differences and do not explain them. The three territories have their own profiles.
The economy
What drove New Brunswick's recent growth, and what are the pressures on forestry, population and public finances?
New Brunswick's government says the economy grew in 2025 mainly because its population and housing construction grew, and expects growth to slow as population gains weaken, forestry faces a heavy US duty and its deficit widens
What happened
New Brunswick's unemployment rate was 7.4% in October 2026, employment changed by 1.1% from a year earlier and the population by 1.0% from four quarters earlier. Real GDP changed 11.2% from 2019 to 2025, and 15.1% from 2020, when the pandemic depressed output.
Why it happened
Historical context
The provincial Department of Finance and Treasury Board says growth in 2025 was primarily driven by population growth, elevated housing starts and higher employment, with real GDP up 1.3 per cent, partly offset by declines in manufacturing sales and exports that may reflect uncertainty over trade disruptions. Statistics Canada's revised market-price series at 2017 constant prices, released on 5 November 2026, shows 2.2% for 2025. It reports 7,587 housing starts, the highest ever in data going back to 1955, and a rental universe that expanded 14.4 per cent between 2023 and 2025, easing the vacancy rate from 1.5 per cent to 2.9 per cent.
In its preliminary estimates of 1 May 2026, Statistics Canada reported that construction rose 9.2 per cent in New Brunswick in 2025 after two years of decline, on higher residential construction and a rebound in non-residential and engineering construction, while manufacturing output fell 2.8 per cent. Its revised estimates of 5 November 2026 put the 2025 changes at 7.9% for construction and -2.6% for manufacturing.
The province expects real GDP to increase 1.0 per cent in 2026 as weaker population gains and moderating residential construction limit growth, projects population growth of 0.3 per cent against 1.3 per cent in the year to July 2025, and attributes the slowdown to high outflows and limited inflows of non-permanent residents under current federal immigration policy. Statistics Canada has since estimated growth of 1.0% in the year to July 2026.
The province's 2024 economy review notes that the average age was 44.2 years and that the share of residents aged 60 and over rose from 18.8 per cent to 30.5 per cent between 2004 and 2024, and says record immigration and interprovincial migration helped stabilize the pace of ageing.
The province reports that total capital investment grew to $5.6 billion in 2024, the highest recorded since 2006, and that average weekly earnings rose 3.7 per cent in 2024, below the national 4.6 per cent. These are 2024 figures from the 2024 edition of the review.
Statistics Canada reports that the Moncton area was among the three fastest-growing areas in the country in the year to July 2025, while net interprovincial migration to Moncton and Fredericton was negative and the Atlantic urban centres' gains had moderated.
The Atlantic Canada Opportunities Agency says year-to-date exports in the Atlantic region fell 1.9 per cent over January to September 2025, with most of the decline due to a 10.7 per cent drop in exports to the United States.
The Canada Infrastructure Bank describes Irving Pulp & Paper's Project NextGen, a 1.5-billion-dollar upgrade of its Saint John pulp mill, as the largest investment in the Canadian forest products industry in many years, expected to move the mill from the bottom quartile of global kraft pulp producers to the top.
The province's economic development strategy sets a goal of growing the economy by 10 per cent by 2030 through productivity, private investment and diversified exports.
The province's 2023 clean energy plan targets adding 600 megawatts of small modular reactors at Point Lepreau by 2035; this is a provincial target, not a construction approval.
The province says its forestry sector faces heightened pressure from the US-imposed 45.16 per cent duty on softwood lumber and said the scheduled renegotiation of the Canada-United States-Mexico Agreement was likely to add uncertainty. At the joint review on 1 July 2026 the United States did not agree to renew the agreement, which stays in force with annual reviews.
It estimates that export value affected by the newly imposed Section 338 tariffs and bans is roughly 115.1 million dollars, about 0.7 per cent of 2025 exports, and its first-quarter update says those tariffs alone could affect about 500 jobs.
The first-quarter update projects a deficit of 1.66 billion dollars, up from the 1.39 billion budgeted, mostly because of higher social-development costs and smaller-than-expected health savings.
The province's economic outlook projects real GDP growth of 1.0 per cent in 2026 and slower employment growth of 0.6 per cent. These are the province's forecasts, not Northline's. The province's market-diversification strategy promised for the fall, Statistics Canada's population estimates and the province's next fiscal update (release calendar) show how the slowdown develops.
Fiscal position, investment and comparisons
How is New Brunswick's budget funded, what is behind its capital plan and major projects, how exposed is its trade, and how does it differ from Canada and from Nova Scotia and Newfoundland and Labrador?
New Brunswick's deficit is financed on a revenue base in which federal transfers are a large share and equalization is the biggest single item, its public capital plan is the largest in its history while private projects it counts on are still pending, and nine-tenths of its goods exports in 2025 went to one market
What happened
New Brunswick's unemployment rate was 7.4% in October 2026, against 6.7% for Canada and 6.2% in Nova Scotia. Average weekly earnings were C$1,266 a week in August 2026, against C$1,355 a week for Canada, and the population changed by 1.0% from four quarters earlier.
In the latest fiscal year in the Statistics Canada accounts, which began in April 2024, grants from other governments were 37.1% of the provincial government's revenue and its net operating balance was 4.1% of revenue. That is a Statistics Canada accounting measure for a past year; it is not comparable with the deficits in the current budget, which use the province's own basis.
Historical context
On the province's own audited basis, 2024-25 ended with a deficit of $104.4 million and 2025-26 with a deficit of $1.3 billion; net debt was $13.9 billion at 31 March 2026.
Fiscal position: deficit, net debt and where revenue comes from
Historical context
The Finance and Treasury Board's budget speech says revenues are projected at $14.24 billion against expenses of $15.63 billion, and describes its approach as rolling out initiatives to curb spending growth over time rather than making harsh cuts immediately in pursuit of a balanced budget. Its own multi-year plan shows net debt rising from 30.8 per cent of GDP in 2026-27 to 36.0 per cent in 2028-29, and the speech says the ratio remains one of the best in the country.
The first-quarter update projects a deficit of $1.66 billion, against $1.39 billion budgeted, because spending is higher and revenue lower than budgeted.
The update document itself projects net debt at $16.2 billion, and attributes the overspending to social development ($123.2 million over budget, on higher demand and delivery costs for income security, child welfare, disability support and long-term care) and health ($108.1 million over).
On the revenue side the budget's estimates for 2026-27 (in thousands of dollars) are fiscal equalization payments of 3,360,010, the Canada Health Transfer 1,203,400 and the Canada Social Transfer 376,000, within total grants from Canada of 5,605,697, against own-source revenue of 8,044,291. Personal income tax is 2,588,000 and the harmonized sales tax 2,287,700. Resource royalties are small by comparison: 47,609, against an original 2025-26 estimate of 79,946.
The update says royalties are down $6.9 million because volatile and uncertain market conditions for most forest products are now expected to persist for the duration of the fiscal year.
Finance Canada says Equalization supports provinces with lower than average fiscal capacity, that fiscal capacity is assessed across personal income taxes, business taxes, consumption taxes, property taxes and natural resource revenues, and that provincial spending decisions and overall fiscal results do not affect the payment.
Reading that description, the size of the deficit does not move the transfer; the province's revenue capacity relative to the national average does. The page does not say how much of New Brunswick's payment comes from each revenue category.
Labour, wages, productivity, housing and migration
The job vacancy rate was 2.4% in August 2026 and housing starts ran at a seasonally adjusted annual rate of 12,930 in September 2026, a volatile monthly figure; over the latest twelve months starts rose6.2% against the twelve months before.
Historical context
The province's outlook says the economy added 5,200 jobs in 2025, that the unemployment rate edged up to 7.1%, and that employment growth and higher average weekly earnings contributed to a 5.7% increase in wages and salaries.
It reports 7,587 housing starts in 2025, a record, and says the rental universe expanded 14.4% between 2023 and 2025, easing the vacancy rate from 1.5% to 2.9%.
Statistics Canada's report on the 2025 new housing market says all census metropolitan areas in the Atlantic region reported yearly increases except Moncton, which reported an 8% decline.
The province's economic development strategy lists closing the productivity gap among its aims. The strategy page gives no productivity figure or peer comparison.
The outlook adds that investments in automation could contribute to improved productivity for the processing side of fisheries and aquaculture, where quotas for snow crab and shrimp are expected to drop.
Domestic merchandise exports were C$16.0 billion in calendar year 2025; 90% went to the United States and energy products were 38% of the total. These are customs-basis goods exports and exclude services.
Historical context
The Canada Energy Regulator says the Irving Oil refinery in Saint John is the province's only refinery and the largest in Canada, with a capacity of 320 thousand barrels per day, that most of its crude comes from non-Canadian sources, and that over half of its refined products are exported by marine vessel to the northeast United States. That is a source-stated mechanism for the energy share of exports shown above; the profile does not give the refinery's export value.
The province's outlook says merchandise exports fell 8.2 per cent in 2025, driven by lower volumes of oil exports and lower oil prices, and that the forestry sector faces a 45.16 per cent US duty on softwood lumber.
Real output at basic prices in New Brunswick (chained 2017 dollars, Statistics Canada table 36-10-0711-01) was C$37.1 billion in 2025, a change of 18.0% over ten years. Over the same ten years goods-producing industries changed 19.0% and services-producing industries 17.7%; mining, quarrying and oil and gas changed -31.1%, manufacturing 7.5% and the public sector 24.1%. These are changes in real output, not in income or jobs, and the table gives no reason for the differences; the sourced paragraphs in this section and in the story give the explanations that named sources offer.
Real output by industry in New Brunswick, indexed
Real GDP at basic prices, chained 2017 dollars, annual (Statistics Canada table 36-10-0711-01); first year shown = 100. Goods and services against the total, with mining and oil and gas, manufacturing and the public sector. Chained-dollar levels are not additive, so only changes are compared.
Chart loads when it comes into view.
Latest values: All industries 37,060,000,000 (2025); Goods-producing industries 8,951,000,000 (2025); Services-producing industries 28,110,000,000 (2025); Mining, quarrying and oil and gas 254,300,000 (2025); and 2 more in the data table.
Labour productivity, meaning real value added per hour worked in chained 2017 dollars (Statistics Canada table 36-10-0713-01), was C$51.90 an hour in New Brunswick in 2025, ranking 9th of 10 (highest = 1), a change of 3.0% over ten years. In goods-producing industries it was C$48.50 an hour (a change of -3.4% over ten years) and in services-producing industries C$53.10 an hour (a change of 5.1%). A high level can reflect capital-intensive industries such as oil, gas and mining rather than the efficiency of the whole economy, and the table says nothing about why levels or changes differ.
Labour productivity in New Brunswick: goods and services
Real value added per hour worked, chained 2017 dollars, annual (Statistics Canada table 36-10-0713-01). Goods-producing industries include mining and oil and gas, so their level reflects capital-intensive resource extraction as well as manufacturing and construction.
Population is 25.4% higher on 1 July 2026 than on 1 January 1981, against 69.5% for Canada, and employment is 34.4% higher than in June 1993, against 65.1% for Canada.
Across geographies
Against Canada and two peers
In October 2026 New Brunswick's unemployment rate ranked joint 2nd of 10 among the ten provinces (1st = highest); Nova Scotia's was 6.2% and Newfoundland and Labrador's 8.7%. Average weekly earnings in August 2026 ranked 7th of 10: C$1,266 a week in New Brunswick, C$1,223 a week in Nova Scotia, C$1,314 a week in Newfoundland and Labrador and C$1,355 a week across Canada. Population growth over four quarters was 1.0% in New Brunswick, 0.8% in Nova Scotia and 0.4% in Newfoundland and Labrador.
On Statistics Canada's basis, grants from other governments were 37.1% of revenue in New Brunswick, 34.6% in Nova Scotia and 25.5% in Newfoundland and Labrador in the fiscal year that began in April 2024; net operating balances on that basis were 4.1%, 3.0% and -3.3% of revenue.
Historical context
On their own audited accounts for fiscal 2024-25, New Brunswick reported a deficit of $104.4 million and Newfoundland and Labrador a deficit of $296.6 million.
Finance Canada's 2026-27 chart gives New Brunswick an Equalization payment of 4,004, against 3,336 for Nova Scotia and 336 for Newfoundland and Labrador, and a natural resource fiscal capacity of 107 for New Brunswick, 15 for Nova Scotia and 2,964 for Newfoundland and Labrador. New Brunswick's non-resource fiscal capacity is 7,997, against 12,086 for Ontario.
In the chart's text version, New Brunswick's payment is second only to Prince Edward Island's of the ten provinces in the chart, and Newfoundland and Labrador's is far smaller where its natural resource fiscal capacity is far larger. The figures show that pattern; they do not by themselves establish why New Brunswick's fiscal capacity is low, and no source cited here explains it.
Historical context
Statistics Canada says New Brunswick (+1.0%) and Nova Scotia (+0.8%) grew faster than the country as a whole (+0.5%) in the year to July 1, 2026.
Newfoundland and Labrador's government expects oil royalties to represent 19 per cent of its overall 2026-27 revenues, a dependence that New Brunswick's royalty line does not have.
The Capital Estimates speech says the plan is the largest investment in capital in the province's history, $1.47 billion for 2026-27, that capital investment can act as an economic stabilizer in a slowdown, and that transportation and infrastructure accounts for almost half of it ($680 million). It adds $205 million for hospitals, more than $242 million for schools (it says population growth has pressured the province's 295 schools) and $78.1 million for housing.
The outlook counts on private projects as well: it says investment growth in 2026 is driven by several major capital projects including the Saint John pulp mill upgrade and construction of the Brighton Mountain Wind Farm, with additional federal defence-related capital outlays expected, and that the Sisson mine project may lead to further growth over the medium to long term.
The Canada Infrastructure Bank describes the Saint John pulp mill upgrade as a $1.5-billion project. The province's outlook says the upgrade is expected to boost productivity in the forestry sector in the medium term, while the same sector faces the US duty.
No source cited here says whether the upgrade's economics depend on the duty or the softwood lumber market; the pulp mill and sawmill lumber are different products, and that link is not asserted.
Historical context
The budget speech says the Sisson mine is among the largest tungsten deposits of its type in the world and was recognized as a top nation-building project, and that the Port of Belledune and Port Saint John are positioned to move resources to global markets. It budgets $9.9 million in 2026-27 to prepare for additional nuclear development at Point Lepreau, a preparation allocation, not a construction approval.
The Canada Energy Regulator says NB Power proposes a rehabilitation of the Mactaquac hydro station (672 MW) lasting up to 15 years, and that about 40 per cent of 2021 generation was nuclear.
The Major Projects Office describes the Wasoqonatl intertie, a transmission line between Nova Scotia and New Brunswick, as expected to support about 587 direct and indirect jobs, with the Canada Infrastructure Bank's investment totalling $285 million.
The province estimates that export value affected by the newly imposed Section 338 tariffs and bans is roughly $115.1 million, about 0.7 per cent of 2025 exports, so that measure alone touches a small share. The outlook names the softwood duty and the Canada-United States-Mexico Agreement renegotiation as further pressures (at the joint review on 1 July 2026 the agreement was not renewed; it stays in force with annual reviews); no source cited here gives the value of lumber exports, so their size relative to this figure is not stated.
The federal and provincial governments are investing $13.8 million over three years to support workers in softwood lumber, mining, construction and transportation.
The outlook expects employment growth to slow to 0.6 per cent in 2026 because labour force growth will be limited by slow population gains, and attributes the slowdown in population to high outflows and limited inflows of non-permanent residents under current federal immigration policy. Net interprovincial migration over the latest four quarters was -17 persons and non-permanent residents changed by 1,521.
The market-diversification strategy the province promised for the fall, the next provincial fiscal update, the annual joint reviews of the Canada-United States-Mexico Agreement, the Equalization renewal (due before March 31, 2029 according to Finance Canada) and any decision on Point Lepreau are the dated items in the sources. These are the publishers' plans, not Northline forecasts.
Written profile
What do the data show about the New Brunswick economy?
New Brunswick's unemployment rate was 7.4% in October 2026, its prices were up 5.0% in the year to September 2026 and its government's net operating balance, on Statistics Canada's basis, was 4.1% of revenue in the fiscal year that began in April 2024
New Brunswick against the other nine
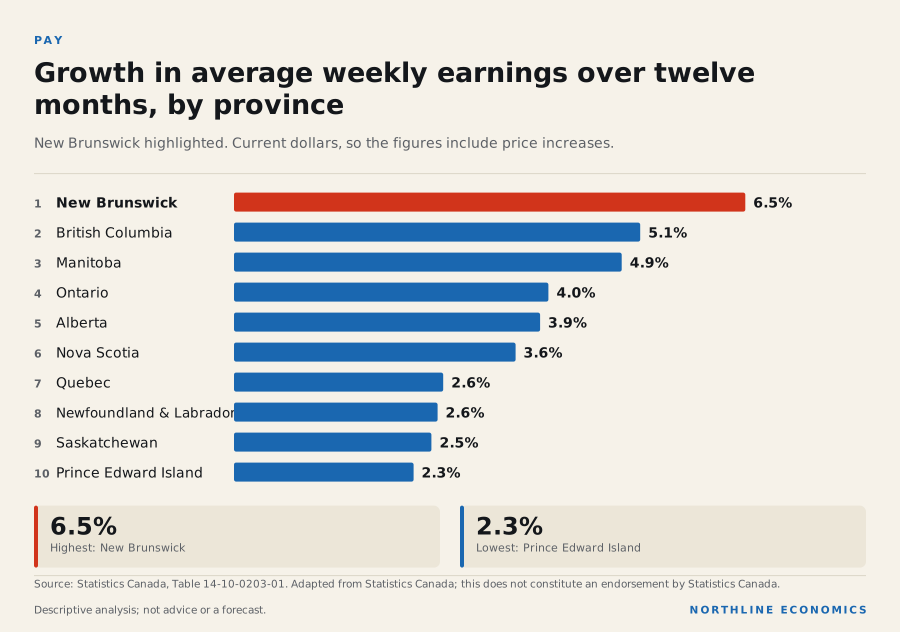
New Brunswick has the fastest earnings growth of the ten provinces and one of the highest unemployment rates. Average weekly earnings rose 6.5% in the twelve months to August 2026, ahead of consumer price growth of 5.0% in the twelve months to September 2026, the third highest of the ten provinces. The unemployment rate is 7.4%, down from 7.7% a year earlier, and the participation rate of 60.3% is the ninth highest. Employment grew 1.1%.
The data behind this graphic
Growth in average weekly earnings over twelve months, by province
The population grew 1.0% over four quarters, behind only Alberta and level with Saskatchewan at one decimal, and New Brunswick is the one province where non-permanent residents increased, by 1,521, while net movement to and from other provinces was -17. Housing starts are 8.6 per thousand residents, third of ten and above the five-year rate of 6.7.
The most export-dependent province on one customer
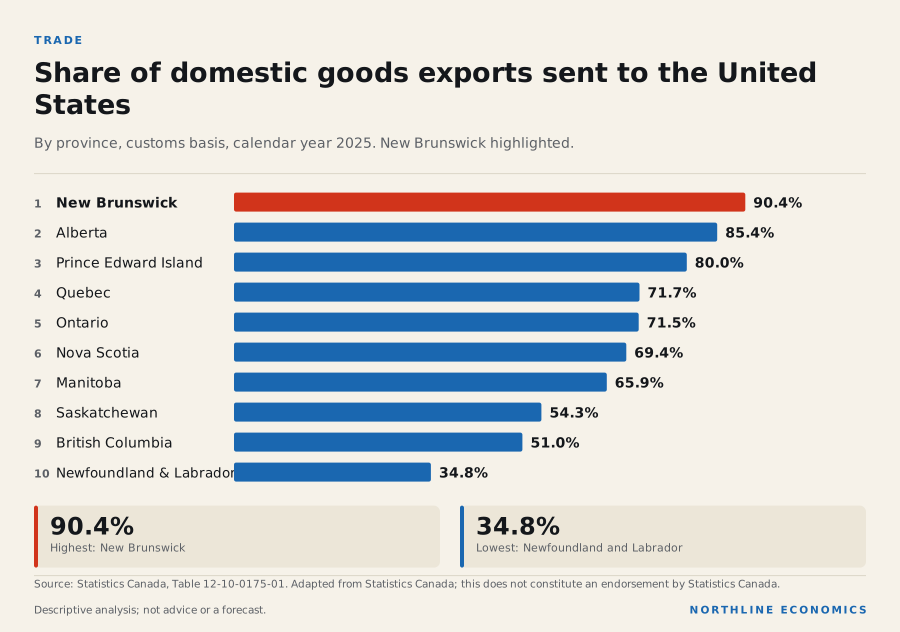
Domestic goods exports were C$16.0 billion in 2025, and 90.4% went to the United States, the highest share of any province. Energy products were 38.1% of the total, the third-highest share after Alberta and Newfoundland and Labrador, though mining and oil and gas extraction employs only 0.7% of workers; the export measure counts energy products, including refined and processed goods, not only extraction. A province whose goods trade is this concentrated is unusually exposed to United States trade policy.
The data behind this graphic
Share of domestic goods exports sent to the United States
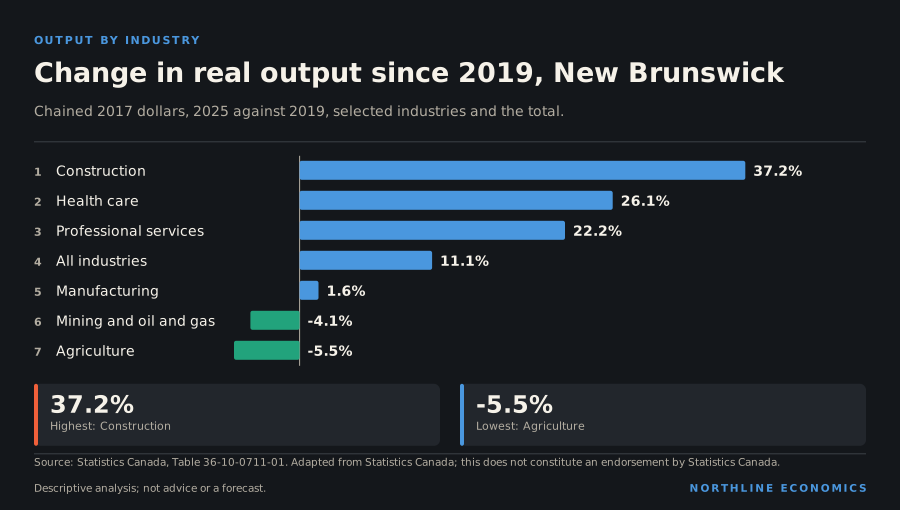
Real output across all industries is 11.1% higher than in 2019, sixth of ten, and real GDP at market prices grew 11.2% from 2019 to 2025 (15.1% from 2020, when the pandemic depressed output). Construction grew 37.2%, second of ten, professional services 22.2% and health care 26.1%, third of ten. Manufacturing changed by 1.6%, agriculture by -5.5% and mining and oil and gas extraction by -4.1%. Public administration is 9.5% of employment, the second-highest share after Prince Edward Island.
In the fiscal year that began in April 2024 the government had a net operating balance of C$561 million on revenues of C$13.6 billion, a surplus of 4.1% of revenue, the second-largest relative surplus among the provinces after Alberta. Liabilities were 2.14 times revenue, fifth highest. Statistics Canada's basis differs from the province's own accounts, and one year does not describe a trend.
Historical context
The province's own audited consolidated financial statements for the fiscal year ending March 31, 2025 show a deficit of $104.4 million, and its public accounts for the year ending March 31, 2026 a deficit of $1.3 billion.
For a business, New Brunswick is a small market in which wages are rising quickly and the population, including temporary residents, is growing. The risk is on the trade side: nine-tenths of goods exports go to one country. For a household, pay is rising faster than prices, which is not true of every province, though jobs are harder to find than in most.
What the data cannot say: they do not separate Moncton, Saint John and Fredericton from rural areas, they do not explain the wage growth, and the labour survey is a sample. Nothing here is a forecast.
Labour market and prices
The unemployment rate was 7.4% in October 2026, against 6.7% for Canada. Employment changed by 1.1% over the year and the participation rate was 60.3%. Average weekly earnings were C$1,266 a week in August 2026, ranking 7th of 10 among the ten provinces (1st = highest). Consumer prices were up 5.0% in September 2026 on a year earlier, ranking 3rd of 10.
Unemployment rate by province
Percent, seasonally adjusted, monthly. Province series, Labour Force Survey.
Chart loads when it comes into view.
Latest values: New Brunswick 7.4 (2026-10); British Columbia 6.3 (2026-10); Alberta 7.3 (2026-10); Saskatchewan 5.9 (2026-10); and 6 more in the data table.
The population was 1.0% higher than four quarters earlier. Net interprovincial migration over the latest four quarters was -17 persons (negative = net outflow), and non-permanent residents changed by 1,521. Real GDP changed 15.1% from 2020, when the pandemic depressed output, to 2025, and 11.2% from 2019. Retail sales were 3.8% higher than a year earlier.
Population by province, indexed
Quarterly estimates; start of period = 100.
Chart loads when it comes into view.
Latest values: New Brunswick 883,500 (2026 Q3); British Columbia 5,711,000 (2026 Q3); Alberta 5,101,000 (2026 Q3); Saskatchewan 1,278,000 (2026 Q3); and 6 more in the data table.
Annual, 2017 constant prices (not chained); start of the period = 100. Expenditure-based.
Chart loads when it comes into view.
Latest values: New Brunswick 40,870,000,000 (2025); British Columbia 356,100,000,000 (2025); Alberta 382,600,000,000 (2025); Saskatchewan 90,590,000,000 (2025); and 6 more in the data table.
Economic structure and trade exposure
In 2025 (the year of the table's latest annual average), health care and social assistance employed 16.8% of New Brunswick's workers, retail trade 11.5%, construction 7.9% and public administration 9.5%. Among goods-producing groups, agriculture 1.5%; forestry, fishing, mining, quarrying, oil and gas 1.9%; and manufacturing 8.2%. Finance and insurance employed 3.7% and professional, scientific and technical services 5.7%.
How much of each province’s employment is in one industry
Share of provincial employment, 2025 annual average (Labour Force Survey). A measured exposure to an industry, not an estimate of how much output or income depends on it. “Resources” combines forestry, fishing, mining, quarrying and oil and gas.
Chart loads when it comes into view.
Top values: Newfoundland and Labrador 6.37%; Alberta 5.58%; Saskatchewan 3.76%.
Domestic merchandise exports were C$16.0 billion in calendar year 2025. 90% went to the United States and energy products were 38% of the total; energy products sent to the United States were 35% of all the province's domestic exports. These are customs-basis goods exports assigned to the province of origin as Statistics Canada defines it; they exclude services, which are a large part of some provincial economies, and the province of export clearance can differ from the province of production for some commodities.
Where each province’s goods exports go, and what they are, 2025
Share of each province’s domestic merchandise exports (customs basis). A measured exposure of export value to one market or one commodity group, not an estimate of how much income or employment depends on it.
Chart loads when it comes into view.
Top values: New Brunswick 90.4%; Alberta 85.43%; Prince Edward Island 80.05%.
Employment shares and export shares describe the structure of the economy; they do not by themselves show which industries drive growth, incomes or public revenue, or how exposed the province is to a given shock.
Long-run perspective
Population is 25.4% higher on 1 July 2026 than on 1 January 1981, against 69.5% for Canada as a whole. Real GDP (at 2017 constant prices) is 121.5% higher in 2025 than in 1981; this is a level comparison between two years, not an average annual rate, and it is not compared with a national figure here because the national real GDP series is monthly and on a different basis.
Employment is 34.4% higher in October 2026 than in June 1993, the start of the national series used here (65.1% for Canada). Over the past forty years the unemployment rate has ranged from 5.9% (March 2023) to 14.4% (April 2020); it was 7.4% in October 2026, against 6.7% for Canada.
Employment by province, indexed
Seasonally adjusted; start of period = 100.
Chart loads when it comes into view.
Latest values: New Brunswick 409,100 (2026-10); British Columbia 2,941,000 (2026-10); Alberta 2,660,000 (2026-10); Saskatchewan 624,600 (2026-10); and 6 more in the data table.
Average weekly earnings, in current dollars and not seasonally adjusted, are 110.1% higher in August 2026 than in the same month twenty-five years earlier (106.8% for Canada). These are nominal figures: they include the effect of price increases over twenty-five years and are not a measure of the change in purchasing power.
These comparisons describe the size of changes between two dates. They do not say why this jurisdiction differs from Canada, and the end points can matter: a different starting year changes the percentage.
Public finances
For the fiscal year that began in April 2024, the provincial government's revenue was C$13.6 billion and its expense C$13.1 billion, leaving a net operating balance of C$561 million (4.1% of revenue). Grants received from other governments (mostly federal transfers; the table does not split them by payer) were C$5.1 billion, 37.1% of revenue. Liabilities at the end of the year were C$29.1 billion and net worth C$4.9 billion. These are past-year accounts, not the current budget.
What is not assessed
Why these figures differ from other provinces, industry structure beyond the latest employment shares, housing prices and rents, exports by destination over time, the current budget and credit ratings, major projects, and policy changes. This profile cites no source that explains New Brunswick's position, and nothing here is a forecast.
1 · Where it ranks
New Brunswick among the ten provinces
Same values as the Canada atlas layers. Rank 1 is the highest value, which is not always the most favourable outcome. A measure the source does not publish for a place is simply absent.
New Brunswick is emphasised; the other provinces are shown for context. Click legend items to hide lines.
Unemployment rate by province
Percent, seasonally adjusted, monthly. Province series, Labour Force Survey.
Chart loads when it comes into view.
Latest values: New Brunswick 7.4 (2026-10); British Columbia 6.3 (2026-10); Alberta 7.3 (2026-10); Saskatchewan 5.9 (2026-10); and 6 more in the data table.
Latest values: New Brunswick 409,100 (2026-10); British Columbia 2,941,000 (2026-10); Alberta 2,660,000 (2026-10); Saskatchewan 624,600 (2026-10); and 6 more in the data table.
Current dollars per hour, all industries, employees aged 15 and over, not seasonally adjusted.
Chart loads when it comes into view.
Latest values: New Brunswick 33.44 (2026-10); British Columbia 39.54 (2026-10); Alberta 39 (2026-10); Saskatchewan 34.21 (2026-10); and 6 more in the data table.
Average weekly earnings by province
Current dollars per week, industrial aggregate incl. overtime, not seasonally adjusted.
Chart loads when it comes into view.
Latest values: New Brunswick 1,266 (2026-08); British Columbia 1,366 (2026-08); Alberta 1,410 (2026-08); Saskatchewan 1,303 (2026-08); and 6 more in the data table.
3 · Prices
Inflation
12-month change in the all-items CPI, derived by this project from the index.
Consumer price inflation by province
12-month change in the all-items CPI (derived by this project from the index).
Chart loads when it comes into view.
Latest values: New Brunswick 4.99 (2026-09); British Columbia 2.96 (2026-09); Alberta 3.6 (2026-09); Saskatchewan 3.3 (2026-09); and 6 more in the data table.
Quarterly population estimates and four-quarter migration flows.
Population by province, indexed
Quarterly estimates; start of period = 100.
Chart loads when it comes into view.
Latest values: New Brunswick 883,500 (2026 Q3); British Columbia 5,711,000 (2026 Q3); Alberta 5,101,000 (2026 Q3); Saskatchewan 1,278,000 (2026 Q3); and 6 more in the data table.
New permanent residents arriving over the previous four quarters.
Chart loads when it comes into view.
Latest values: New Brunswick 10,210 (2026 Q2); British Columbia 45,800 (2026 Q2); Alberta 50,160 (2026 Q2); Saskatchewan 14,390 (2026 Q2); and 6 more in the data table.
Net interprovincial migration (4-quarter total)
In-migrants minus out-migrants over the previous four quarters (derived).
Chart loads when it comes into view.
Latest values: New Brunswick 13,400 (2026 Q2); British Columbia 58,490 (2026 Q2); Alberta 78,320 (2026 Q2); Saskatchewan 18,270 (2026 Q2); and 6 more in the data table.
Annual real GDP and monthly activity indicators, indexed so the start of the period equals 100 where noted.
Real GDP by province, indexed
Annual, 2017 constant prices (not chained); start of the period = 100. Expenditure-based.
Chart loads when it comes into view.
Latest values: New Brunswick 40,870,000,000 (2025); British Columbia 356,100,000,000 (2025); Alberta 382,600,000,000 (2025); Saskatchewan 90,590,000,000 (2025); and 6 more in the data table.
Retail sales by province, indexed
Seasonally adjusted; start of period = 100.
Chart loads when it comes into view.
Latest values: New Brunswick 1,639,000,000 (2026-08); British Columbia 9,970,000,000 (2026-08); Alberta 9,649,000,000 (2026-08); Saskatchewan 2,315,000,000 (2026-08); and 6 more in the data table.
Manufacturing sales by province, indexed
Seasonally adjusted shipments; start of period = 100.
Chart loads when it comes into view.
Latest values: New Brunswick 2,561,000,000 (2026-08); British Columbia 6,093,000,000 (2026-08); Alberta 10,510,000,000 (2026-08); Saskatchewan 2,300,000,000 (2026-08); and 6 more in the data table.
Investment in new building construction by province, indexed
Current dollars, not seasonally adjusted, 12-month sum; start of the period = 100.
Chart loads when it comes into view.
Latest values: New Brunswick 2,332,000,000 (2026-08); British Columbia 26,550,000,000 (2026-08); Alberta 21,980,000,000 (2026-08); Saskatchewan 3,138,000,000 (2026-08); and 6 more in the data table.
Housing starts by province (12-month average)
Seasonally adjusted annual rate, averaged over 12 months (smoothed); units per year. CMHC data distributed by Statistics Canada.
Chart loads when it comes into view.
Latest values: New Brunswick 7,583 (2026-09); British Columbia 43,320 (2026-09); Alberta 49,530 (2026-09); Saskatchewan 6,443 (2026-09); and 6 more in the data table.
Latest shares only. A measured exposure, not an estimate of how much output or income depends on an industry.
Industry
Share of provincial employment
Period
World oil price (WTI)
38.1%
2025
Health care and social assistance
16.8%
2025
Manufacturing
8.2%
2025
Construction
7.9%
2025
Professional, scientific and technical services
5.7%
2025
Finance, insurance, real estate, rental and leasing
5.0%
2025
Transportation and warehousing
4.8%
2025
Forestry, fishing, mining, quarrying, oil and gas
1.9%
2025
Agriculture
1.5%
2025
Real output by industry in New Brunswick, indexed
Real GDP at basic prices, chained 2017 dollars, annual (Statistics Canada table 36-10-0711-01); first year shown = 100. Goods and services against the total, with mining and oil and gas, manufacturing and the public sector. Chained-dollar levels are not additive, so only changes are compared.
Chart loads when it comes into view.
Latest values: All industries 37,060,000,000 (2025); Goods-producing industries 8,951,000,000 (2025); Services-producing industries 28,110,000,000 (2025); Mining, quarrying and oil and gas 254,300,000 (2025); and 2 more in the data table.
Labour productivity by province
Real value added per hour worked, all industries, chained 2017 dollars (Statistics Canada table 36-10-0713-01), annual. A level, not an index: it compares output per hour across provinces, and is high where capital-intensive industries such as oil and gas or mining weigh heavily in the economy.
Chart loads when it comes into view.
Latest values: New Brunswick 51.9 (2025); Newfoundland and Labrador 72 (2025); Prince Edward Island 47.6 (2025); Nova Scotia 52.3 (2025); and 6 more in the data table.
Labour productivity in New Brunswick: goods and services
Real value added per hour worked, chained 2017 dollars, annual (Statistics Canada table 36-10-0713-01). Goods-producing industries include mining and oil and gas, so their level reflects capital-intensive resource extraction as well as manufacturing and construction.
Change in real output by industry in each province, 2015 to 2025
Percent change in real GDP at basic prices (chained 2017 dollars, annual) over ten years. Each industry is compared with itself; chained-dollar levels are not additive, so shares of the total are not shown. A measure of the change in output, not of income or employment.
Chart loads when it comes into view.
Top values: Prince Edward Island 38.2%; British Columbia 32.5%; Nova Scotia 26.3%.
How much of each province’s employment is in one industry
Share of provincial employment, 2025 annual average (Labour Force Survey). A measured exposure to an industry, not an estimate of how much output or income depends on it. “Resources” combines forestry, fishing, mining, quarrying and oil and gas.
Chart loads when it comes into view.
Top values: Newfoundland and Labrador 6.37%; Alberta 5.58%; Saskatchewan 3.76%.
Where each province’s goods exports go, and what they are, 2025
Share of each province’s domestic merchandise exports (customs basis). A measured exposure of export value to one market or one commodity group, not an estimate of how much income or employment depends on it.
Chart loads when it comes into view.
Top values: New Brunswick 90.4%; Alberta 85.43%; Prince Edward Island 80.05%.
7 · Cities
Metropolitan areas in New Brunswick
City pages use metropolitan data; this province page must not be read as any of them.
No metropolitan area in New Brunswick is configured yet.
8 · Connections
Recorded relationships
From the relationship graph, each with its evidence class.
New Brunswick is a province of Canada. institutional relationshipdetails
90.4% of New Brunswick's domestic merchandise exports went to the United States in 2025 (customs basis). documented exposuredetails
The provincial or territorial government's accounts
Statistics Canada government finance statistics (public-accounts basis), fiscal years ended 31 March. Annual, and about two years behind: past position, not this year's budget.
Measure
Latest
Fiscal year beginning in April
Year before
Revenue
C$13.6 billion
2024
C$13.3 billion
Grants received from other governments (part of revenue)
C$5.1 billion
2024
C$4.8 billion
Expense
C$13.1 billion
2024
C$12.5 billion
Net operating balance (revenue minus expense)
C$0.6 billion
2024
C$0.8 billion
Liabilities (end of fiscal year)
C$29.1 billion
2024
C$26.7 billion
Net worth (end of fiscal year; negative = liabilities exceed assets)
C$4.9 billion
2024
C$6.0 billion
Computed: grants from other governments were 37.1% of revenue in the fiscal year that began in April 2024; the table does not say which government paid them, and most are federal transfers. Compare on the atlas →
Computed: the net operating balance was 4.1% of revenue in the fiscal year that began in April 2024. Compare on the atlas →
10 · Not assessed
What this profile does not cover
Listed so that silence is not mistaken for absence of an issue.
The current budget, credit ratings and fiscal plan (only past fiscal years are held)
Housing prices and rents
Employment by industry over time (only the latest provincial shares are held)
Exports by destination over time (only the latest year is held)