GlobalCanadaCities
Northwest Territories · territory · data profile

Northwest Territories: territorial economy at a glance

Latest values, rankings and charts for Northwest Territories, all computed from Statistics Canada data held by this platform. The economic story below explains with attributed statements from official sources; the profile only computes. Forecasts quoted are their publishers' and Northline publishes none.

Analyze Northwest Territories in Intelligence Studio

Opens a workspace prepared from the published Northwest Territories measures, with what is missing stated.

The economy

What explains the Northwest Territories' economic decline, and what supports it while the diamond mines close?

The Northwest Territories' real GDP fell in 2025 and its population was the only one in Canada to fall in the latest year, as its diamond mines reach the end of their lives and none of the planned projects is large enough to replace them

What happened

The Northwest Territories' unemployment rate (three-month average, territorial survey) was 5.1% in October 2026 and its employment rate 67.8%. The population fell 0.3% over four quarters, and net interprovincial migration over the latest four quarters was -801 people (negative is an outflow). Average weekly earnings were C$1,792 a week in August 2026.

Why it happened

Historical context

Statistics Canada reported in May 2026 that the Northwest Territories was the only jurisdiction where GDP declined in 2025, marking two consecutive years of negative growth, with mining the top detractor. Its revised series, released on 5 November 2026, shows real output at basic prices of C$4.04 billion in 2023, C$4.07 billion in 2024 and C$3.99 billion in 2025, so 2024 is now a small rise.

Evidence: Statistics Canada: The Daily: Gross domestic product by industry: Provinces and territories, 2025

Historical context

CMHC says real GDP declined a further 2% in 2025, the weakest in Canada, and that diamond-sector weakness intensified after prices collapsed in 2024 and ageing mines moved closer to closure.

Evidence: Canada Mortgage and Housing Corporation: Northern Housing Report

Historical context

In its initial estimates for 2025, released in May 2026, the territory's bureau of statistics reports that oil and gas extraction fell 8.9 per cent and diamond mining 9.5 per cent in 2025 and that construction also declined by 9.5 per cent.

Evidence: NWT Bureau of Statistics (Statistics Canada estimates): Gross Domestic Product, Northwest Territories, 2025 Initial

Historical context

The territorial government says the major diamond mines that underpinned growth for almost three decades are reaching the end of their productive lives, that mining, oil and gas generated nearly one half of real GDP in 2003 but 18 per cent by 2024, and that since 2017 diamonds have been about two-thirds of exports.

Evidence: Government of the Northwest Territories, Department of Finance: Budget Papers 2026-2027: Northwest Territories Economic Outlook

Why it matters

Historical context

The territory's 2026-27 budget highlights say the forecast real GDP decline of 3.2 per cent in 2026 is driven by diamond mines reaching the end of their productive capacity, and that government expenditure by federal, territorial, Indigenous and local governments is expected to rise and offset part of the reduced resource activity.

Evidence: Government of the Northwest Territories, Department of Finance: Budget 2026-27 Highlights

Historical context

The outlook says public investment accounted for 78 per cent of total investment in 2025, up from 30 per cent in 2014, and that the public sector employs more residents than the private sector.

Evidence: Government of the Northwest Territories, Department of Finance: Budget Papers 2026-2027: Northwest Territories Economic Outlook

Historical context

The territory describes the Diavik mine as a pillar of the economy for more than twenty years supporting more than 1,100 jobs a year; the outlook says it was scheduled to close in 2026.

Evidence: Government of the Northwest Territories: Premier, Ministers respond as Diavik closure signals next chapter for NWT economy; Government of the Northwest Territories, Department of Finance: Budget Papers 2026-2027: Northwest Territories Economic Outlook

Historical context

The territory says Ekati entered receivership on July 14, 2026 after a court-supervised sale process failed to find a viable path to continue operations, earlier than the 2029 closure in the February outlook.

Evidence: Government of the Northwest Territories: Ministers Macdonald and Cleveland address court appointment of receiver for Ekati Diamond Mine; Government of the Northwest Territories, Department of Finance: Budget Papers 2026-2027: Northwest Territories Economic Outlook

History

Historical context

The territory says its employment rate of 65.7 per cent in 2025 remains below the pre-pandemic average of 68.4 per cent, that unemployment averaged 4.8 per cent, the second lowest in Canada, that nearly one quarter of workers are non-resident employees, the highest share of any province or territory, and that high labour productivity is a main reason for high household incomes and savings rates.

Evidence: Government of the Northwest Territories, Department of Finance: Budget Papers 2026-2027: Northwest Territories Economic Outlook

Across geographies

Historical context

The territorial bureau reports that Statistics Canada estimated the population at 45,904 on July 1, 2026, a decrease of 127 from a year earlier and the only decline in the country.

Evidence: NWT Bureau of Statistics (Statistics Canada estimates): Northwest Territories Population by Age and Gender, July 2026

Historical context

Statistics Canada reports that the territories had the highest median after-tax income in Canada in 2024, led by the Northwest Territories at 116,100 dollars, while poverty rates in the Northwest Territories were comparable to those in the provinces.

Evidence: Statistics Canada: The Daily: Canadian Income Survey, 2024

Historical context

CMHC says Yukon and the Northwest Territories have the lowest exposure to US tariffs among provinces and territories. The Northwest Territories is not a province: its surveys, GDP basis and fiscal arrangements differ.

Evidence: Canada Mortgage and Housing Corporation: Northern Housing Report

What it influences

Historical context

CMHC reports that Yellowknife's rental vacancy rate declined to 1.3%, almost half its five-year average, that construction costs in Yellowknife remain about 1.5 times those in Calgary, and that social housing is a large share of new residential investment in the territory.

Evidence: Canada Mortgage and Housing Corporation: Northern Housing Report

Historical context

The territory's budget address says a shortage of housing is among the challenges in a small working-age population and commits an additional 42 million dollars a year for three years.

Evidence: Government of the Northwest Territories, Department of Finance: Budget Address 2026-2027 and Fiscal Review (Budget Papers)

Historical context

The federal government announced an agreement in principle on at least 560 affordable housing units.

Evidence: Housing, Infrastructure and Communities Canada: Canada and Northwest Territories partner to build more homes and essential infrastructure

Historical context

The federal Major Projects Office describes a proposed all-season road of about 400 kilometres through the Slave Geological Province to the Nunavut border.

Evidence: Government of Canada, Major Projects Office: Arctic Economic and Security Corridor

Historical context

It also describes a Taltson hydro expansion that will double the territory's hydro capacity and link communities serving over 70% of the population; the Prime Minister's office referred the Mackenzie Valley Highway to the Major Projects Office in March 2026.

Evidence: Government of Canada, Major Projects Office: Taltson Hydro Expansion; Prime Minister of Canada: Prime Minister Carney announces ambitious new plan to defend, build, and transform the North

Risks

Historical context

The territory says there are currently no new or potential mining projects large enough to replace the economic footprint of the diamond mines, that future mining is likely to be smaller-scale, and that labour shortages are a continuous challenge because of the small resident workforce.

Evidence: Government of the Northwest Territories, Department of Finance: Budget Papers 2026-2027: Northwest Territories Economic Outlook

Historical context

It says the structural challenges that weigh on the economy also limit its ability to raise revenue, and that Imperial Oil's decision to cease operations in the Sahtu will have negative economic consequences.

Evidence: Government of the Northwest Territories, Department of Finance: Budget Address 2026-2027 and Fiscal Review (Budget Papers)

Historical context

Job Bank projects that mining employment will decline as the large diamond mines reach closure.

Evidence: Employment and Social Development Canada (Job Bank): Economic Scan - Yukon, Northwest Territories and Nunavut: 2026

What to watch

Historical context

The 2026-27 budget projects an operating surplus after adjustments of 20 million dollars and total debt of 2.21 billion dollars on March 31, 2027 against a federally imposed borrowing limit of 3.1 billion dollars.

Evidence: Government of the Northwest Territories, Department of Finance: Budget 2026-27 Highlights

Historical context

A private Signal49 forecast relayed by Job Bank projects a decline of 2.9 per cent in 2026. These are the publishers' forecasts, not Northline's. The territorial bureau's releases and Statistics Canada's population estimates (release calendar) show how closures and migration develop.

Evidence: Employment and Social Development Canada (Job Bank): Economic Scan - Yukon, Northwest Territories and Nunavut: 2026

Fiscal position, investment and comparisons

How do the Northwest Territories' public finances, capital plan, trade exposure, labour market and housing differ from Yukon and Nunavut and from the national picture, and what do the sources say explains the differences?

The Northwest Territories government runs a thin operating surplus that rests on federal transfers, not on the resource revenue of the mines that are closing, while the large projects in view are mostly public: a capital plan and unbuilt northern roads and power lines

What happened

The Northwest Territories had 46 thousand residents on 1 July 2026, a change of -0.3% from four quarters earlier, while Yukon's population changed 2.5% and Nunavut's 2.3%. On Statistics Canada's basis, in the fiscal year that began in April 2024, the territorial government had a net operating balance of C$252 million, 8.0% of revenue, and grants from other governments were 74.0% of revenue.

Historical context

The territory's own consolidated financial statements for fiscal 2024-25 report an operating surplus of $46.3 million.

Evidence: Government of the Northwest Territories (Finance): 2024-2025 Public Accounts: Financial Highlights

Why it happened

Fiscal position

Historical context

The territory's 2026-27 budget projects an operating surplus after adjustments of $20 million in 2026-27 from revenues of $2.744 billion and total expenditures of $2.724 billion; total debt on March 31, 2027 is forecast at $2.21 billion against a federally imposed borrowing limit of $3.1 billion.

Evidence: Government of the Northwest Territories, Department of Finance: Budget 2026-27 Highlights

Historical context

The fiscal review calls the surpluses thin: budgeted at $20 million in 2026-27 and forecast at $30 million in 2027-28. It says the 2024-25 result was a $44-million surplus, $280 million lower than projected, and forecasts an average annual increase in total debt of 8.5 per cent over the outlook.

Evidence: Government of the Northwest Territories, Department of Finance: Budget Address 2026-2027 and Fiscal Review (Budget Papers)

Historical context

Its borrowing headroom is $769 million below the federally imposed limit after a required $120-million cushion, and the year-end 2026-27 debt projection is $324 million higher than a year earlier.

Evidence: Government of the Northwest Territories, Department of Finance: Budget Address 2026-2027 and Fiscal Review (Budget Papers)

Where the revenue comes from

Historical context

The fiscal review says federal transfers for programs and services are 80 per cent of total revenues and that Territorial Formula Financing alone accounts for about 70 per cent, and that it dominates revenue growth. In the estimates table the grant from Canada is 1,906,943 thousand dollars in 2026-27, and revenues rise by $84 million largely because of a $104-million increase in that grant.

Evidence: Government of the Northwest Territories, Department of Finance: Budget Address 2026-2027 and Fiscal Review (Budget Papers)

Historical context

Finance Canada's letter puts the territory's Territorial Formula Financing payment for 2025-26 at $1.8 billion and total major transfers at $1.9 billion, of which the Canada Health Transfer and Canada Social Transfer are $58 million and $18 million.

Evidence: Department of Finance Canada: Letters to Provinces and Territories: Northwest Territories 2024 (2025-26 transfer payments)

Historical context

Finance Canada says natural resource revenues are not part of the eligible revenues in the Territorial Formula Financing calculation, that their treatment is negotiated separately with each territory in devolution, and that the Yukon and Northwest Territories have completed devolution and resource revenue sharing agreements while negotiations with Nunavut continue. The territory also says that when a mine stops operations the reduced activity reduces its tax revenue and may cause the population to decrease, which affects the federal transfers it receives.

Evidence: Department of Finance Canada: Territorial Formula Financing

Opinion

The sources together imply that the closures hurt the territorial budget mainly through taxes and through population-driven transfers, not through lost royalties; the research desk reads it that way. This is an interpretation, not a source statement.

Why it matters

Investment, major projects and infrastructure

Historical context

The capital budget calls for total planned infrastructure investment of $436 million, of which $161 million is for projects partly or wholly funded by the federal government. The highlights are $129 million for highways and roads and $69 million for renewable energy, and the territory expects the plan to add $175 million to the economy and support about 808 full-time job equivalents.

Evidence: Government of the Northwest Territories, Department of Finance: Budget Address 2026-2027 and Fiscal Review (Budget Papers)

Historical context

The federal Major Projects Office describes the Taltson Hydro Expansion as an additional 60 megawatt hydro facility that connects the North and South Slave Lake grids for the first time through a 320-kilometre line, serving over 70% of the territory's population and reducing reliance on backup diesel.

Evidence: Government of Canada, Major Projects Office: Taltson Hydro Expansion

Historical context

The Canada Energy Regulator explains the need: the territory has no territorial electricity grid and, of the 25 communities outside the Great Slave Lake grids, 23 rely on diesel-fired plants.

Evidence: Canada Energy Regulator: Provincial and Territorial Energy Profiles: Northwest Territories

Historical context

The Arctic Economic and Security Corridor is a proposed road of about 400 km through the Slave Geological Province to the Nunavut border, led by the Tłı̨chǫ Government and Yellowknives Dene First Nation with the territory, where it would connect with the Grays Bay Road, and the Office says it would give mines in the territory export access to a deepwater port at Grays Bay. On August 15, 2026 the two Indigenous governments announced consensus on a proposed corridor.

Evidence: Government of Canada, Major Projects Office: Arctic Economic and Security Corridor

Historical context

The Major Projects Office says Grays Bay Road and Port is a proposed ~230 km road and deepwater port delivered through a Kitikmeot Inuit partnership with private investors, that up to $50 million was announced for planning and preconstruction, and that it is undergoing assessment under the Nunavut Planning and Project Assessment Act.

Evidence: Government of Canada, Major Projects Office: Grays Bay Road and Port

Historical context

The Prime Minister says the Mackenzie Valley Highway, on which isolated communities now rely on a seasonal winter road and summer barges, was referred to the Major Projects Office and would link Yellowknife and Inuvik.

Evidence: Prime Minister of Canada: Prime Minister Carney announces ambitious new plan to defend, build, and transform the North

Historical context

The territory says there are no new or potential mining projects large enough to replace the diamond mines, and that planned development of the M-18 gas field in the Beaufort Delta is expected to boost natural gas production.

Evidence: Government of the Northwest Territories, Department of Finance: Budget Papers 2026-2027: Northwest Territories Economic Outlook

Historical context

The Canada Energy Regulator reports that crude oil production fell from 11.3 to 4.0 Mb/d (the Energy Regulator's unit) between 2013 and 2023.

Evidence: Canada Energy Regulator: Provincial and Territorial Energy Profiles: Northwest Territories

Historical context

The territory adds that production will cease at Norman Wells in late 2026.

Evidence: Government of the Northwest Territories, Department of Finance: Budget Papers 2026-2027: Northwest Territories Economic Outlook

Historical context

The Major Projects Office says the aim is for Taltson to begin producing power within 10 years, so it is a decade-long project; the sources do not say how much of it the 2026-27 capital plan funds.

Evidence: Government of Canada, Major Projects Office: Taltson Hydro Expansion

History

Real output at basic prices in the Northwest Territories (chained 2017 dollars, Statistics Canada table 36-10-0711-01) was C$4.0 billion in 2025, a change of -9.1% over ten years. Over the same ten years goods-producing industries changed -35.9% and services-producing industries 5.7%; mining, quarrying and oil and gas changed -33.2%, manufacturing -29.4% and the public sector 20.7%. These are changes in real output, not in income or jobs, and the table gives no reason for the differences; the sourced paragraphs in this section and in the story give the explanations that named sources offer.

Real output by industry in Northwest Territories, indexed

Real GDP at basic prices, chained 2017 dollars, annual (Statistics Canada table 36-10-0711-01); first year shown = 100. Goods and services against the total, with mining and oil and gas, manufacturing and the public sector. Chained-dollar levels are not additive, so only changes are compared.

Chart loads when it comes into view.

Latest values: All industries 3,992,000,000 (2025); Goods-producing industries 925,900,000 (2025); Services-producing industries 3,109,000,000 (2025); Mining, quarrying and oil and gas 532,700,000 (2025); and 2 more in the data table.

Labour productivity, meaning real value added per hour worked in chained 2017 dollars (Statistics Canada table 36-10-0713-01), was C$83.20 an hour in the Northwest Territories in 2025, a change of -2.5% over ten years. In goods-producing industries it was C$106.70 an hour (a change of -9.7% over ten years) and in services-producing industries C$79.50 an hour (a change of 6.0%). A high level can reflect capital-intensive industries such as oil, gas and mining rather than the efficiency of the whole economy, and the table says nothing about why levels or changes differ.

Labour productivity in Northwest Territories: goods and services

Real value added per hour worked, chained 2017 dollars, annual (Statistics Canada table 36-10-0713-01). Goods-producing industries include mining and oil and gas, so their level reflects capital-intensive resource extraction as well as manufacturing and construction.

Chart loads when it comes into view.

Latest values: All industries 83.2 (2025); Goods-producing industries 106.7 (2025); Services-producing industries 79.5 (2025).

Historical context

The territory says that in 2003 mining, oil and gas generated nearly half of real GDP but by 2024 its share was 18 per cent, and that non-renewable resource industries produced high business labour productivity over two decades whose falling output now lowers overall labour productivity.

Evidence: Government of the Northwest Territories, Department of Finance: Budget Papers 2026-2027: Northwest Territories Economic Outlook

Across geographies

Trade and tariff exposure

Historical context

The territory says that since 2017 diamonds have been about two-thirds of exports, that real exports are projected to fall 4.9 per cent in 2026 as the Diavik mine and Imperial Oil facility close, and that supply chain disruptions, low global diamond prices and United States import tariffs have raised uncertainty, particularly for mining.

Evidence: Government of the Northwest Territories, Department of Finance: Budget Papers 2026-2027: Northwest Territories Economic Outlook

Historical context

CMHC says Yukon and the Northwest Territories have the lowest exposure to U.S. tariffs among provinces and territories.

Evidence: Canada Mortgage and Housing Corporation: Northern Housing Report

Historical context

The territory's minister says geopolitical tariffs have driven down the value of rough stones and increased the cost of doing business in the diamond sector.

Evidence: Government of the Northwest Territories: Minister Cleveland welcomes federal support for Ekati Diamond Mine, outlines next steps for Northern workers, businesses, and the resource economy

Opinion

The two statements are not contradictory but measure different things: CMHC compares direct exposure, the minister describes the price effect on one product. No source gives the territory's United States export share (see limitations), so exposure by country is not stated.

Comparison with Yukon and Nunavut

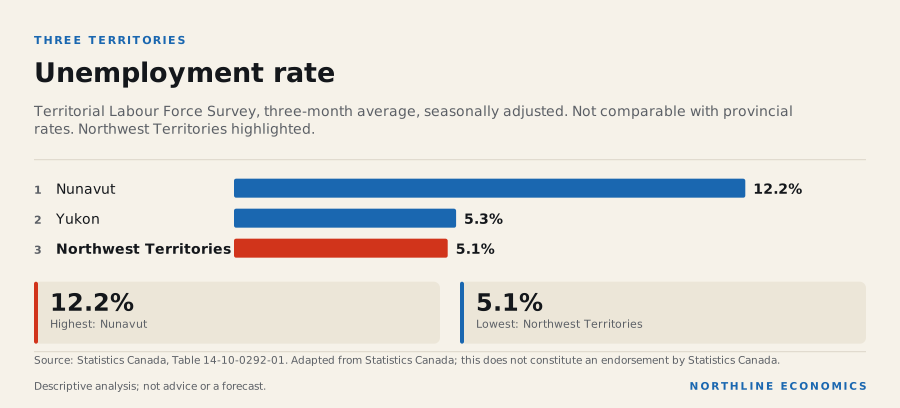
Average weekly earnings in August 2026 were C$1,792 a week in the Northwest Territories, C$1,922 a week in Nunavut and C$1,554 a week in Yukon, against C$1,355 a week for Canada. Territorial labour surveys are three-month averages and are not comparable with provincial rates: in October 2026 the unemployment rate was 5.1% in the Northwest Territories, 5.3% in Yukon and 12.2% in Nunavut. Transfers and other grants were 74.0% of revenue in the Northwest Territories, 85.0% in Yukon and 82.8% in Nunavut in the fiscal year that began in April 2024, on Statistics Canada's basis.

Historical context

Nunavut's finance department reports that Territorial Formula Financing will provide $2,347.9 million in 2026-27 and that it and other federal transfers make up 70% of Nunavut's revenues, against 36% in New Brunswick and 16% in British Columbia on that department's measure; the Northwest Territories' own budget gives a comparable share for federal transfers, above.

Evidence: Government of Nunavut, Department of Finance: Budget 2026-27 Fiscal and Economic Indicators

Historical context

Nunavut's borrowing limit is $1.05 billion with $747 million of room, against the Northwest Territories' federally imposed limit and debt shown in the fiscal section above.

Evidence: Government of Nunavut, Department of Finance: 2026-27 Budget Highlights

Historical context

Nunavut's finance department reports that in March 2026 the government received an AA rating with a stable trend; the sources cited give no equivalent statement for the Northwest Territories.

Evidence: Government of Nunavut, Department of Finance: Budget 2026-27 Fiscal and Economic Indicators

Historical context

Job Bank says the Yukon's economy contracted in 2025 after the Eagle Gold Mine closure, Nunavut had strong growth from gold mining and government-funded construction, and the Northwest Territories' economy contracted on reduced diamond production; the Signal49 forecasts it relays for 2026 are a decline of 2.9% for the Northwest Territories, growth of 2.5% for Yukon and 6.9% for Nunavut.

Evidence: Employment and Social Development Canada (Job Bank): Economic Scan - Yukon, Northwest Territories and Nunavut: 2026

Historical context

Nunavut's finance department says mining accounts for almost 50% of its economy and expects real GDP to grow over 11% in 2026, so the contrast is that gold is expanding in Nunavut while diamonds are closing in the Northwest Territories.

Evidence: Government of Nunavut, Department of Finance: Budget 2026-27 Fiscal and Economic Indicators

What it influences

Labour, productivity, housing and migration

Historical context

The territory reports an employment rate of 65.7 per cent in 2025, below its pre-pandemic 68.4 per cent, and nearly one quarter of workers are non-resident employees, the highest share of any province or territory.

Evidence: Government of the Northwest Territories, Department of Finance: Budget Papers 2026-2027: Northwest Territories Economic Outlook

Historical context

It explains productivity: labour productivity is higher than the rest of Canada because of the dominance of the resource and public sectors, wage growth has been strong in the public and services sector while wages in goods-producing industries remain flat, and average weekly earnings are second highest in Canada after Nunavut.

Evidence: Government of the Northwest Territories, Department of Finance: Budget Papers 2026-2027: Northwest Territories Economic Outlook

Historical context

The budget address adds that the public sector competes with private employers for workers in a territory with a small working-age population and that a shortage of housing makes the labour market very tight.

Evidence: Government of the Northwest Territories, Department of Finance: Budget Address 2026-2027 and Fiscal Review (Budget Papers)

Historical context

Job Bank reports that from 2020/2021 to 2024/2025 9,886 residents left the Northwest Territories and 8,456 arrived, mainly to southern provinces for better job prospects; in Yukon 8,092 arrived and 6,587 left, and Nunavut lost 5,188 and gained 4,054. Net interprovincial migration over the latest four quarters was -801 in the Northwest Territories, 503 in Yukon and 298 in Nunavut.

Evidence: Employment and Social Development Canada (Job Bank): Economic Scan - Yukon, Northwest Territories and Nunavut: 2026

Historical context

Job Bank gives the median age as 35.8 years in the Northwest Territories and 27.1 in Nunavut, where it describes the youngest population in Canada.

Evidence: Employment and Social Development Canada (Job Bank): Economic Scan - Yukon, Northwest Territories and Nunavut: 2026

Historical context

CMHC reports that Yellowknife's vacancy rate declined to 1.3%, that Iqaluit's stayed at 0.3%, and that Whitehorse's rose to 1.9%; social housing was 36% of new residential construction investment in the Northwest Territories, 35% in Yukon and 93% in Nunavut.

Evidence: Canada Mortgage and Housing Corporation: Northern Housing Report

Historical context

Housing Northwest Territories and Build Canada Homes reached an agreement in principle on at least 560 units through about $480 million, with $82.4 million for infrastructure over ten years.

Evidence: Housing, Infrastructure and Communities Canada: Canada and Northwest Territories partner to build more homes and essential infrastructure

Opinion

Taken together, the sources describe the same constraint in all three territories, a small workforce with too little housing, and differ in how it shows up: out-migration in the Northwest Territories and Nunavut, newcomers in Yukon. No source tests whether housing supply explains the Northwest Territories' net outflow, so that link is a hypothesis.

Risks

Historical context

The territory lists reliance on federal transfers, dependence on resources, capital cost overruns and debt among its fiscal risks, notes that Territorial Formula Financing growth relies on provincial and local government spending and population growth relative to Canada, and says an underdeveloped private sector limits its ability to raise revenue through tax changes.

Evidence: Government of the Northwest Territories, Department of Finance: Budget Address 2026-2027 and Fiscal Review (Budget Papers)

Historical context

The territory holds financial security for the Ekati Mine to meet closure and reclamation obligations if the company cannot, after the court-supervised sale found no viable purchaser.

Evidence: Government of the Northwest Territories: Ministers Macdonald and Cleveland address court appointment of receiver for Ekati Diamond Mine

What to watch

The 2026-27 budget forecasts real GDP to fall 3.2 per cent in 2026. This is the territory's forecast, not Northline's. Watch the next quarterly population estimates from Statistics Canada, the territory's next fiscal update and the outcome of the Mackenzie Valley Highway, Taltson and corridor reviews at the Major Projects Office.

Written profile

What do the data show about the Northwest Territories economy?

The Northwest Territories had 46 thousand residents on 1 July 2026, and for fiscal 2024-25 its government's net operating balance was C$252 million on Statistics Canada's basis, against an operating surplus of $46.3 million in its own accounts

The Northwest Territories against the other territories

The Northwest Territories is the one territory whose population fell over the latest year and whose real output is below its 2019 level. Its population was 46 thousand on 1 July 2026, -0.3% against four quarters earlier, with net interprovincial migration of -801 persons (negative is a net outflow). Over the same four quarters immigrants numbered 520 and non-permanent residents changed by 60. Population is 13.0% higher than in 2001, the slowest of the three territories.

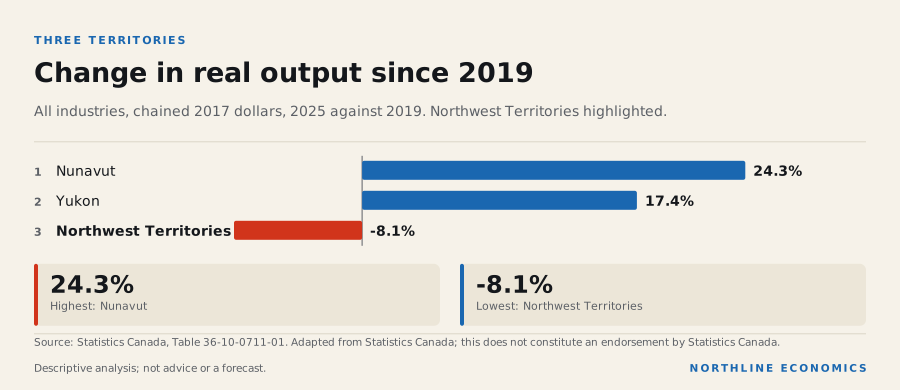
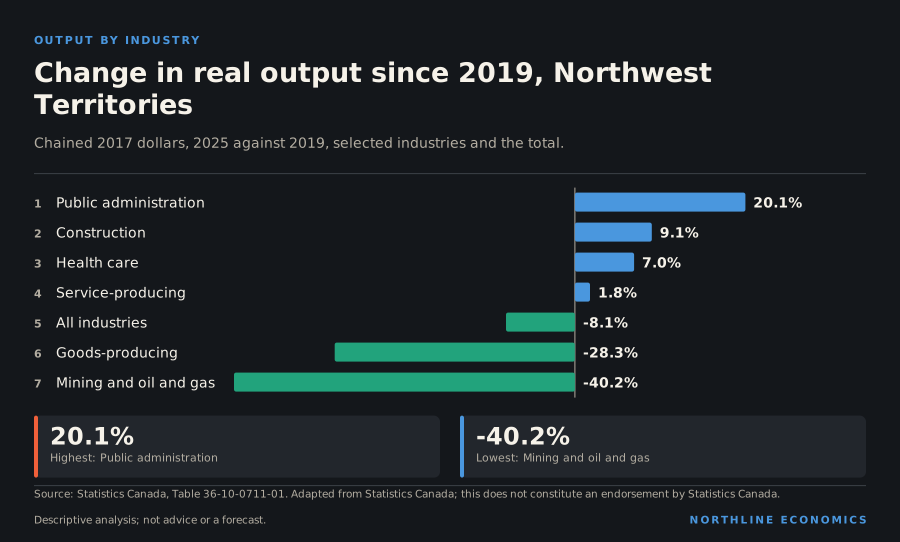
In 2025 real output across all industries was -8.1% against 2019, and real GDP at market prices was -9.1% against 2019; measured from 2020, when the pandemic depressed output, real GDP changed by 0.3%. The decline is concentrated in goods production: goods-producing output changed by -28.3% and mining, quarrying and oil and gas extraction by -40.2%, while public administration grew 20.1% and health care 7.0%. The data do not say which operations account for the change in mining.

Change in real output since 2019, Northwest Territories. Public administration 20.1%; Construction 9.1%; Health care 7.0%; Service-producing 1.8%; All industries -8.1%; Goods-producing -28.3%; Mining and oil and gas -40.2%.
The data behind this graphic
Change in real output since 2019, Northwest Territories
ItemValue
Public administration20.1%
Construction9.1%
Health care7.0%
Service-producing1.8%
All industries-8.1%
Goods-producing-28.3%
Mining and oil and gas-40.2%

Download this graphic (SVG, with source)

Change in real output since 2019. Nunavut 24.3%; Yukon 17.4%; Northwest Territories -8.1%.
The data behind this graphic
Change in real output since 2019
ItemValue
Nunavut24.3%
Yukon17.4%
Northwest Territories-8.1%

Download this graphic (SVG, with source)

Productivity, pay and spending

Labour productivity, real value added per hour worked, was C$83.20 an hour in 2025, -10.3% against 2019, the only territory where it fell. Average weekly earnings of C$1,792 a week in August 2026 were the second-highest of the three and 1.1% higher than a year earlier, the slowest growth of the three. Retail sales in August 2026 were 1.4% higher than a year earlier. In October 2026 the unemployment rate was 5.1%, the participation rate 71.4% and the employment rate 67.8%, from a small survey that is not comparable with provincial rates.

Unemployment rate. Nunavut 12.2%; Yukon 5.3%; Northwest Territories 5.1%.
The data behind this graphic
Unemployment rate
ItemValue
Nunavut12.2%
Yukon5.3%
Northwest Territories5.1%

Download this graphic (SVG, with source)

A surplus against a shrinking base

In the fiscal year that began in April 2024 the territorial government had revenue of C$3.1 billion, of which C$2.3 billion was grants from other governments, 74.0% of revenue. The net operating balance was C$252 million, a surplus of 8.0% of revenue, the largest relative surplus of the three territories, and liabilities were 0.56 times revenue. Net worth was C$3.9 billion. The basis is Statistics Canada's, which differs from the territory's own accounts, and one year is not a trend.

Historical context

The territory's own consolidated financial statements for fiscal 2024-25 report an operating surplus of $46.3 million, against a revised budget deficit.

Evidence: Government of the Northwest Territories (Finance): 2024-2025 Public Accounts: Financial Highlights

What it means for decisions

Opinion

For a business, the Northwest Territories is a small market that is losing people and has seen goods-producing output fall, though wages are rising and the public sector is growing. For a government or lender, the position is a favourable fiscal year set against a shrinking base: the data cannot say whether the fall in mining output is temporary. For a resident, the population outflow is the clearest signal in the data.

What the data cannot say: they do not separate Yellowknife from the other communities, they do not explain the mining decline, the survey is small, and a few employers or projects can move percentage changes. Nothing here is a forecast.

Labour market

In the territorial Labour Force Survey (three-month average, seasonally adjusted, a smaller survey than the provincial one), the unemployment rate was 5.1% in October 2026, the participation rate 71.4% and the employment rate 67.8%. These rates are not comparable with the provincial monthly rates and are not ranked against them.

Unemployment rate in the territories

Percent, three-month moving average, seasonally adjusted, 15 years and over (territorial Labour Force Survey; not comparable with the provincial monthly rates).

Chart loads when it comes into view.

Latest values: Northwest Territories 5.1 (2026-10); Yukon 5.3 (2026-10); Nunavut 12.2 (2026-10).

People and output

The population fell 0.3% over four quarters, with net interprovincial migration of -801 persons over the latest four quarters. Real GDP was C$4.2 billion in 2025. Average weekly earnings were C$1,792 a week in August 2026.

Population of the territories, indexed

Quarterly estimates; start of period = 100.

Chart loads when it comes into view.

Latest values: Northwest Territories 45,900 (2026 Q3); Yukon 50,360 (2026 Q3); Nunavut 43,090 (2026 Q3).

Long-run perspective

Population is 13.0% higher on 1 July 2026 than in 2001, against 35.6% for Canada as a whole.

Average weekly earnings, in current dollars and not seasonally adjusted, are 102.9% higher in August 2026 than in the same month twenty-five years earlier (106.8% for Canada). These are nominal figures: they include the effect of price increases over twenty-five years and are not a measure of the change in purchasing power.

These comparisons describe the size of changes between two dates. They do not say why this jurisdiction differs from Canada, and the end points can matter: a different starting year changes the percentage.

Public finances

For the fiscal year that began in April 2024, on Statistics Canada's basis, the territorial government's revenue was C$3.1 billion and its expense C$2.9 billion, leaving a net operating balance of C$252 million. Grants received from other governments were C$2.3 billion, 74.0% of revenue (mostly federal transfers; not split by payer in the table). Liabilities were C$1.8 billion and net worth C$3.9 billion. These are past-year accounts, not the current budget.

What is not assessed

Consumer prices (published for capital cities only), housing, industry structure, exports, the current budget, major projects and policy changes, and why the Northwest Territories differs from other places. This profile cites no source that explains these differences, and nothing here is a forecast.

1 · Where it ranks

Northwest Territories among the places with data

Same values as the Canada atlas layers. Rank 1 is the highest value, which is not always the most favourable outcome. A measure the source does not publish for a place is simply absent.

MeasureLatestPeriodRank (1 = highest)
Population growth
% change over 4 quarters
-0.3%2026 Q313 of 13
Average weekly earnings
C$ per week
$1,7922026-082 of 13
Job vacancy rate
%, unadjusted
4.6%2026-071 of 13
Retail sales growth
% change, latest 12 months vs the 12 before
-5.0%2026-0813 of 13
Building construction investment growth
% change, latest 12 months vs the 12 before
133.8%2026-081 of 13
Real GDP growth (annual)
% change, annual, chained 2017 dollars
-2.4%202512 of 13
Immigrants per 1,000 residents
persons per 1,000 residents, latest 4 quarters
11.32026 Q25 of 13 (tied)
Non-permanent residents, net change per 1,000
persons per 1,000 residents, latest 4 quarters
1.32026 Q22 of 13
Net interprovincial migration per 1,000
persons per 1,000 residents, latest 4 quarters
-17.42026 Q213 of 13
Provincial government net operating balance
% of revenue, fiscal year beginning in April
8.0%20242 of 13
Grants received from other governments
% of revenue, fiscal year beginning in April
74.0%20243 of 13

See Northwest Territories on the atlas →

2 · Labour market

Unemployment, participation, employment and earnings

Northwest Territories is emphasised; the other territories are shown for context. The territorial survey is a different, smoothed table: do not compare these rates with provincial charts.

Unemployment rate in the territories

Percent, three-month moving average, seasonally adjusted, 15 years and over (territorial Labour Force Survey; not comparable with the provincial monthly rates).

Chart loads when it comes into view.

Latest values: Northwest Territories 5.1 (2026-10); Yukon 5.3 (2026-10); Nunavut 12.2 (2026-10).

Participation rate in the territories

Percent of the population aged 15 and over, three-month moving average, seasonally adjusted.

Chart loads when it comes into view.

Latest values: Northwest Territories 71.4 (2026-10); Yukon 73 (2026-10); Nunavut 62 (2026-10).

Employment rate in the territories

Percent of the population aged 15 and over, three-month moving average, seasonally adjusted.

Chart loads when it comes into view.

Latest values: Northwest Territories 67.8 (2026-10); Yukon 68.9 (2026-10); Nunavut 54.4 (2026-10).

Average weekly earnings in the territories

Current dollars per week, industrial aggregate incl. overtime, not seasonally adjusted.

Chart loads when it comes into view.

Latest values: Northwest Territories 1,792 (2026-08); Yukon 1,554 (2026-08); Nunavut 1,922 (2026-08).

3 · People

Population and immigration

Quarterly population estimates and four-quarter immigration totals.

Population of the territories, indexed

Quarterly estimates; start of period = 100.

Chart loads when it comes into view.

Latest values: Northwest Territories 45,900 (2026 Q3); Yukon 50,360 (2026 Q3); Nunavut 43,090 (2026 Q3).

Immigrants to the territories (4-quarter total)

New permanent residents arriving over the previous four quarters.

Chart loads when it comes into view.

Latest values: Northwest Territories 520 (2026 Q2); Yukon 759 (2026 Q2); Nunavut 102 (2026 Q2).

4 · Output and activity

GDP, retail and construction

Annual real GDP and monthly activity indicators, indexed so the start of the period equals 100.

Real GDP of the territories, indexed

Annual, 2017 constant prices (not chained); start of the period = 100. Expenditure-based.

Chart loads when it comes into view.

Latest values: Northwest Territories 4,168,000,000 (2025); Yukon 3,425,000,000 (2025); Nunavut 4,139,000,000 (2025).

Retail sales in the territories, indexed

Seasonally adjusted; start of period = 100.

Chart loads when it comes into view.

Latest values: Northwest Territories 85,900,000 (2026-08); Yukon 107,000,000 (2026-08); Nunavut 65,900,000 (2026-08).

Investment in new building construction in the territories, indexed

Current dollars, not seasonally adjusted, 12-month sum; start of the period = 100.

Chart loads when it comes into view.

Latest values: Northwest Territories 138,100,000 (2026-08); Yukon 502,900,000 (2026-08); Nunavut 341,300,000 (2026-08).

Real output by industry in Northwest Territories, indexed

Real GDP at basic prices, chained 2017 dollars, annual (Statistics Canada table 36-10-0711-01); first year shown = 100. Goods and services against the total, with mining and oil and gas, manufacturing and the public sector. Chained-dollar levels are not additive, so only changes are compared.

Chart loads when it comes into view.

Latest values: All industries 3,992,000,000 (2025); Goods-producing industries 925,900,000 (2025); Services-producing industries 3,109,000,000 (2025); Mining, quarrying and oil and gas 532,700,000 (2025); and 2 more in the data table.

Labour productivity in the territories

Real value added per hour worked, all industries, chained 2017 dollars (Statistics Canada table 36-10-0713-01), annual. Territorial output per hour reflects mining and public administration and small populations, and is not comparable with provinces.

Chart loads when it comes into view.

Latest values: Northwest Territories 83.2 (2025); Yukon 66.5 (2025); Nunavut 88.3 (2025).

Labour productivity in Northwest Territories: goods and services

Real value added per hour worked, chained 2017 dollars, annual (Statistics Canada table 36-10-0713-01). Goods-producing industries include mining and oil and gas, so their level reflects capital-intensive resource extraction as well as manufacturing and construction.

Chart loads when it comes into view.

Latest values: All industries 83.2 (2025); Goods-producing industries 106.7 (2025); Services-producing industries 79.5 (2025).

Change in real output by industry in the territories, 2015 to 2025

Percent change in real GDP at basic prices (chained 2017 dollars, annual) over ten years. Each industry is compared with itself; chained-dollar levels are not additive, so shares of the total are not shown. A measure of the change in output, not of income or employment.

Chart loads when it comes into view.

Top values: Nunavut 66.2%; Yukon 30%; Northwest Territories -9.1%.

5 · Public finances

The provincial or territorial government's accounts

Statistics Canada government finance statistics (public-accounts basis), fiscal years ended 31 March. Annual, and about two years behind: past position, not this year's budget.

MeasureLatestFiscal year beginning in AprilYear before
RevenueC$3.1 billion2024C$3.0 billion
Grants received from other governments (part of revenue)C$2.3 billion2024C$2.2 billion
ExpenseC$2.9 billion2024C$3.1 billion
Net operating balance (revenue minus expense)C$0.3 billion2024−C$0.0 billion
Liabilities (end of fiscal year)C$1.8 billion2024C$1.8 billion
Net worth (end of fiscal year; negative = liabilities exceed assets)C$3.9 billion2024C$3.3 billion

Computed: grants from other governments were 74.0% of revenue in the fiscal year that began in April 2024; the table does not say which government paid them, and most are federal transfers. Compare on the atlas →

Computed: the net operating balance was 8.0% of revenue in the fiscal year that began in April 2024. Compare on the atlas →

6 · Not assessed

What this profile does not cover

Listed so that silence is not mistaken for absence of an issue.