Latest values, rankings and charts for Ontario, all computed from Statistics Canada data held by this platform. The economic story below explains with attributed statements from official sources; the profile only computes. Forecasts quoted are their publishers' and Northline publishes none.
Data profile with a sourced economic storyEvery statement in the data profile below is computed from a published series and links to its source in the chart footers. Rankings compare places on the same definition and period; they describe differences and do not explain them. The three territories have their own profiles.
The economy
Why has Ontario's economy slowed, and why do the province and its fiscal watchdog disagree about what comes next?
Ontario's independent fiscal watchdog says the province went through a technical recession from late 2025 to early 2026 and, unlike the government, projects no return to a balanced budget, as tariffs and stalled population growth weigh on the economy
What happened
Ontario's unemployment rate was 7.3% in October 2026, employment was 0.3% higher than a year earlier, and the population was 0.3% higher than four quarters earlier. Real output across all industries changed 12.3% between 2019 and 2025.
Why it happened
Historical context
The Financial Accountability Office of Ontario says real GDP growth slowed from 1.6 per cent in 2024 to 1.3 per cent in 2025 as US tariffs hindered Ontario's exports and machinery and equipment investment while residential investment continued to fall, and that Ontario is expected to be disproportionately affected by uncertainty in Canada-US trade relations because its manufacturing sector continues to face significant pressure from US tariffs. Statistics Canada's revised market-price series at 2017 constant prices, released on 5 November 2026, shows 1.8% for 2025.
The provincial budget says exports experienced their biggest decline since the pandemic in the second quarter of 2025, contributing to a 0.7 per cent decline in real GDP that quarter, and that trade disruptions disproportionately affected employment in regions near the United States and with more manufacturing.
The FAO adds that sales rebounded in the second quarter of 2026 after a prolonged period of weakness reflecting US tariffs and auto plant shutdowns for retooling.
The FAO says Ontario experienced a modest technical recession from the fourth quarter of 2025 to the first quarter of 2026, the first back-to-back decline in quarterly activity since the 2020 pandemic period, and that several challenges have caused the economy to struggle over the past year, including US tariffs, a declining population and elevated geopolitical uncertainty.
It reports that the annual unemployment rate rose to 7.7 per cent in 2025, the highest since 2012 excluding the pandemic, and projects employment growth slowing to 0.2 per cent in 2026 as the labour market adjusts to trade pressures and a significant reduction in new immigrants and temporary residents.
The FAO reports that Ontario's population decreased by 0.2 per cent in the fourth quarter of 2025 and 0.7 per cent in the first quarter of 2026 compared with a year earlier, the first decrease on records back to 1951, caused by a significant outflow of non-permanent residents and fewer new permanent residents. Statistics Canada's current series, revised in September 2026, no longer shows a fall from a year earlier in those quarters: the population was 0.6% higher on 1 October 2025 and 0.5% higher on 1 January 2026 than a year before, and 0.3% higher in the year to 1 July 2026.
CMHC says British Columbia and Ontario are likely to see the weakest housing-market growth because of slower population growth, affordability challenges and higher supply, with historically low construction most visible in the condominium market.
Statistics Canada reports that in Ontario employment was little changed for a third consecutive month in October 2026; the province's unemployment rate was 7.3%, against 6.7% for Canada.
In its March budget the province said global trade tensions and the associated uncertainty were the main risks to its outlook and modelled a slower-growth scenario in which the United States withdraws from the Canada-United States-Mexico Agreement.
The Bank of Canada's national business survey reports firms reducing investment in Canada or shifting it abroad to limit exposure to tariffs, especially in steel and autos.
The government's fall outlook of 29 October 2026 projects real GDP growth of 0.5 per cent in 2026, against 1.0 per cent in the March budget, and a 2026-27 deficit of 16.9 billion dollars, against 13.8 billion in March, with a return to a surplus of 0.2 billion dollars in 2029-30. The FAO's summer outlook projected 0.6 per cent growth in 2026, a deficit of 16.9 billion dollars and no balanced budget over its horizon, and explained its gap with the March budget by more current data showing a technical recession. These are the publishers' projections, not Northline's. The FAO's next outlook and Statistics Canada's quarterly population estimates (release calendar) show which view is closer.
How exposed is Ontario's public finance, investment programme and trade to the United States, and how does it differ from Quebec, Alberta and British Columbia?
Ontario closed 2025-26 with a deficit far larger than the year before, carries an AA-range credit rating, sells most of its goods exports to the United States, and is building transit and nuclear capacity while its population growth and housing market weaken
What happened
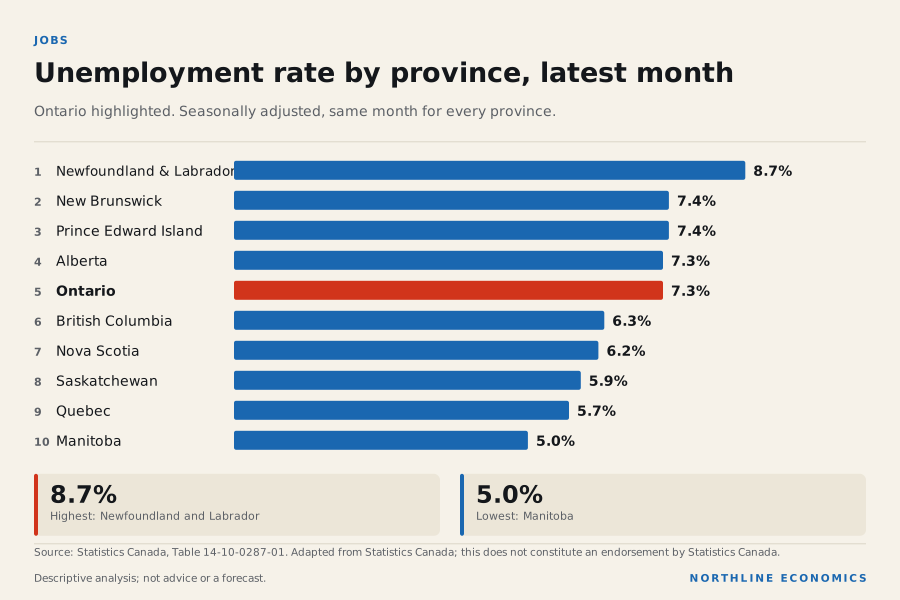
Ontario's unemployment rate was 7.3% in October 2026, joint 4th of 10 among the ten provinces (highest = 1), and the population was 0.3% higher than four quarters earlier.
Historical context
The Public Accounts say Ontario recorded a 13.0 billion dollar deficit for the year ended March 31, 2026, compared with a deficit of 1.1 billion dollars the year before, mainly because of higher program expenses and lower revenues.
Program expenses rose 4.7 per cent to 220.9 billion dollars, while total revenues of 223.3 billion dollars fell 0.7 per cent, a decline the report attributes largely to one-time revenue in 2024-25 from the tobacco legal settlement and lower broader-public-sector revenue.
The budget's revenue mix for 2026-27 has personal income tax at 65.1 billion dollars (28.1 per cent of revenue), sales tax at 39.9 billion, corporations tax at 28.6 billion and federal transfers at 39.8 billion.
In Finance Canada's 2026-27 Equalization table, Ontario's natural-resource fiscal capacity is 22 against 4,778 for Alberta, and Ontario's column shows an Equalization payment of 26 against 1,568 for Quebec. The page text does not state the table's units.
On debt, the budget forecasts interest and other debt servicing charges rising from 16.0 billion dollars in 2025-26 to 19.7 billion in 2028-29, and says Ontario has issued 160.8 billion dollars of bonds with maturities of 30 years or longer since 2010-11.
The Ontario Financing Authority lists the province's ratings as Moody's Aa3, Fitch AA-, Morningstar DBRS AA and S&P AA-, all with stable outlooks. These are the province's own listing, not the agencies' statements.
The budget says planned capital investment over ten years totals more than 210 billion dollars, including 37 billion in 2026-27, with about 63 billion for public transit.
The Public Accounts report that Ontario invested 25.6 billion dollars in government-owned assets in 2025-26 and that the net book value of tangible capital assets reached 194.5 billion dollars, up 9.4 per cent.
On transit the budget says the Eglinton Crosstown LRT opened in February 2026 with 19 kilometres of rapid transit, and that the Yonge North Subway Extension reached a request for qualifications for its five stations in October 2025.
Infrastructure Ontario's 2022 award page puts the Ontario Line's systems, trains and operations contract at 9 billion dollars (a 30-year design-build-finance-operate-maintain term); Metrolinx says tunnelling for the downtown segment began in April 2026. The sources cited give no current total cost or opening date.
The Major Projects Office says the first Darlington small modular reactor will cost 7.7 billion dollars including common infrastructure and the four units 20.9 billion, and that the Canada Growth Fund and Building Ontario Fund announced a combined 3 billion dollar equity commitment to finance the project.
The Major Projects Office describes the Crawford Nickel Project near Timmins as a proposed mine in the world's second-largest nickel reserve. The page lists agreements with First Nations and says the federal impact assessment phase began in March 2026.
The budget names Geraldton's Main Street rehabilitation as the gateway to the Ring of Fire; the sources cited give no project status for the Ring of Fire itself.
The Financial Accountability Office reported in April 2025 that the United States took 77 per cent of Ontario's goods exports in 2024 (220 billion dollars) and that 40 per cent of manufacturing production was shipped to the US.
The Prime Minister said in October 2026 that Ontario builds more than one million vehicles a year, that Canada's auto exports to the US have declined by more than 10 per cent, and announced a 9 billion dollar action plan. Two and a half billion is for auto assembly and over 5 billion for steel mills in Hamilton and Sault Ste. Marie.
The budget's slower-growth scenario assumes the US withdraws from CUSMA, with a 12 per cent tariff on Canada and Mexico and motor vehicle tariffs effectively at 12.5 per cent; its deficit then reaches 16.6 billion dollars in 2026-27.
Real output at basic prices in Ontario (chained 2017 dollars, Statistics Canada table 36-10-0711-01) was C$907.0 billion in 2025, a change of 24.5% over ten years. Over the same ten years goods-producing industries changed 6.3% and services-producing industries 30.3%; mining, quarrying and oil and gas changed 7.7%, manufacturing -1.1% and the public sector 21.0%. These are changes in real output, not in income or jobs, and the table gives no reason for the differences; the sourced paragraphs in this section and in the story give the explanations that named sources offer.
Real output by industry in Ontario, indexed
Real GDP at basic prices, chained 2017 dollars, annual (Statistics Canada table 36-10-0711-01); first year shown = 100. Goods and services against the total, with mining and oil and gas, manufacturing and the public sector. Chained-dollar levels are not additive, so only changes are compared.
Chart loads when it comes into view.
Latest values: All industries 907,000,000,000 (2025); Goods-producing industries 179,900,000,000 (2025); Services-producing industries 728,900,000,000 (2025); Mining, quarrying and oil and gas 8,301,000,000 (2025); and 2 more in the data table.
Labour productivity, meaning real value added per hour worked in chained 2017 dollars (Statistics Canada table 36-10-0713-01), was C$64.00 an hour in Ontario in 2025, ranking 5th of 10 (highest = 1), a change of 6.5% over ten years. In goods-producing industries it was C$63.10 an hour (a change of -3.4% over ten years) and in services-producing industries C$64.30 an hour (a change of 9.5%). A high level can reflect capital-intensive industries such as oil, gas and mining rather than the efficiency of the whole economy, and the table says nothing about why levels or changes differ.
Labour productivity in Ontario: goods and services
Real value added per hour worked, chained 2017 dollars, annual (Statistics Canada table 36-10-0713-01). Goods-producing industries include mining and oil and gas, so their level reflects capital-intensive resource extraction as well as manufacturing and construction.
The FAO says the annual unemployment rate rose to 7.7 per cent in 2025, the highest since 2012 excluding the pandemic, and projects employment growth of 0.2 per cent in 2026 as the labour market adjusts to trade pressures and fewer new immigrants and temporary residents.
Average hourly wages grew 3.2 per cent in the second quarter of 2026 to 38.49 dollars an hour, and the FAO says Ontario's CPI inflation averaged 2.0 per cent in the first half of 2026, the lowest among provinces, reflecting in part weaker economic growth. Hourly wages were C$38.96 an hour in October 2026.
The FAO attributes the first fall in Ontario's population on records back to 1951 to a significant outflow of non-permanent residents and fewer new permanent residents. Statistics Canada's current series, revised in September 2026, no longer shows a fall from a year earlier: the population was 0.3% higher over the four quarters to 1 July 2026.
CMHC says Ontario and British Columbia are likely to see the weakest housing-market growth because of slower population growth, affordability challenges and higher supply, with historically low construction most visible in condominiums.
Comparison with Quebec, Alberta and British Columbia
From 2019 to 2025, real GDP at market prices (2017 constant prices) changed 13.3% in Ontario, 11.8% in Quebec, 13.0% in Alberta and 18.2% in British Columbia. In October 2026 unemployment was 7.3% in Ontario, 5.7% in Quebec, 7.3% in Alberta and 6.3% in British Columbia. Average hourly wages were C$38.96 an hour in Ontario, C$39.00 an hour in Alberta, C$39.54 an hour in British Columbia and C$37.00 an hour in Quebec, and over the latest four quarters the population changed 0.3% in Ontario, 0.2% in Quebec, 1.5% in Alberta and 0.1% in British Columbia.
Historical context
Alberta differs on public finance because of resource revenue: its government's first-quarter forecast puts non-renewable resource revenue at 22,955 million dollars of 86,279 million in total revenue in 2026-27, more than a quarter.
Its first-quarter update moved the budget from a 9.4 billion dollar deficit to a 2 billion dollar surplus mainly on higher resource revenue, and puts net debt at 7.7 per cent of GDP at the end of 2026-27, against Ontario's 36.5 per cent at the end of 2025-26. Definitions differ.
Quebec's March budget, the previous government's, put its net debt at 38.8 per cent of GDP at March 31, 2026, close to Ontario's, and planned a return to balance by 2029-30. Quebec's Public Accounts for 2025-26 show an accounting deficit of 5.5 billion dollars, against the 7.7 billion the budget had estimated (Ontario's was larger, at 13.0 billion dollars by its Public Accounts); Quebec also says its real GDP per capita gap with Ontario narrowed from 15.9 per cent in 2018 to 10.2 per cent in 2024.
British Columbia says it is less exposed to US trade than other provinces, with nearly half of goods exports going to non-US destinations, whereas the FAO puts the US at 77 per cent of Ontario's goods exports.
BC's first-quarter report said its population fell 0.9 per cent in the year to April 2026, a sharp reversal in international migration, a pattern the FAO also reports for Ontario. Statistics Canada's current series shows both populations rising over those twelve months, British Columbia's from 5.688 million to 5.704 million.
Research desk reading, not tested: Ontario's higher unemployment than Quebec's is consistent with the sources' common thread of manufacturing tariff exposure and a fall in non-permanent residents; Alberta's stronger position is attributed by its government to commodity prices and by CMHC to resource-driven demand. No source here isolates the size of each cause.
What it influences
Historical context
The budget says each percentage point change in compensation-of-employees growth changes revenue by 786 million dollars, so slower growth in employee compensation would lower revenue and widen the deficit, other things being equal.
The March budget said global trade tensions and the upcoming review of CUSMA were the main risks to its outlook. At the review on 1 July 2026 the United States did not agree to renew the agreement, which stays in force with annual joint reviews.
The province's Economic Outlook and Fiscal Review of 29 October 2026 projects a deficit of 16.9 billion dollars in 2026-27, against 13.8 billion in the March budget, and moves the return to surplus from 2028-29 to 2029-30.
The FAO projects 16.9 billion dollars and no balanced budget over its horizon. These are the publishers' projections, not Northline's. The province's next budget, the next Statistics Canada population release and the annual CUSMA joint reviews will show which is closer.
Ontario's unemployment rate was 7.3% in October 2026, its prices were up 2.5% in the year to September 2026 and its government's net operating balance on Statistics Canada's basis was -8.2% of revenue in the fiscal year that began in April 2024, far larger than the deficit in the province's own audited accounts
Ontario against the other nine
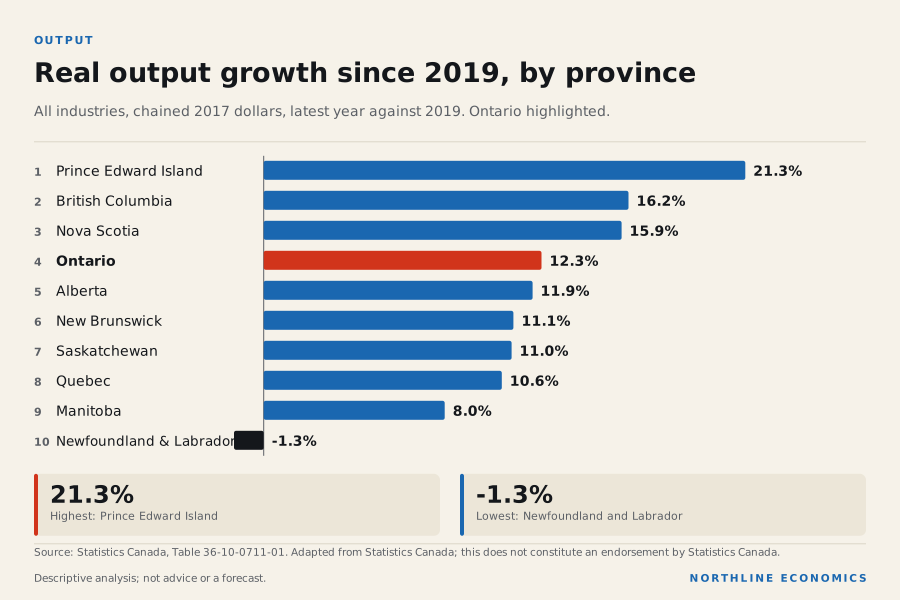
Ontario is the largest provincial economy, and on most measures here it sits close to the middle of the table. Its unemployment rate of 7.3% in October 2026 is level with Alberta as the fourth highest of the ten provinces, behind Newfoundland and Labrador, New Brunswick and Prince Edward Island, and it is lower than the 7.6% of a year earlier. Real output across all industries is 12.3% above 2019, which is fourth, behind Prince Edward Island, British Columbia and Nova Scotia.
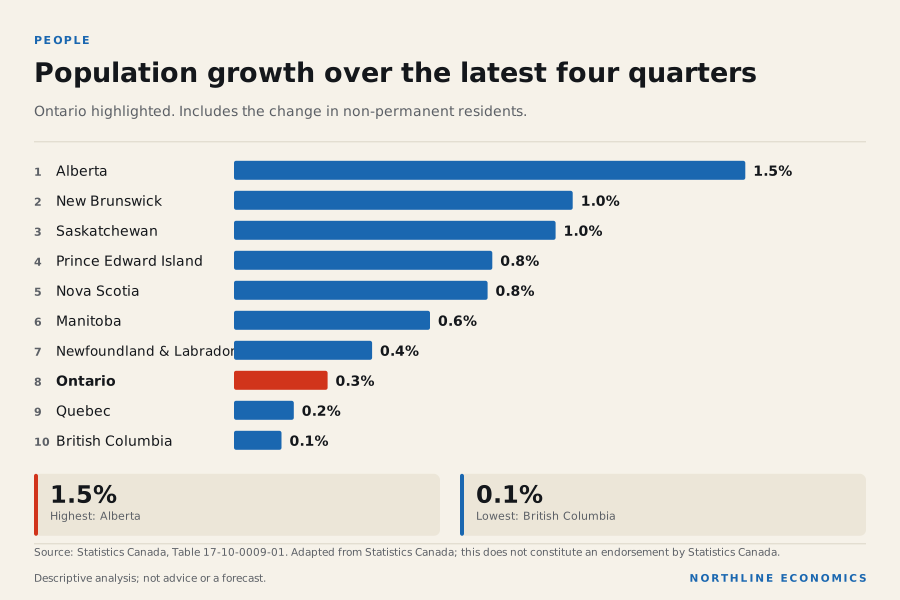
Where Ontario falls furthest down the table is population. The province grew 0.3% over the latest four quarters, eighth of ten and below the national 0.5%, and the number of non-permanent residents changed by -86 thousand over the same four quarters. Net movement to and from other provinces was -18 thousand persons. A province whose economy is measured in output per person can look healthy while its total market for housing, retail and services stops expanding; the next two sections show where that matters.
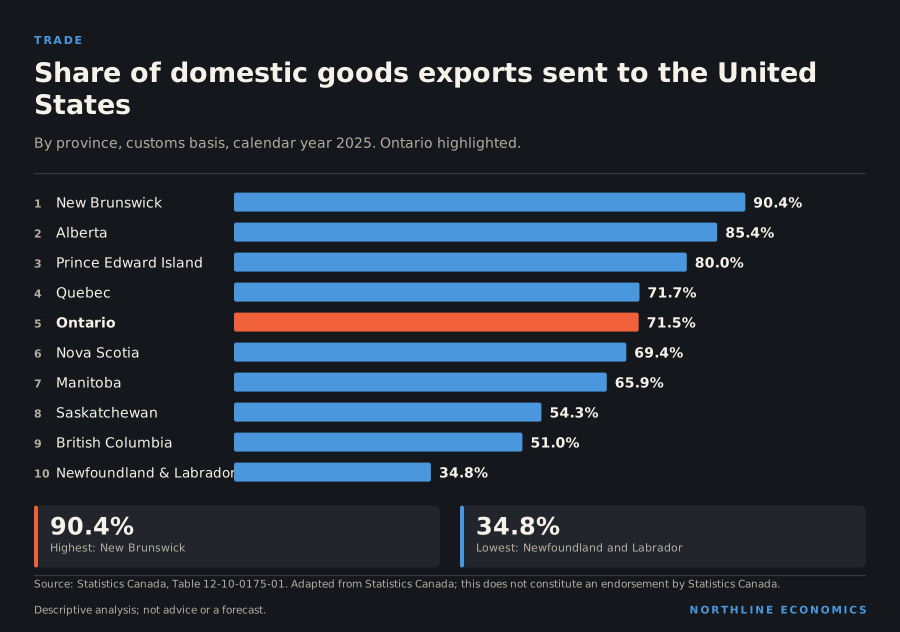
Manufacturing is 10.0% of Ontario's jobs, second only to Quebec's 10.8%, and the province's goods exports of C$266.0 billion in 2025 were the largest of any province. 72% of them went to the United States. That is no more than Quebec's 72% and well below Alberta's 85% and New Brunswick's 90%, but Ontario's goods are mostly manufactured, so the exposure is to the price and the rules on factory output, not on commodities.
The data behind this graphic
Share of domestic goods exports sent to the United States
The output numbers show the strain without explaining it. Real manufacturing output in 2025 was C$89.5 billion, against C$94.6 billion in 2019, a change of -5.5%, the seventh best of ten provinces. Over the same years real output of all industries rose 12.3%, from C$807.6 billion to C$907.0 billion. The province grew, and its factory sector did not. Monthly manufacturing sales were 7.8% higher in August 2026 than a year earlier, in current dollars, so the recent record is not simply a story of decline; sales in dollars include price changes and cannot be compared directly with real output.
Historical context
The Financial Accountability Office of Ontario and the provincial budget attribute the slowdown to US tariffs, falling residential investment and a smaller population; the companion story, Ontario: tariffs on manufacturing, a stalled population and two views of the outlook, sets those explanations out with their sources. The series here describe what happened and where Ontario ranks. They cannot show how much of the change was caused by tariffs rather than by the end of the post-pandemic vehicle-supply recovery, exchange rates or weaker US demand.
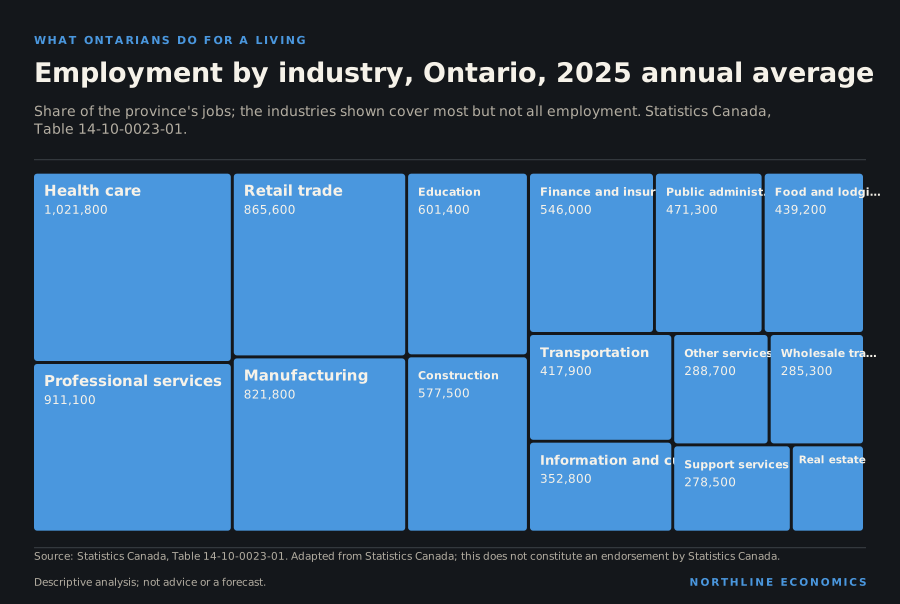
For a business in Ontario the picture is one of a large, diversified market that has almost stopped adding customers. Health care, retail, professional services and manufacturing together account for about four in ten of the province's jobs, so no one industry decides the local outlook; what changes is the mix of demand. Firms that sell to households are working with a population that grew 0.3% over the latest four quarters, not the 0.5% national rate, and firms that sell to US customers are exposed to one policy decision they cannot influence.
What the data cannot say: they do not show which Ontario regions are affected most, they say nothing about the quality or pay of the jobs counted, and they do not forecast. The historical comparison with the other nine provinces is complete and on the same definitions; any statement about what comes next belongs to the sources the story cites, and to the Financial Accountability Office and the Ministry of Finance, who do not agree.
Labour market and prices
The unemployment rate was 7.3% in October 2026, ranking joint 4th of 10 among the ten provinces (1st = highest). Employment changed by 0.3% over the year and the participation rate was 64.6%. Average weekly earnings were C$1,394 a week in August 2026, ranking 2nd of 10. Consumer prices were up 2.5% in September 2026 on a year earlier, ranking 10th of 10.
Unemployment rate by province
Percent, seasonally adjusted, monthly. Province series, Labour Force Survey.
Chart loads when it comes into view.
Latest values: Ontario 7.3 (2026-10); British Columbia 6.3 (2026-10); Alberta 7.3 (2026-10); Saskatchewan 5.9 (2026-10); and 6 more in the data table.
The population was 0.3% higher than four quarters earlier. Net interprovincial migration over the latest four quarters was -18 thousand persons (negative = net outflow), and non-permanent residents changed by -86 thousand. Real output across all industries changed 12.3% between 2019 and 2025. Retail sales in August 2026 were 6.4% higher than a year earlier.
Population by province, indexed
Quarterly estimates; start of period = 100.
Chart loads when it comes into view.
Latest values: Ontario 16,260,000 (2026 Q3); British Columbia 5,711,000 (2026 Q3); Alberta 5,101,000 (2026 Q3); Saskatchewan 1,278,000 (2026 Q3); and 6 more in the data table.
Annual, 2017 constant prices (not chained); start of the period = 100. Expenditure-based.
Chart loads when it comes into view.
Latest values: Ontario 985,200,000,000 (2025); British Columbia 356,100,000,000 (2025); Alberta 382,600,000,000 (2025); Saskatchewan 90,590,000,000 (2025); and 6 more in the data table.
Economic structure and trade exposure
In 2025 (the year of the table's latest annual average), health care and social assistance employed 12.4% of Ontario's workers, retail trade 10.5%, construction 7.0% and public administration 5.7%. Among goods-producing groups, agriculture 0.8%; forestry, fishing, mining, quarrying, oil and gas 0.5%; and manufacturing 10.0%. Finance and insurance employed 6.6% and professional, scientific and technical services 11.1%.
How much of each province’s employment is in one industry
Share of provincial employment, 2025 annual average (Labour Force Survey). A measured exposure to an industry, not an estimate of how much output or income depends on it. “Resources” combines forestry, fishing, mining, quarrying and oil and gas.
Chart loads when it comes into view.
Top values: Newfoundland and Labrador 6.37%; Alberta 5.58%; Saskatchewan 3.76%.
Domestic merchandise exports were C$266.0 billion in calendar year 2025. 72% went to the United States and energy products were 1% of the total; energy products sent to the United States were 1% of all the province's domestic exports. These are customs-basis goods exports assigned to the province of origin as Statistics Canada defines it; they exclude services, which are a large part of some provincial economies, and the province of export clearance can differ from the province of production for some commodities.
Where each province’s goods exports go, and what they are, 2025
Share of each province’s domestic merchandise exports (customs basis). A measured exposure of export value to one market or one commodity group, not an estimate of how much income or employment depends on it.
Chart loads when it comes into view.
Top values: New Brunswick 90.4%; Alberta 85.43%; Prince Edward Island 80.05%.
Employment shares and export shares describe the structure of the economy; they do not by themselves show which industries drive growth, incomes or public revenue, or how exposed the province is to a given shock.
Long-run perspective
Population is 85.4% higher on 1 July 2026 than on 1 January 1981, against 69.5% for Canada as a whole. Real GDP (at 2017 constant prices) is 193.0% higher in 2025 than in 1981; this is a level comparison between two years, not an average annual rate, and it is not compared with a national figure here because the national real GDP series is monthly and on a different basis.
Employment is 68.2% higher in October 2026 than in June 1993, the start of the national series used here (65.1% for Canada). Over the past forty years the unemployment rate has ranged from 4.7% (June 1989) to 14.2% (May 2020); it was 7.3% in October 2026, against 6.7% for Canada.
Employment by province, indexed
Seasonally adjusted; start of period = 100.
Chart loads when it comes into view.
Latest values: Ontario 8,278,000 (2026-10); British Columbia 2,941,000 (2026-10); Alberta 2,660,000 (2026-10); Saskatchewan 624,600 (2026-10); and 6 more in the data table.
Average weekly earnings, in current dollars and not seasonally adjusted, are 101.8% higher in August 2026 than in the same month twenty-five years earlier (106.8% for Canada). These are nominal figures: they include the effect of price increases over twenty-five years and are not a measure of the change in purchasing power.
These comparisons describe the size of changes between two dates. They do not say why this jurisdiction differs from Canada, and the end points can matter: a different starting year changes the percentage.
Public finances
In Statistics Canada's government finance statistics for the fiscal year that began in April 2024, the provincial government's revenue was C$205.5 billion and its expense C$222.4 billion, leaving a net operating balance of -C$16.9 billion (-8.2% of revenue). Grants received from other governments (mostly federal transfers; the table does not split them by payer) were C$35.8 billion, 17.4% of revenue. Liabilities at the end of the year were C$492.0 billion and net worth -C$222.0 billion. These are past-year accounts, not the current budget.
Historical context
The province's own audited accounts, on a different basis, show a much smaller deficit for the same year: 1.1 billion dollars for the year ended March 31, 2025, before a deficit of 13.0 billion dollars in the year ended March 31, 2026.
Ontario's metropolitan areas are covered on their own pages: Toronto, Ottawa–Gatineau (Ontario part), Hamilton, Kitchener–Cambridge–Waterloo and London. Metropolitan figures are never substituted for provincial ones.
What is not assessed
Why these figures differ from other provinces, industry structure beyond the latest employment shares, housing prices and rents, exports by destination over time, the current budget and credit ratings, major projects, and policy changes. The sources on Ontario's slowdown are set out in the companion story, and nothing here is a forecast.
1 · Where it ranks
Ontario among the ten provinces
Same values as the Canada atlas layers. Rank 1 is the highest value, which is not always the most favourable outcome. A measure the source does not publish for a place is simply absent.
Latest values: Ontario 8,278,000 (2026-10); British Columbia 2,941,000 (2026-10); Alberta 2,660,000 (2026-10); Saskatchewan 624,600 (2026-10); and 6 more in the data table.
Current dollars per hour, all industries, employees aged 15 and over, not seasonally adjusted.
Chart loads when it comes into view.
Latest values: Ontario 38.96 (2026-10); British Columbia 39.54 (2026-10); Alberta 39 (2026-10); Saskatchewan 34.21 (2026-10); and 6 more in the data table.
Average weekly earnings by province
Current dollars per week, industrial aggregate incl. overtime, not seasonally adjusted.
Chart loads when it comes into view.
Latest values: Ontario 1,394 (2026-08); British Columbia 1,366 (2026-08); Alberta 1,410 (2026-08); Saskatchewan 1,303 (2026-08); and 6 more in the data table.
3 · Prices
Inflation
12-month change in the all-items CPI, derived by this project from the index.
Consumer price inflation by province
12-month change in the all-items CPI (derived by this project from the index).
Chart loads when it comes into view.
Latest values: Ontario 2.53 (2026-09); British Columbia 2.96 (2026-09); Alberta 3.6 (2026-09); Saskatchewan 3.3 (2026-09); and 6 more in the data table.
Quarterly population estimates and four-quarter migration flows.
Population by province, indexed
Quarterly estimates; start of period = 100.
Chart loads when it comes into view.
Latest values: Ontario 16,260,000 (2026 Q3); British Columbia 5,711,000 (2026 Q3); Alberta 5,101,000 (2026 Q3); Saskatchewan 1,278,000 (2026 Q3); and 6 more in the data table.
New permanent residents arriving over the previous four quarters.
Chart loads when it comes into view.
Latest values: Ontario 156,500 (2026 Q2); British Columbia 45,800 (2026 Q2); Alberta 50,160 (2026 Q2); Saskatchewan 14,390 (2026 Q2); and 6 more in the data table.
Net interprovincial migration (4-quarter total)
In-migrants minus out-migrants over the previous four quarters (derived).
Chart loads when it comes into view.
Latest values: Ontario 77,520 (2026 Q2); British Columbia 58,490 (2026 Q2); Alberta 78,320 (2026 Q2); Saskatchewan 18,270 (2026 Q2); and 6 more in the data table.
Annual real GDP and monthly activity indicators, indexed so the start of the period equals 100 where noted.
Real GDP by province, indexed
Annual, 2017 constant prices (not chained); start of the period = 100. Expenditure-based.
Chart loads when it comes into view.
Latest values: Ontario 985,200,000,000 (2025); British Columbia 356,100,000,000 (2025); Alberta 382,600,000,000 (2025); Saskatchewan 90,590,000,000 (2025); and 6 more in the data table.
Retail sales by province, indexed
Seasonally adjusted; start of period = 100.
Chart loads when it comes into view.
Latest values: Ontario 28,540,000,000 (2026-08); British Columbia 9,970,000,000 (2026-08); Alberta 9,649,000,000 (2026-08); Saskatchewan 2,315,000,000 (2026-08); and 6 more in the data table.
Manufacturing sales by province, indexed
Seasonally adjusted shipments; start of period = 100.
Chart loads when it comes into view.
Latest values: Ontario 32,940,000,000 (2026-08); British Columbia 6,093,000,000 (2026-08); Alberta 10,510,000,000 (2026-08); Saskatchewan 2,300,000,000 (2026-08); and 6 more in the data table.
Investment in new building construction by province, indexed
Current dollars, not seasonally adjusted, 12-month sum; start of the period = 100.
Chart loads when it comes into view.
Latest values: Ontario 47,830,000,000 (2026-08); British Columbia 26,550,000,000 (2026-08); Alberta 21,980,000,000 (2026-08); Saskatchewan 3,138,000,000 (2026-08); and 6 more in the data table.
Housing starts by province (12-month average)
Seasonally adjusted annual rate, averaged over 12 months (smoothed); units per year. CMHC data distributed by Statistics Canada.
Chart loads when it comes into view.
Latest values: Ontario 62,390 (2026-09); British Columbia 43,320 (2026-09); Alberta 49,530 (2026-09); Saskatchewan 6,443 (2026-09); and 6 more in the data table.
Latest shares only. A measured exposure, not an estimate of how much output or income depends on an industry.
Industry
Share of provincial employment
Period
Health care and social assistance
12.4%
2025
Professional, scientific and technical services
11.1%
2025
Manufacturing
10.0%
2025
Finance, insurance, real estate, rental and leasing
8.7%
2025
Construction
7.0%
2025
Transportation and warehousing
5.1%
2025
Agriculture
0.8%
2025
Forestry, fishing, mining, quarrying, oil and gas
0.5%
2025
Real output by industry in Ontario, indexed
Real GDP at basic prices, chained 2017 dollars, annual (Statistics Canada table 36-10-0711-01); first year shown = 100. Goods and services against the total, with mining and oil and gas, manufacturing and the public sector. Chained-dollar levels are not additive, so only changes are compared.
Chart loads when it comes into view.
Latest values: All industries 907,000,000,000 (2025); Goods-producing industries 179,900,000,000 (2025); Services-producing industries 728,900,000,000 (2025); Mining, quarrying and oil and gas 8,301,000,000 (2025); and 2 more in the data table.
Labour productivity by province
Real value added per hour worked, all industries, chained 2017 dollars (Statistics Canada table 36-10-0713-01), annual. A level, not an index: it compares output per hour across provinces, and is high where capital-intensive industries such as oil and gas or mining weigh heavily in the economy.
Chart loads when it comes into view.
Latest values: Ontario 64 (2025); Newfoundland and Labrador 72 (2025); Prince Edward Island 47.6 (2025); Nova Scotia 52.3 (2025); and 6 more in the data table.
Labour productivity in Ontario: goods and services
Real value added per hour worked, chained 2017 dollars, annual (Statistics Canada table 36-10-0713-01). Goods-producing industries include mining and oil and gas, so their level reflects capital-intensive resource extraction as well as manufacturing and construction.
Change in real output by industry in each province, 2015 to 2025
Percent change in real GDP at basic prices (chained 2017 dollars, annual) over ten years. Each industry is compared with itself; chained-dollar levels are not additive, so shares of the total are not shown. A measure of the change in output, not of income or employment.
Chart loads when it comes into view.
Top values: Prince Edward Island 38.2%; British Columbia 32.5%; Nova Scotia 26.3%.
How much of each province’s employment is in one industry
Share of provincial employment, 2025 annual average (Labour Force Survey). A measured exposure to an industry, not an estimate of how much output or income depends on it. “Resources” combines forestry, fishing, mining, quarrying and oil and gas.
Chart loads when it comes into view.
Top values: Newfoundland and Labrador 6.37%; Alberta 5.58%; Saskatchewan 3.76%.
Where each province’s goods exports go, and what they are, 2025
Share of each province’s domestic merchandise exports (customs basis). A measured exposure of export value to one market or one commodity group, not an estimate of how much income or employment depends on it.
Chart loads when it comes into view.
Top values: New Brunswick 90.4%; Alberta 85.43%; Prince Edward Island 80.05%.
7 · Cities
Metropolitan areas in Ontario
City pages use metropolitan data; this province page must not be read as any of them.
From the relationship graph, each with its evidence class.
Toronto is a census metropolitan area located in Ontario (Statistics Canada Standard Geographical Classification). institutional relationshipdetails
Ottawa–Gatineau is a census metropolitan area located in Ontario (Statistics Canada Standard Geographical Classification). institutional relationshipdetails
Ontario is a province of Canada. institutional relationshipdetails
71.55% of Ontario's domestic merchandise exports went to the United States in 2025 (customs basis). documented exposuredetails
The provincial or territorial government's accounts
Statistics Canada government finance statistics (public-accounts basis), fiscal years ended 31 March. Annual, and about two years behind: past position, not this year's budget.
Measure
Latest
Fiscal year beginning in April
Year before
Revenue
C$205.5 billion
2024
C$193.1 billion
Grants received from other governments (part of revenue)
C$35.8 billion
2024
C$35.0 billion
Expense
C$222.4 billion
2024
C$210.0 billion
Net operating balance (revenue minus expense)
−C$16.9 billion
2024
−C$16.9 billion
Liabilities (end of fiscal year)
C$492.0 billion
2024
C$460.2 billion
Net worth (end of fiscal year; negative = liabilities exceed assets)
−C$222.0 billion
2024
−C$204.0 billion
Computed: grants from other governments were 17.4% of revenue in the fiscal year that began in April 2024; the table does not say which government paid them, and most are federal transfers. Compare on the atlas →
Computed: the net operating balance was -8.2% of revenue in the fiscal year that began in April 2024. Compare on the atlas →
10 · Not assessed
What this profile does not cover
Listed so that silence is not mistaken for absence of an issue.
The current budget, credit ratings and fiscal plan (only past fiscal years are held)
Housing prices and rents
Employment by industry over time (only the latest provincial shares are held)
Exports by destination over time (only the latest year is held)