Research · Alberta · Saskatchewan
Where the money comes from is not where the jobs are: Alberta’s energy paradox
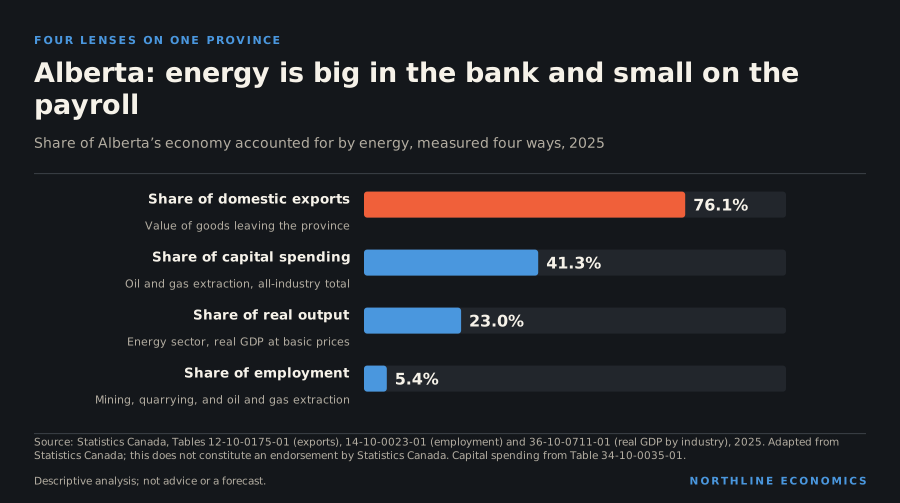
In 2025 energy was most of what Alberta sold abroad, more than a fifth of its output and two-fifths of its capital spending, but the industry’s own payroll was a small share of its jobs. Four ways of asking the same question give four very different answers.
By Northline research deskUpdated 2026-11-0611 min readData to 2026
The data behind this graphic
| Item | Value |
|---|---|
| Share of domestic exports | 76.1% |
| Share of capital spending | 41.3% |
| Share of real output | 23.0% |
| Share of employment | 5.4% |
Summary
Ask what Alberta’s economy runs on and most people say oil. The export data agree: energy was 76.1% of the province’s domestic merchandise exports in 2025. Ask how many Albertans work in oil and gas, and the answer is much smaller: mining, quarrying, and oil and gas extraction employed 5.4% of the province’s workers.
Both numbers are true. They measure different things, and understanding why is a guide to reading any regional economy. This note sets four measures side by side, for Alberta and for the other provinces: exports, output, investment and employment.
Four lenses on one economy
An economy can be described by what it sells, what it produces, what it invests and whom it employs. For energy in Alberta these give very different answers.
Energy accounted for 76.1% of exports, 23.0% of real output, 41.3% of capital spending (oil and gas extraction alone) and 5.4% of employment. Each figure is correct for what it measures. The gap between them is the finding.
The measures are not defined identically. Exports count energy products, which include refined and processed goods. Output is for the energy sector as Statistics Canada defines it, which is broader than extraction. Capital spending is for oil and gas extraction only. Employment is for mining, quarrying, and oil and gas extraction, a grouping that includes some mining that is not energy. The comparison is therefore one of scale, and no pair of these figures should be subtracted.
An export share and an employment share ask different questions of the same industry. The first asks how much of what the province sells abroad comes from it. The second asks how many of the province’s workers are in it. Neither is wrong, and neither alone says how much of the province depends on energy.
A likely reason: capital, not labour
One likely reason for the gap is that energy extraction is capital-intensive: it needs a great deal of equipment for each person it employs. Output per worker is consistent with that but does not measure capital.
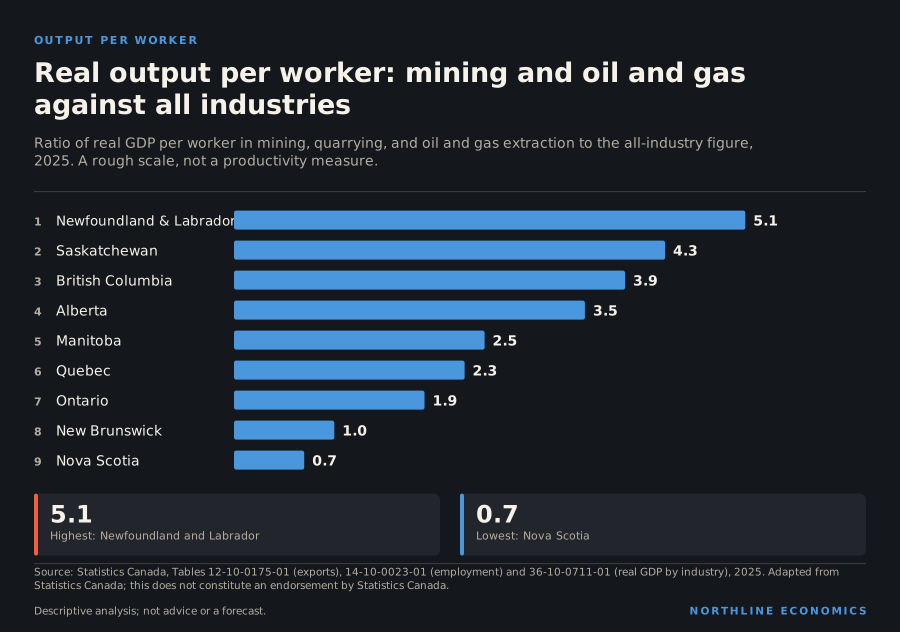
Dividing real output in mining and oil and gas extraction by the number of workers in that grouping gives a figure about 3.5 times the figure for all industries in Alberta, about 4.3 times in Saskatchewan and about 5.1 times in Newfoundland and Labrador.
The data behind this graphic
| Item | Value |
|---|---|
| Newfoundland and Labrador | 5.1 |
| Saskatchewan | 4.3 |
| British Columbia | 3.9 |
| Alberta | 3.5 |
| Manitoba | 2.5 |
| Quebec | 2.3 |
| Ontario | 1.9 |
| New Brunswick | 1.0 |
| Nova Scotia | 0.7 |
This is a rough scale and not a productivity measure. Output and employment come from different Statistics Canada sources, and a province’s mining grouping contains different commodities. Quebec’s ratio is 2.3 and Ontario’s 1.9. New Brunswick’s is about 1.0 and Nova Scotia’s 0.7.
The pattern is consistent with a capital-intensive industry in the energy provinces. The figures for the other provinces depend on what their mining workforce mines, and the data here do not say. What the figure supports is the direction: where energy is large, each worker in it accounts for several times the output of the average worker.
The data behind this graphic
| Step | What happens |
|---|---|
| Capital does the work | Wells, plants and pipelines are costly, and each worker operates a great deal of equipment. |
| High output, few jobs | A small workforce produces a large share of exports and output. |
| Jobs show up elsewhere | Construction, transport, engineering and trades supply the industry but are counted in other lines. |
| Prices set the pace | Capital spending has moved with the oil price in most years, so jobs in the supply chain may rise and fall with it. |
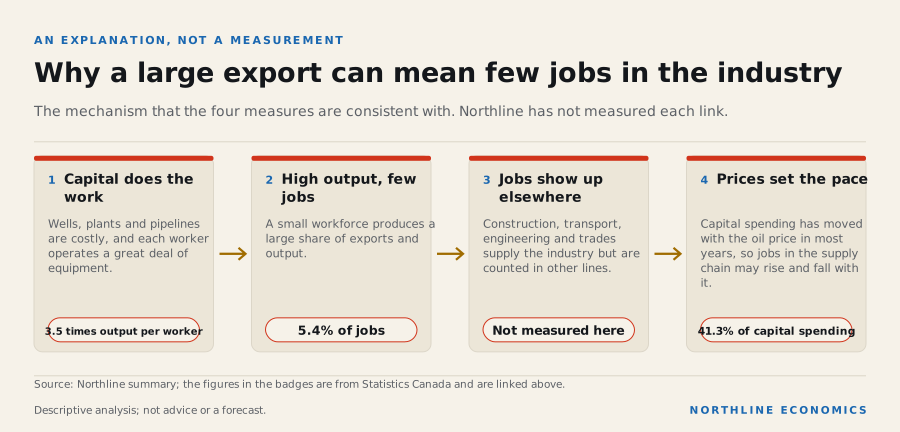
The chain above is an explanation consistent with the four measures, not a measurement of each link. It also shows what the employment figure leaves out.
Nine provinces, two shares
The data behind this graphic
| Item | Share of exports | Share of jobs |
|---|---|---|
| Newfoundland and Labrador | 53.6% | 4.9% |
| Nova Scotia | 0.8% | 0.5% |
| New Brunswick | 38.1% | 0.7% |
| Quebec | 4.0% | 0.6% |
| Ontario | 1.2% | 0.5% |
| Manitoba | 5.7% | 0.8% |
| Saskatchewan | 32.7% | 3.6% |
| Alberta | 76.1% | 5.4% |
| British Columbia | 30.1% | 0.9% |
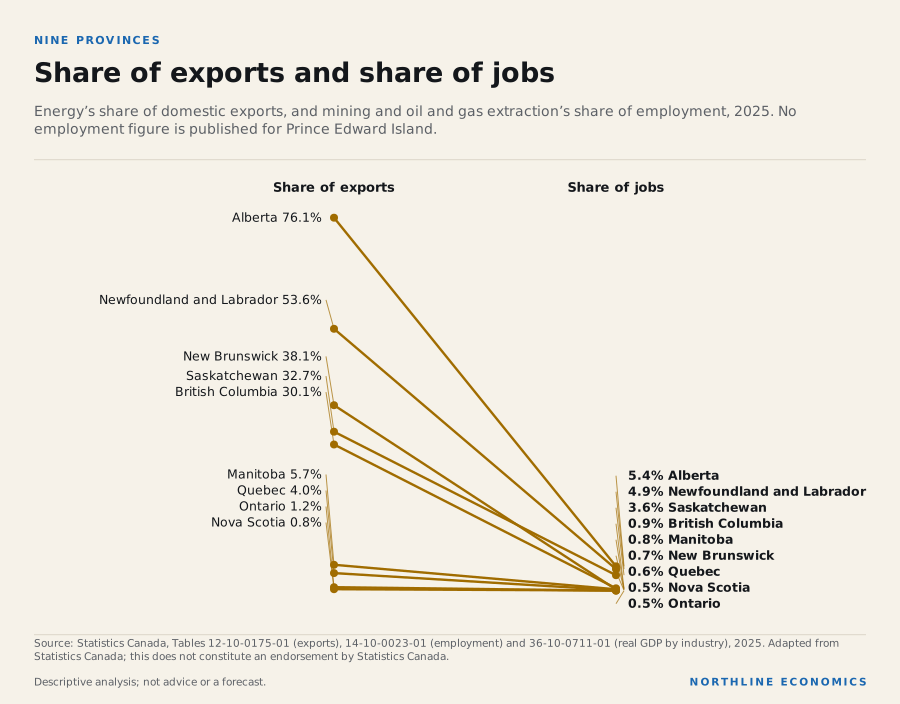
The slope chart pairs each province’s energy share of exports with its mining and oil and gas share of jobs. In every province the line falls: the share of jobs is lower than the share of exports. What differs is the size of the drop. Alberta’s export share is 76.1% and its job share 5.4%. Newfoundland and Labrador’s export share is 53.6% against a job share of 4.9%. New Brunswick’s export share is 38.1% and its job share 0.7%. Saskatchewan’s are 32.7% and 3.6%. British Columbia’s are 30.1% and 0.9%.
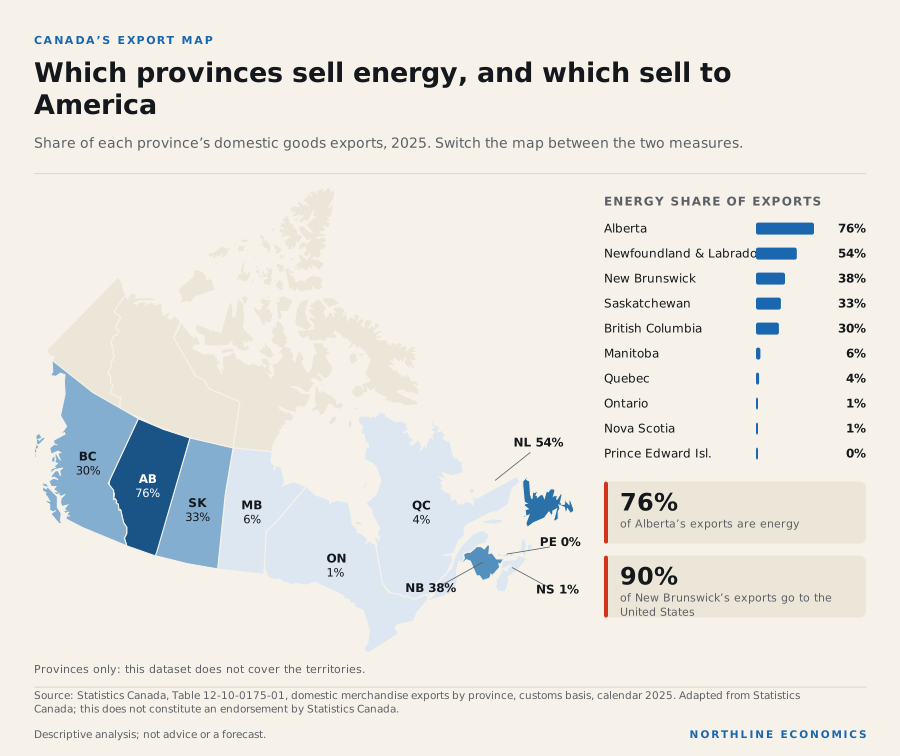
New Brunswick is the counterintuitive case. More than a third of its exports are energy products, yet very little of its employment is in extraction.
A likely reason is that much of what leaves the province is refined fuel. The Canada Energy Regulator reports that New Brunswick has Canada’s largest refinery, that most of the crude it uses comes from non-Canadian sources, and that surplus refined products are sold to the United States East Coast and neighbouring Atlantic provinces. The export is counted where the fuel is shipped from and the extraction jobs are counted where the oil is produced. The export data used here do not break energy products into crude and refined, so this is an interpretation. The same distinction applies in any province that refines or processes what it ships.
Evidence: Canada Energy Regulator: Provincial and Territorial Energy Profiles: New Brunswick
The data behind this graphic
| Item | Value |
|---|---|
| Alberta | 23.0% |
| Newfoundland and Labrador | 19.1% |
| Saskatchewan | 15.8% |
| British Columbia | 5.4% |
| New Brunswick | 4.9% |
| Manitoba | 4.5% |
| Quebec | 3.0% |
| Ontario | 2.2% |
| Nova Scotia | 1.8% |
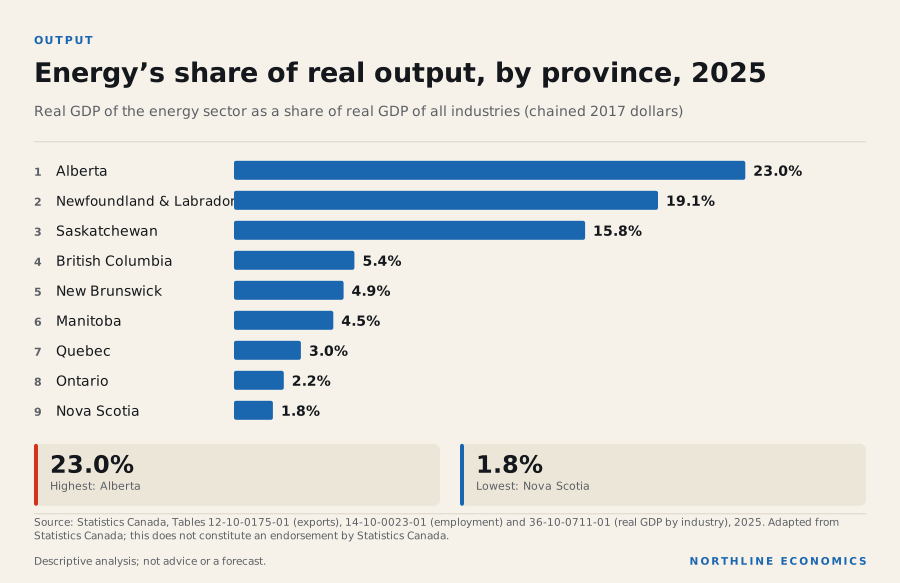
Energy’s share of real output tells a third story. In Alberta it was 23.0%, in Newfoundland and Labrador 19.1% and in Saskatchewan 15.8%. In the other provinces it was in single digits, including British Columbia, at 5.4%, and Ontario, at 2.2%. The energy sector as Statistics Canada defines it for output is broader than extraction, so a province’s share can include activity that is not oil and gas; Northline has not checked the exact composition for each province.
What a swing in prices does
The data behind this graphic
| Panel | Shows |
|---|---|
| Real GDP, energy sector | timeline |
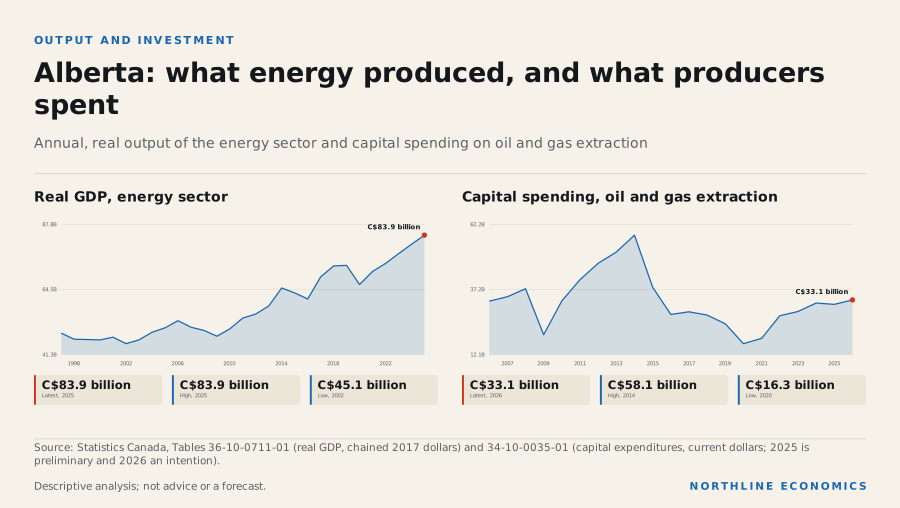
| Capital spending, oil and gas extraction | timeline |
The two charts show that output and investment in Alberta usually change in the same direction from year to year, but capital spending swings far more. Real output of the energy sector fell in each year from 2007 to 2009, dipped in 2015 and 2016 and again in 2020, and by 2025 was at C$83.9 billion, higher than at any earlier point in the series. Capital spending was C$58.1 billion in 2014, fell to C$27.5 billion in 2016 and to C$16.3 billion in 2020, and was C$31.4 billion in 2025: a partial recovery, not a return to the 2014 level, in current dollars that are worth less now. The 2025 capital figure is preliminary, and the 2026 figure at the end of the chart is an intention, not a final amount.
This is the economic content of the paradox. The jobs and revenue that depend on energy include a large, variable component, capital spending, which has moved with the oil price in most years, and a smaller, more stable one, the operating workforce. A province whose exports are dominated by energy is exposed to prices through its exports, through its investment and through its public revenue, but only partly through the headline employment in the industry.
Where Albertans work
The data behind this graphic
| Item | Value |
|---|---|
| Health care and social assistance | 13.1% |
| Retail trade | 10.2% |
| Construction | 10.0% |
| Professional, scientific and technical | 9.5% |
| Educational services | 6.8% |
| Accommodation and food | 6.0% |
| Transportation and warehousing | 5.9% |
| Manufacturing | 5.8% |
| Mining and oil and gas extraction | 5.4% |
| Public administration | 5.1% |
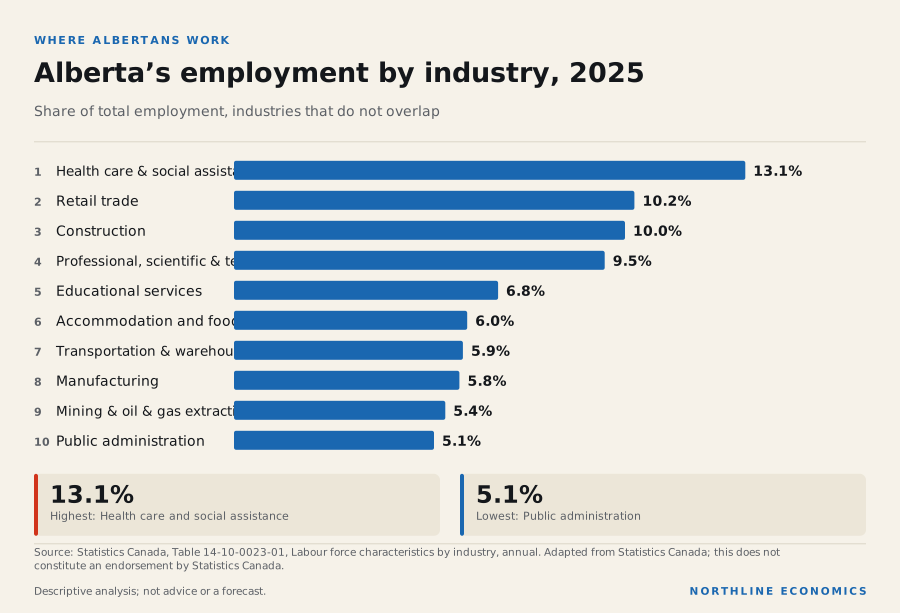
For perspective, the largest employers in Alberta are not extraction. Health care and social assistance employed 13.1% of workers, retail trade 10.2% and construction 10.0%. Mining and oil and gas extraction employed 5.4%.
The groups overlap with energy in ways the table cannot show. Some construction is the building of plants and pipelines. Some professional, scientific and technical employment is the engineering and geoscience that serves the industry. Some transportation is trucking and rail. The data do not say how many jobs these are, and Northline does not estimate it. Any figure for the “total” number of jobs that depend on energy would require an input-output model that is not used here.
Three things that look wrong and are not
A small employment share does not mean a small dependence. The dependence can run through exports, investment and public revenue as well as through the industry’s own payroll.
Evidence: Government of Alberta (Treasury Board and Finance): 2025-26 Final Results: Year-End Report
A large export share does not mean a large energy economy in every province. New Brunswick exports refined fuel, made mostly from crude that comes from outside Canada, and its extraction employment is small.
Evidence: Canada Energy Regulator: Provincial and Territorial Energy Profiles: New Brunswick
A high output per worker is not a high wage. The ratio compares production with headcount and says nothing about pay.
What this means for decisions
For provincial finance and economic development, the four measures suggest tracking energy through exports, output and investment as well as jobs.
For workers and households, the employment figure is only the industry’s own payroll. Its effects on other jobs, housing and local spending arrive indirectly, and may be larger in the cities and towns whose businesses supply the industry; these provincial figures cannot show that.
For investors and businesses, the comparison is a warning against reading any one share as a measure of dependence. This note does not offer investment advice.
What this does not show
Employment shares count workers in the industry itself and not jobs elsewhere that depend on it. Export shares are customs-basis goods. Output shares use chained dollars, which are approximate when summed or divided across industries. The measures cover different definitions of the energy industry, and no pair should be subtracted. Prince Edward Island has no published employment figure for mining and oil and gas. The ratio of output per worker joins two surveys and is not a productivity measure. The note does not explain why a province’s energy exports changed in any year.
Where to read next
Canada’s export map shows where energy and other exports go from every province. Three ways to grow or shrink shows how Alberta’s growth has drawn on migration from other provinces. Ten provincial labour markets sets Alberta’s labour market beside the other provinces.
Method
Export shares are energy exports divided by domestic exports, calendar 2025 (Statistics Canada table 12-10-0175-01). Employment shares are employment in mining, quarrying, and oil and gas extraction divided by total employment, annual 2025 (table 14-10-0023-01). Output shares are the real GDP of the energy sector divided by the real GDP of all industries, in chained 2017 dollars, 2025 (table 36-10-0711-01). The capital share is oil and gas extraction capital expenditure divided by all-industry capital expenditure for Alberta, 2025, a preliminary figure (table 34-10-0035-01). Derived by Northline from these tables. Source: Adapted from Statistics Canada. This does not constitute an endorsement by Statistics Canada.
Keep exploring
- Compare these places
- Canada’s export map: which provinces sell energy, and which sell to America
- Three ways to grow or shrink: the flows behind each province’s population
- Explore the related relationships
Related research
Sources, method and limits
- Limitations
- Employment shares are for the industry grouping that Statistics Canada publishes and count workers in the industry itself, not jobs elsewhere that depend on it. Export shares are customs-basis goods. The datasets cover different things and are compared only as shares. Prince Edward Island has no published value for mining and oil and gas.
- Preparation
- Prepared by the Northline research desk with AI assistance; every figure is read from the data library or a cited source at build time.
Data
- Gross domestic product (GDP) at basic prices, by industry, provinces and territories (36-10-0711-01; 1 series; latest 2025; retrieved 2026-11-07). Adapted from Statistics Canada, Gross domestic product (GDP) at basic prices, by industry, provinces and territories, Table 36-10-0711-01. This does not constitute an endorsement by Statistics Canada.
- Capital and repair expenditures, non-residential tangible assets, by industry and geography (34-10-0035-01; 1 series; latest 2026; retrieved 2026-10-30). Adapted from Statistics Canada, Capital and repair expenditures, non-residential tangible assets, by industry and geography, Table 34-10-0035-01. This does not constitute an endorsement by Statistics Canada.
Documents
- Canada Energy Regulator: Provincial and Territorial Energy Profiles: New Brunswick (retrieved 2026-10-25)
- Government of Alberta (Treasury Board and Finance): 2025-26 Final Results: Year-End Report (retrieved 2026-10-25)
- Statistics Canada, Table 14-10-0023-01, Labour force characteristics by industry, annual (retrieved 2026-10-23)
- Statistics Canada, Table 12-10-0175-01, International merchandise trade by province, commodity, and Principal Trading Partners (retrieved 2026-10-23)
- Statistics Canada, Table 36-10-0711-01, Gross domestic product (GDP) at basic prices, by industry, provincial and territorial, annual (retrieved 2026-10-23)
- Statistics Canada, Table 34-10-0035-01, Capital and repair expenditures, non-residential tangible assets, by industry and geography (retrieved 2026-10-23)
Approved by an editor on 2026-11-09; published 2026-11-09. See the corrections log.