Research · Alberta · Ontario
Three ways to grow or shrink: the flows behind each province’s population
Immigrants arrive, temporary residents come and go, and Canadians move between provinces. Each flow has its own rhythm, and in the last three years they have pulled in different directions.
By Northline research deskUpdated 2026-11-0618 min readData to October 2026
The data behind this graphic
| Place | Since 2016 | Last year |
|---|---|---|
| British Columbia | 16.9% | 0.1% |
| Alberta | 21.2% | 1.5% |
| Saskatchewan | 12.2% | 1.0% |
| Manitoba | 15.0% | 0.6% |
| Ontario | 16.6% | 0.3% |
| Quebec | 10.0% | 0.2% |
| New Brunswick | 15.5% | 1.0% |
| Nova Scotia | 16.6% | 0.8% |
| Prince Edward Island | 23.9% | 0.8% |
| Newfoundland and Labrador | 4.2% | 0.4% |
| Yukon | 30.0% | 2.5% |
| Northwest Territories | 3.2% | -0.3% |
| Nunavut | 16.2% | 2.3% |
A province’s population is three stories
A province’s population changes for a few reasons. Babies are born and people die. Immigrants arrive from abroad. Temporary residents, among them students and workers on permits, come and go. And Canadians move between provinces. The last three flows are the ones that change fastest, and they do not move together.
This note follows them one at a time, for the four largest provinces, using Statistics Canada’s quarterly estimates.
The temporary-resident swing
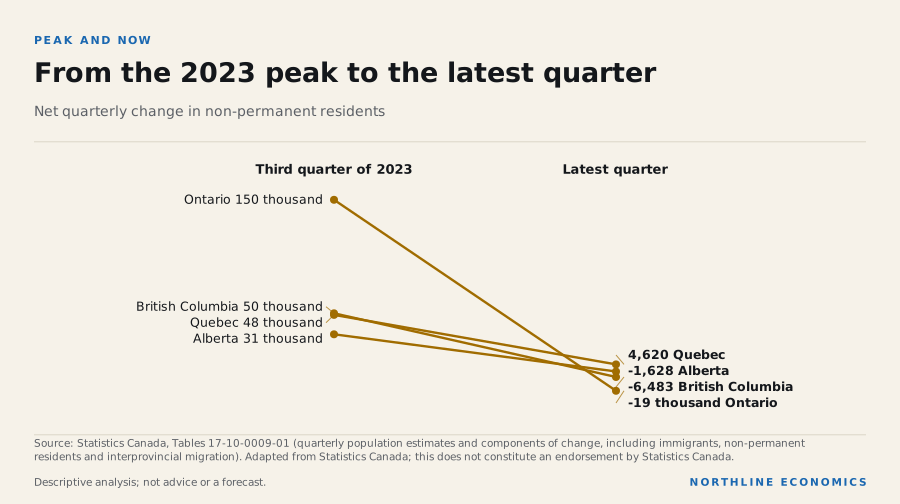
The largest recent change is in temporary residents. Ontario’s net quarterly change in non-permanent residents, the rise or fall in the number living there on temporary status, reached 150 thousand in Q3 2023. In Q2 2026 it was -19 thousand. British Columbia’s peak was 50 thousand in Q3 2023 and its latest figure -6,483. Quebec’s peak was 48 thousand in Q3 2023; its latest was 4,620, and Alberta’s peak was 31 thousand in Q3 2023 against -1,628 now.
The data behind this graphic
| Item | Third quarter of 2023 | Latest quarter |
|---|---|---|
| Ontario | 150 thousand | -19 thousand |
| British Columbia | 50 thousand | -6,483 |
| Quebec | 48 thousand | 4,620 |
| Alberta | 31 thousand | -1,628 |
The shape is the same everywhere: a large rise to a peak in 2023, then a decline that in several provinces has crossed zero, meaning the number of temporary residents fell in that quarter. Ontario’s trough, -34 thousand in Q4 2025, is on the other side of the zero line from its peak.
These are net flows, so a negative number does not mean the stock of temporary residents has collapsed, only that it is shrinking quarter by quarter. Whether the swing reflects changes in policy, in labour demand or in how long permits last is a question these series cannot answer.
Immigrants arrive in a stream that does not reverse
Immigrants, who become permanent residents, arrive in a stream that has stayed positive in every quarter of the last ten years. In the latest quarter 43 thousand immigrants arrived in Ontario, 13 thousand in British Columbia and 14 thousand in Alberta. Over the last ten years of data Ontario’s quarterly figure ranged from a low of 16 thousand in Q2 2020, during the pandemic, to a high of 67 thousand in Q4 2021.
The pandemic dip is the one place where immigration looks like the temporary-resident series: a sharp drop, then a recovery. Its range over the period is much narrower than the swing in temporary residents, and it never goes below zero.
Moving between provinces
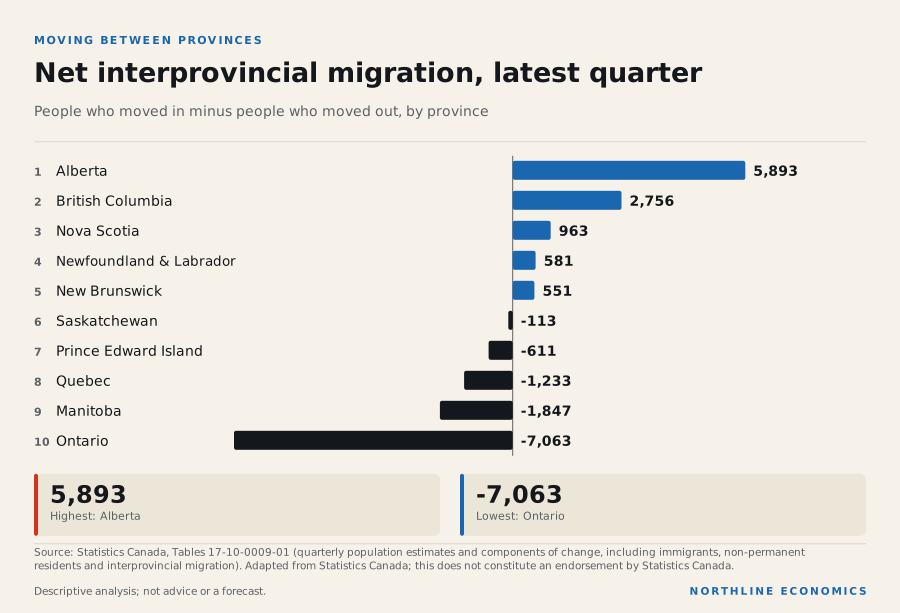
The third flow is the movement of people already in Canada. Net interprovincial migration is people moving in minus people moving out, so what one province gains another loses.
The data behind this graphic
| Item | Value |
|---|---|
| Alberta | 5,893 |
| British Columbia | 2,756 |
| Nova Scotia | 963 |
| Newfoundland and Labrador | 581 |
| New Brunswick | 551 |
| Saskatchewan | -113 |
| Prince Edward Island | -611 |
| Quebec | -1,233 |
| Manitoba | -1,847 |
| Ontario | -7,063 |
Alberta is the clearest recent gainer: its net interprovincial migration was 5,893 in the latest quarter, and 17 thousand at its peak in Q3 2023. Ontario, by contrast, recorded -7,063 in the latest quarter and -15 thousand at its lowest, in Q2 2024. British Columbia recorded 2,756 and Quebec -1,233.
One province, three flows
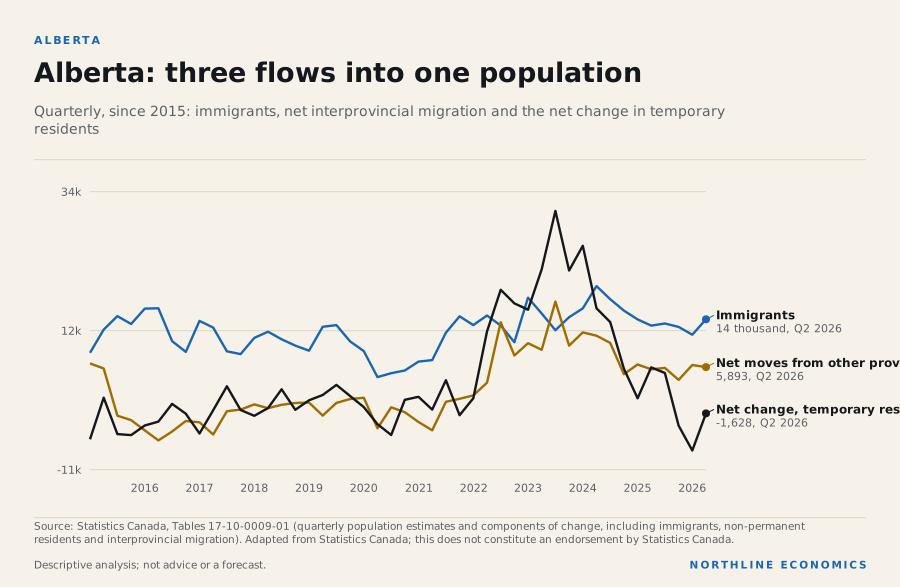
Alberta shows how the three flows combine. In the chart below, immigrants stay positive, and moves from other provinces have been positive since Q3 2021, while the net change in temporary residents swings from large gains to losses.
The data behind this graphic
| Series | Latest |
|---|---|
| Immigrants | 14 thousand, Q2 2026 |
| Net moves from other provinces | 5,893, Q2 2026 |
| Net change, temporary residents | -1,628, Q2 2026 |
This note leaves out natural increase, births minus deaths, and net emigration, which account for the rest of the change. Over the last four quarters the province’s population grew 1.5%.
How fast each province grew
The data behind this graphic
| Indicator | Place | Latest | Period | Change |
|---|---|---|---|---|
| Alberta population | Alberta | 5.1 million | Q3 2026 | +1.5% on a year earlier |
| Ontario population | Ontario | 16.3 million | Q3 2026 | +0.3% on a year earlier |
| British Columbia population | British Columbia | 5.7 million | Q3 2026 | +0.1% on a year earlier |
| Quebec population | Quebec | 9.1 million | Q3 2026 | +0.2% on a year earlier |
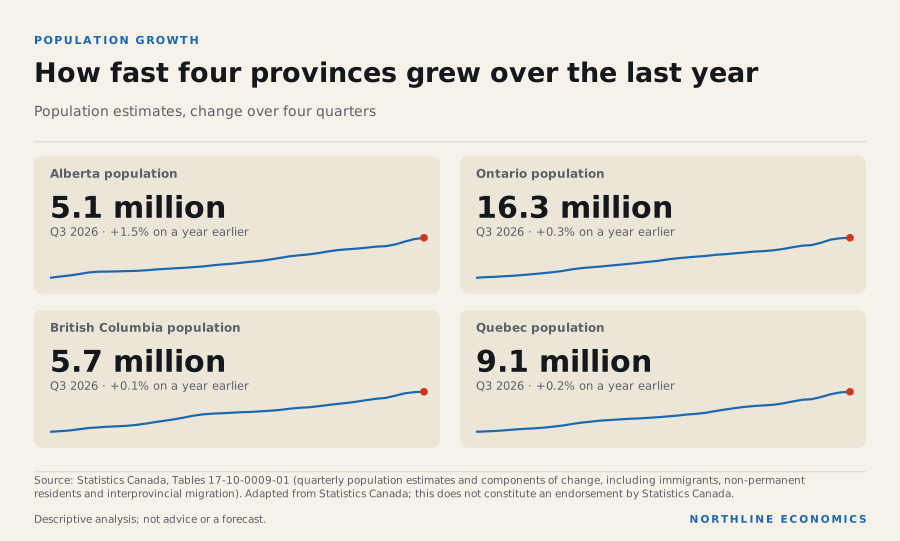
Over the latest four quarters, population grew 1.5% in Alberta, 0.3% in Ontario, 0.1% in British Columbia and 0.2% in Quebec.
The country as a whole
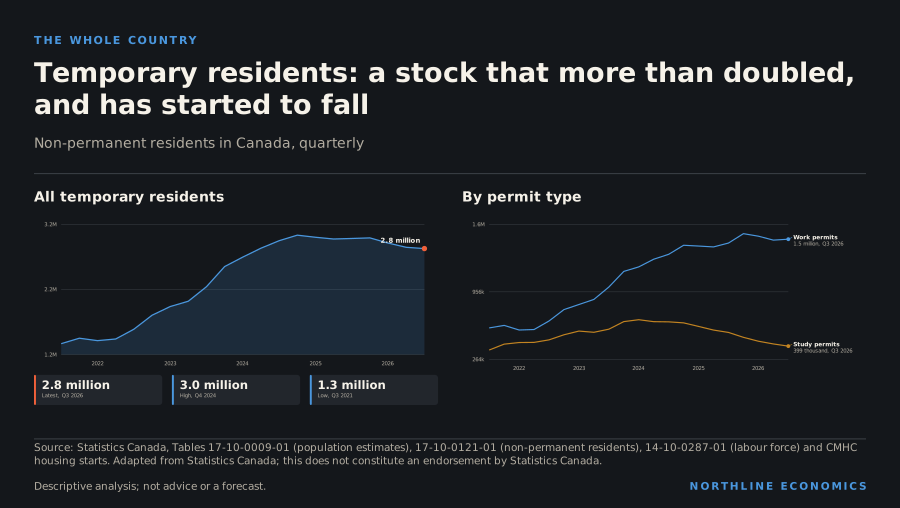
Zoom out from the provinces and the same story appears nationally. Canada’s population was 41.8 million on 1 July 2026. It grew 0.5% over the last four quarters and 9.3% over the last five years. The slowing is recent and sharp, and it is mostly a story about temporary residents.
The stock of non-permanent residents, people in Canada on study permits, work permits or as asylum claimants, was 1.3 million in mid-2021. It reached 3.0 million at the start of Q4 2024 and stood at 2.8 million at the start of Q3 2026. Work permit holders account for 1.5 million of that and study permit holders for 399 thousand.
The data behind this graphic
| Panel | Shows |
|---|---|
| All temporary residents | timeline |
| By permit type | lines |
The quarterly net change in this stock reached 308 thousand in Q3 2023, an enormous addition in a single quarter, and was -19 thousand in the latest quarter. The question this raises is how quickly national population growth adjusts to the change in that stock.
Ten years across thirteen jurisdictions
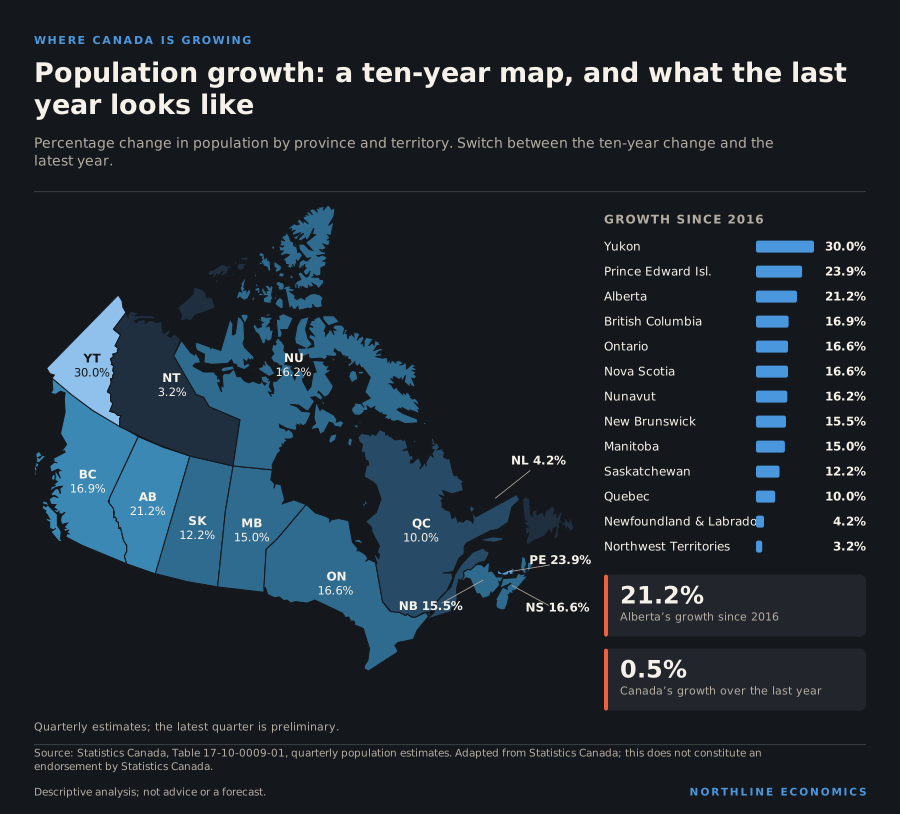
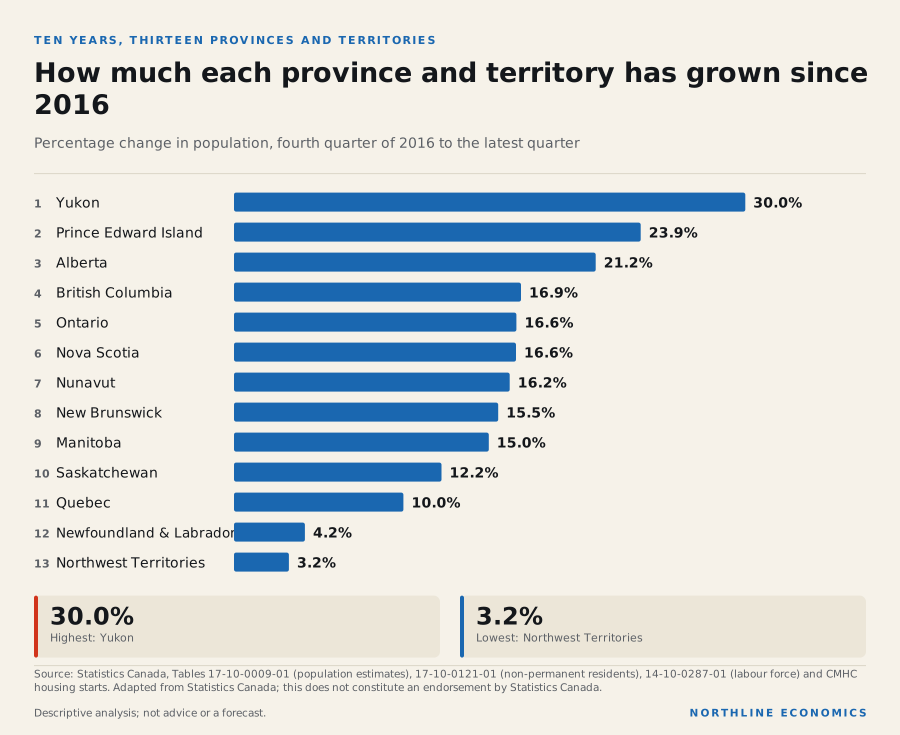
Look at a longer window and the provinces separate by growth rather than by the recent swing.
The data behind this graphic
| Item | Value |
|---|---|
| Yukon | 30.0% |
| Prince Edward Island | 23.9% |
| Alberta | 21.2% |
| British Columbia | 16.9% |
| Ontario | 16.6% |
| Nova Scotia | 16.6% |
| Nunavut | 16.2% |
| New Brunswick | 15.5% |
| Manitoba | 15.0% |
| Saskatchewan | 12.2% |
| Quebec | 10.0% |
| Newfoundland and Labrador | 4.2% |
| Northwest Territories | 3.2% |
Since the fourth quarter of 2016, population is up 23.9% in Prince Edward Island, 21.2% in Alberta, 16.9% in British Columbia and 16.6% in Ontario, but only 10.0% in Quebec, 12.2% in Saskatchewan and 4.2% in Newfoundland and Labrador. Yukon grew 30.0% from a small base. Over the last year, the order is different: Yukon, Nunavut and Alberta grew most, at 2.5%, 2.3% and 1.5%, and British Columbia, Ontario and Quebec grew least among the large provinces.
The long and short windows answer different questions. A decade-long ranking reflects migration policy, economic cycles and housing supply over many years. A one-year ranking reflects what changed in the last few quarters. The national slowdown is mostly the reversal in temporary residents, but these figures do not show why the provinces rank as they do.
What the population numbers do and do not say about housing and work
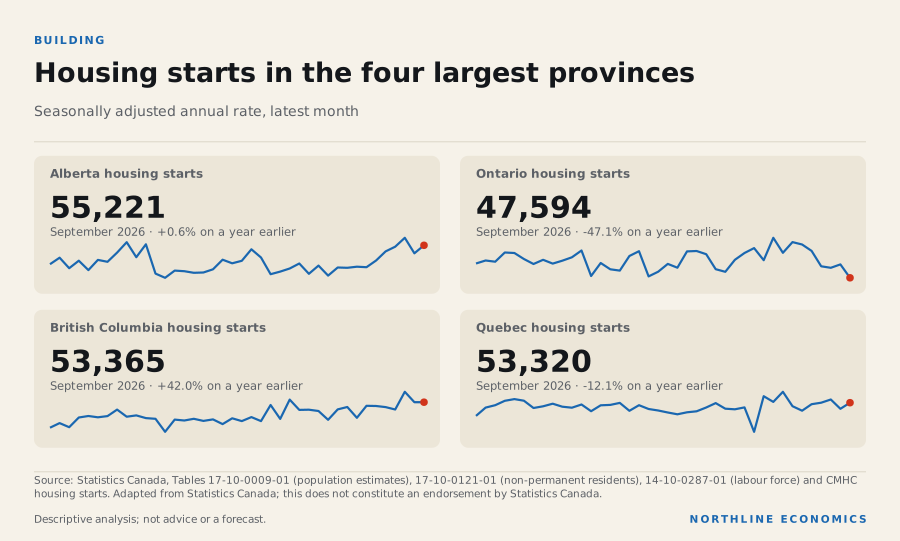
It is tempting to read population growth as housing demand and labour supply. Both links are real, and both are indirect.
The data behind this graphic
| Indicator | Place | Latest | Period | Change |
|---|---|---|---|---|
| Alberta housing starts | Alberta | 55,221 | September 2026 | +0.6% on a year earlier |
| Ontario housing starts | Ontario | 47,594 | September 2026 | -47.1% on a year earlier |
| British Columbia housing starts | British Columbia | 53,365 | September 2026 | +42.0% on a year earlier |
| Quebec housing starts | Quebec | 53,320 | September 2026 | -12.1% on a year earlier |
On housing, Alberta’s seasonally adjusted housing starts were 55,221 a year in September 2026, more than Ontario’s 47,594, although Ontario has roughly three times Alberta’s population (16.3 million against 5.1 million). Over the last twelve months the order reverses: Alberta averaged 49,529 and Ontario 62,390. A province that is growing quickly, as Alberta is, may build more per resident than one that is not.
One reading is that Alberta’s starts reflect its population growth and Ontario’s reflect the opposite: weaker growth, high borrowing costs and a mismatch between the homes being built and the people arriving. The data here show only the levels, not the reasons, and a single month of starts is a weak guide.
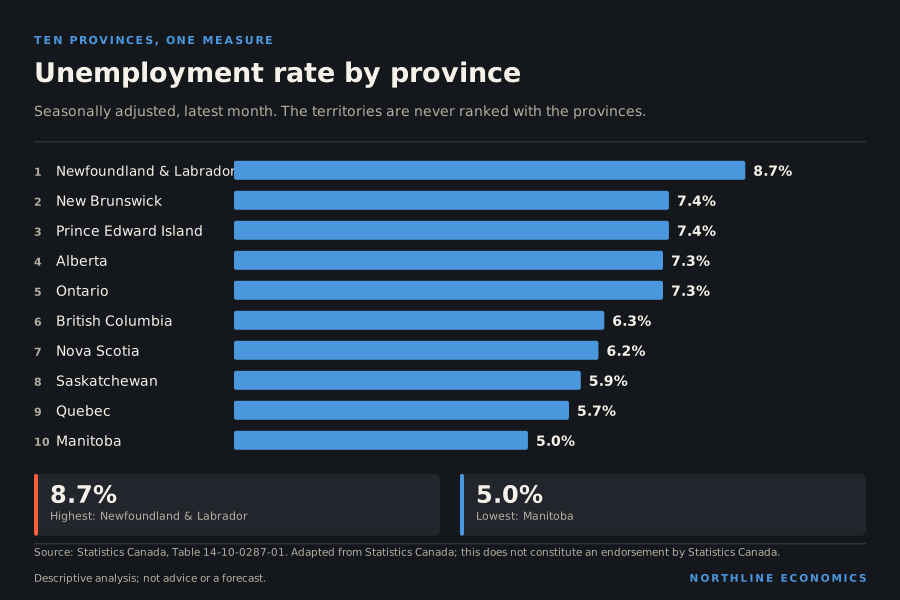
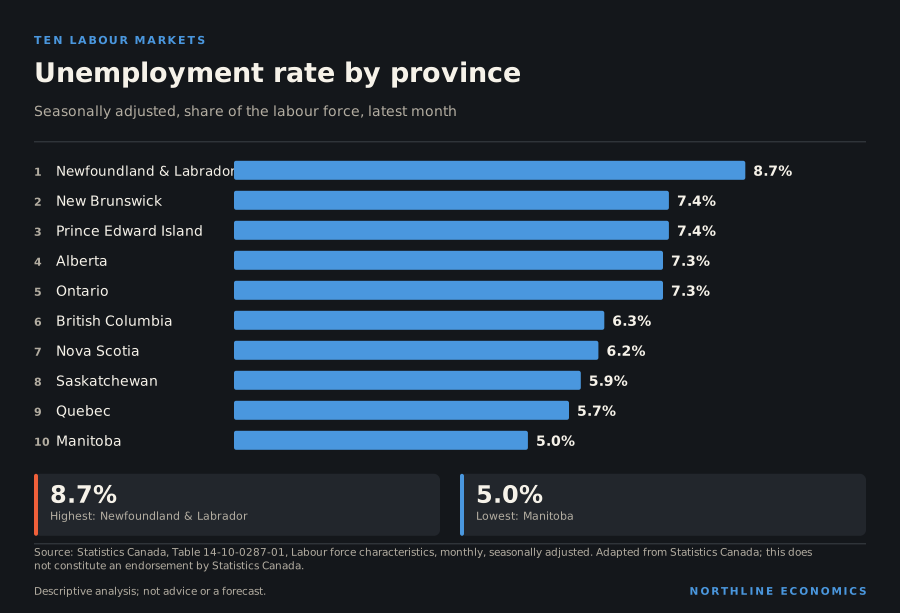
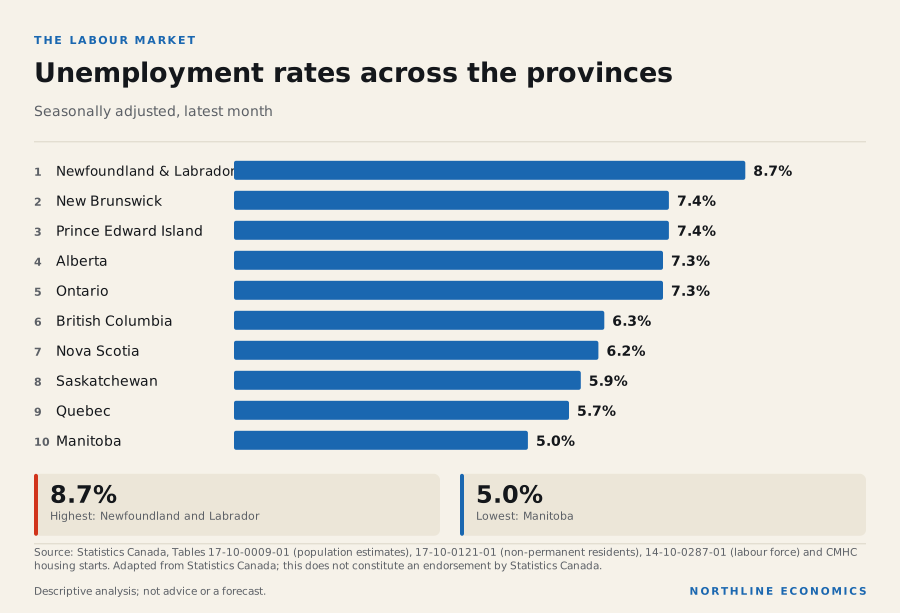
On work, the unemployment rate does not line up neatly with population growth either.
The data behind this graphic
| Item | Value |
|---|---|
| Newfoundland and Labrador | 8.7% |
| New Brunswick | 7.4% |
| Prince Edward Island | 7.4% |
| Alberta | 7.3% |
| Ontario | 7.3% |
| British Columbia | 6.3% |
| Nova Scotia | 6.2% |
| Saskatchewan | 5.9% |
| Quebec | 5.7% |
| Manitoba | 5.0% |
Alberta, the fastest-growing large province, had an unemployment rate of 7.3%; Ontario’s was 7.3% and British Columbia’s 6.3%. A growing population does not guarantee a tight labour market, because the people arriving add to labour supply as well as demand.
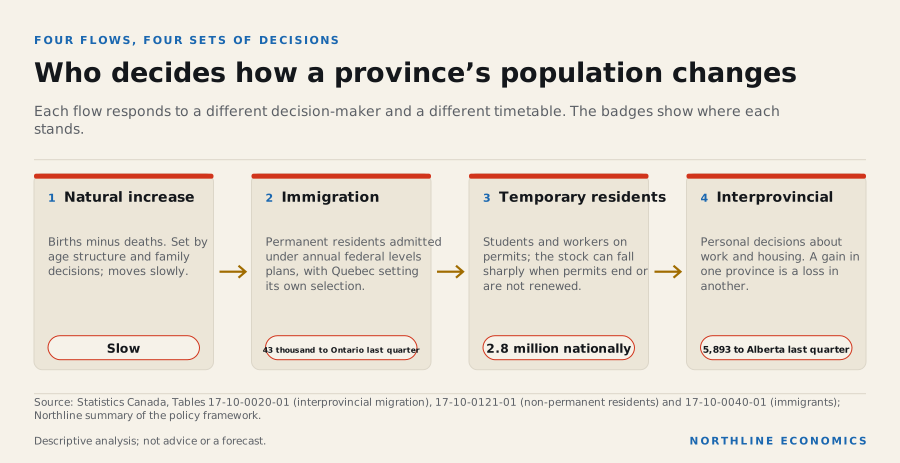
Four flows, four sets of decisions
The most useful way to read provincial population is to ask who, or what, decides each flow, because that tells you how fast it can change and what could change it.
The data behind this graphic
| Step | What happens |
|---|---|
| Natural increase | Births minus deaths. Set by age structure and family decisions; moves slowly. |
| Immigration | Permanent residents admitted under annual federal levels plans, with Quebec setting its own selection. |
| Temporary residents | Students and workers on permits; the stock can fall sharply when permits end or are not renewed. |
| Interprovincial | Personal decisions about work and housing. A gain in one province is a loss in another. |
Natural increase depends on how many people are of childbearing age and on family decisions; it changes over decades and it is the one flow no government can alter within a year. Immigration to the permanent population is set by federal levels plans, with Quebec holding its own authority over selection, and is the most directly controllable of the flows. Temporary residents are in between: admitted by federal permit decisions, but their numbers depend on how many apply, how long each permit lasts and whether holders leave or transition to permanent status. Moves between provinces are the most personal and the least administered: the sum of households deciding that work, housing or family is better elsewhere.
Evidence: Immigration, Refugees and Citizenship Canada: Supplementary Information for the 2026-2028 Immigration Levels Plan; Gouvernement du Québec (Immigration et Intégration): Tabling of orientations on immigration for 2026–2029 and of the Immigration Plan for 2026 and complementary measures
Two consequences follow. A flow that governments set can be reversed by governments, and the swing in the temporary-resident numbers shows how quickly that can show up. And a flow that depends on households responds to prices, particularly housing prices, with a lag that is hard to anticipate. Neither is a forecast. The point is that the same headline, population growth, has components that answer to different forces.
A longer view
The pattern of the last few years lies less in permanent immigration, which decreased in every province in the latest year but by far less, than in temporary residents, whose numbers rose rapidly and then, after federal measures to reduce them, began to fall in net terms in a number of provinces.
Evidence: Statistics Canada: The Daily: Canada's population estimates, second quarter 2026; Immigration, Refugees and Citizenship Canada: Supplementary Information for the 2026-2028 Immigration Levels Plan; Government of Manitoba (Manitoba Finance): Manitoba Budget 2026 (tabled 24 March 2026)
This history matters because it changes what “normal” means for a planner. A forecast built on the average of the last decade carries the temporary-resident surge into the future, and a forecast built on the latest quarter carries the reversal. Neither assumption is safe, which is why ranges are better than single numbers.
The same flows, city by city
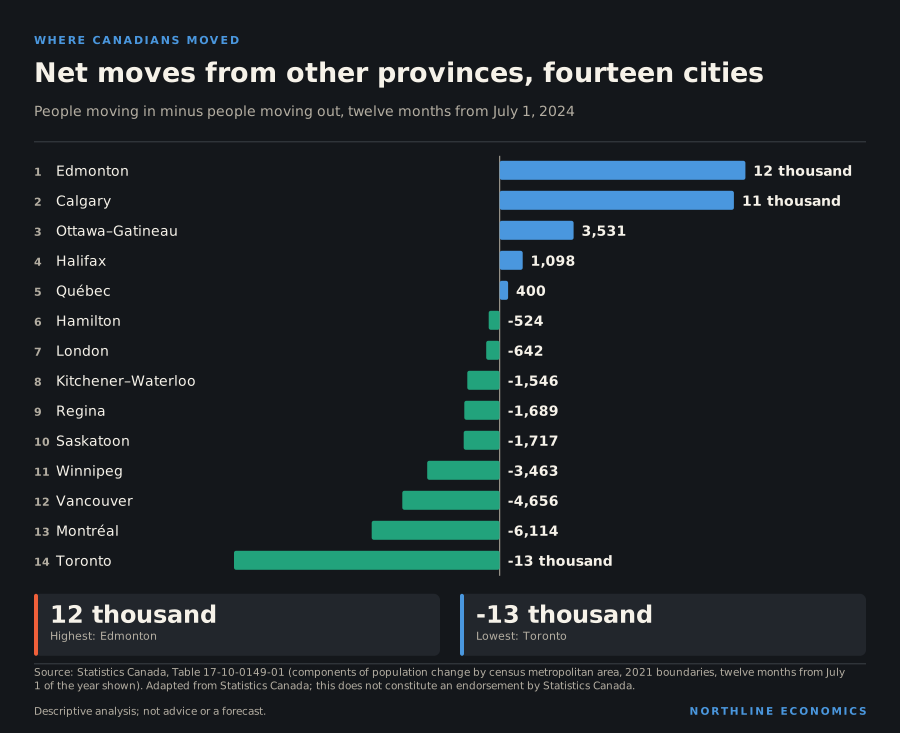
Provinces average over places that behave very differently. The census metropolitan area series, which cover fourteen cities, show which of them gain people from elsewhere in Canada and which attract immigrants.
The data behind this graphic
| Item | Value |
|---|---|
| Edmonton | 12 thousand |
| Calgary | 11 thousand |
| Ottawa–Gatineau | 3,531 |
| Halifax | 1,098 |
| Québec | 400 |
| Hamilton | -524 |
| London | -642 |
| Kitchener–Waterloo | -1,546 |
| Regina | -1,689 |
| Saskatoon | -1,717 |
| Winnipeg | -3,463 |
| Vancouver | -4,656 |
| Montréal | -6,114 |
| Toronto | -13 thousand |
Of the fourteen, the largest net gain from other provinces in the twelve months from July 2024 was in Edmonton, at 12 thousand, followed by Calgary at 11 thousand. Toronto recorded -13 thousand, Montréal -6,114 and Vancouver -4,656. Winnipeg’s net figure was -3,463. Ottawa–Gatineau, at 3,531, gained modestly.
Two points stand out. Only the two Alberta cities gained at scale: Toronto, Montréal, Vancouver and Winnipeg lost residents to the rest of the country, and so did Regina and Saskatoon. And the losses in the previous year were larger in most of those places: Toronto’s net figure in the twelve months from July 2023 was -26 thousand, and Calgary’s gain was 21 thousand. In most of these cities the direction of the flow persisted while its size shrank.
The data behind this graphic
| Item | Value |
|---|---|
| Toronto | 115 thousand |
| Vancouver | 42 thousand |
| Montréal | 38 thousand |
| Calgary | 29 thousand |
| Ottawa–Gatineau | 26 thousand |
| Edmonton | 22 thousand |
| Winnipeg | 16 thousand |
| Kitchener–Waterloo | 9,820 |
| Québec | 8,471 |
| Halifax | 8,207 |
| London | 7,025 |
| Saskatoon | 7,011 |
| Hamilton | 7,006 |
| Regina | 6,447 |
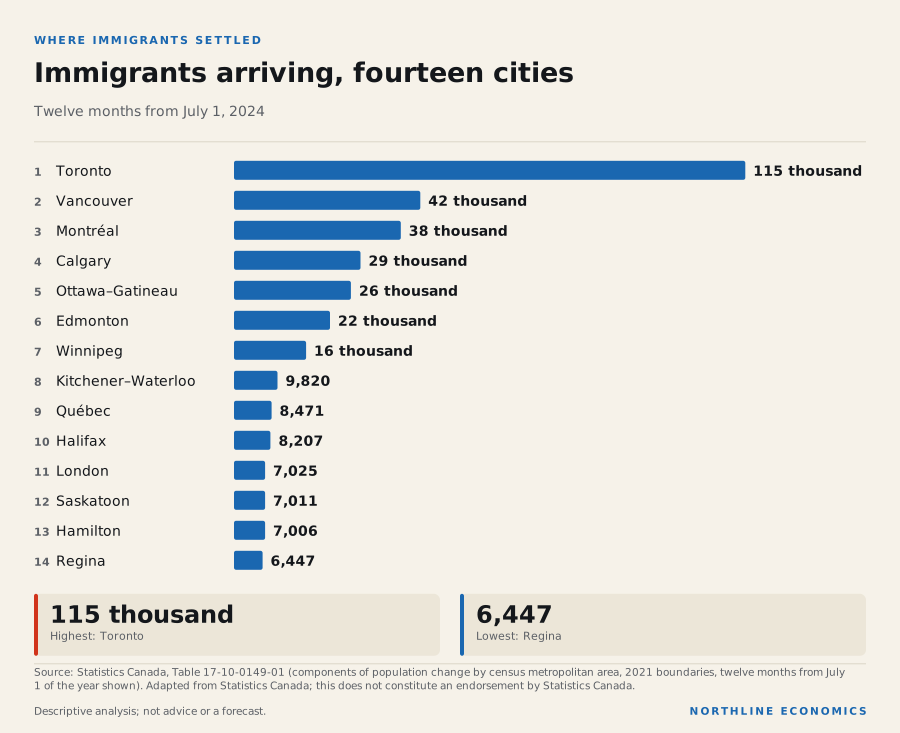
Immigrant arrivals tell a different story: in the twelve months from July 2024 Toronto received 115 thousand, Montréal 38 thousand and Vancouver 42 thousand. Smaller cities received far fewer, although the arrival counts are not scaled by population, so a smaller number can still be a larger proportion of the city’s size.
The combination is the point. In Toronto, Montréal and Vancouver the loss to other provinces is outweighed, in the figures shown, by arrivals from abroad. If the supply of new arrivals slows while departures continue, those cities’ growth would slow without any change in how many people want to leave. The data do not forecast that; they show the arithmetic.
What this means for the people who plan around population
For businesses that depend on a growing customer base, such as retailers, landlords, restaurants and training providers, the usable question is which flow their market depends on. A market that relies on temporary residents has a different risk from one that relies on permanent arrivals or on moves from other provinces. The series on this page let a firm look at the flow that matters to it.
For municipal and provincial planners, the timing of the flows matters as much as their size. Schools, transit and housing are built over years; temporary-resident flows can change in quarters. The practical response is to plan against ranges and to separate the part of the population that is durable from the part that is not.
For investors in housing and commercial property, population is a driver of demand but not the only one, and the relationship is not one for one. This note does not measure the link and Northline does not offer investment advice.
For readers following the debate, the main discipline is to ask which flow a claim concerns. A statement about “population growth” that does not say whether it means immigrants, temporary residents or people from other provinces cannot be tested against the data.
Where to read next
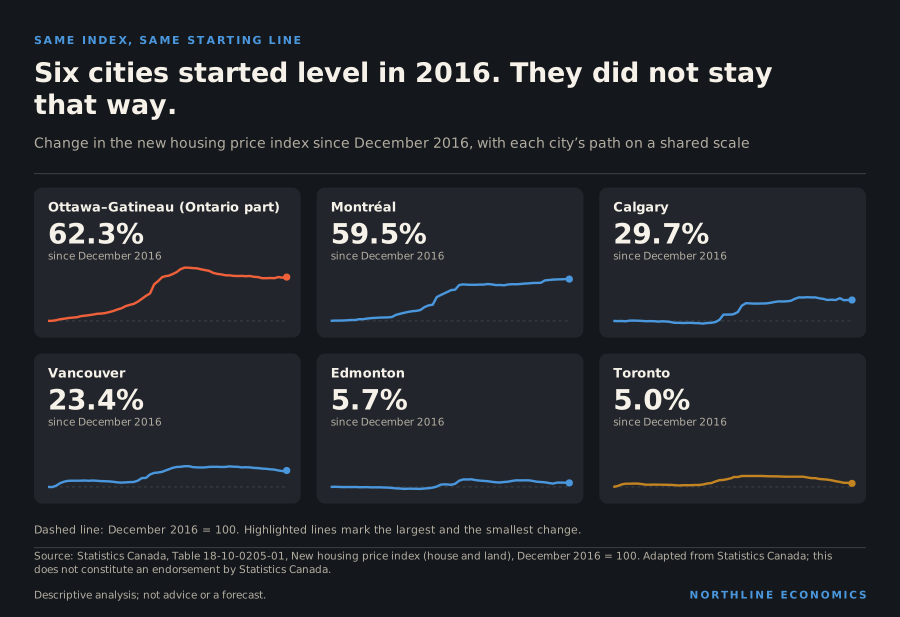
Six cities, population growth follows population in the largest cities. New-home prices in six cities follows prices in many of the same places. Canada’s export map shows how provincial economies differ in what they sell.
Three things that do not fit the headline
The country can grow by almost nothing while some provinces grow quickly. National population rose 0.5% over the last year, yet Alberta grew 1.5% and Yukon and Nunavut more. The national figure is an average of very different provincial experiences.
Fewer temporary residents is not the same as fewer people. The stock of temporary residents is still 2.8 million, and the net quarterly change is a flow on top of that stock. A negative flow shrinks the stock gradually.
A province can lose population to others and still grow. Ontario’s net interprovincial migration was -7,063 in the latest quarter, and its population still grew 0.3% over the last year. The flows add, and a loss in one can be outweighed by a gain in another.
What to watch
The quarterly estimates are revised, so treat the latest quarter as provisional. Three series carry most of the signal: the net change in non-permanent residents, immigrant arrivals and net interprovincial migration for the province you care about. All are in the Northline data library, and the provincial dashboards place them beside housing and labour-market data.
What this means for decisions
For housing and infrastructure planning, the relevant question is how many people a place will have to house, and the answer depends on which flow is moving. Temporary residents and immigrants have different housing needs and different timelines.
For employers, the net change in temporary residents is a signal about the supply of some workers, while interprovincial migration is a signal about the draw of local labour markets. Neither says what skills are arriving.
For governments, the sharp swings argue for planning around ranges rather than point forecasts. Northline does not publish population forecasts.
What this does not show
These are net quarterly flows from preliminary estimates, so the latest quarters are revised. A net figure hides the gross movement behind it: a province can gain a small net number from large arrivals and large departures. The series say nothing about where within a province people settle, about their ages or about why they moved. The flow figures above do not include the territories.
Method
Values are read from Statistics Canada’s quarterly demographic estimates. Peaks and troughs are the highest and lowest quarterly values in the last ten years of data (forty quarters). Growth rates compare the latest quarter with the same quarter a year earlier. Source: Adapted from Statistics Canada. This does not constitute an endorsement by Statistics Canada.
Keep exploring
- /provinces/
- Compare these places
- Same index, different cities: how new-home prices diverged after 2016
- Pay per hour has run ahead of output per hour: reading the productivity gap
Related research
Sources, method and limits
- Limitations
- Quarterly estimates by province; the latest quarters are preliminary and are revised. Net flows are differences between inflows and outflows and do not show the underlying gross movements. The series do not describe where within a province people live or why they moved.
- Preparation
- Prepared by the Northline research desk with AI assistance; every figure is read from the data library or a cited source at build time.
Data
- Estimates of the components of international migration, quarterly (17-10-0040-01; 8 series; latest Q2 2026; retrieved 2026-10-23). Adapted from Statistics Canada, Estimates of the components of international migration, quarterly, Table 17-10-0040-01. This does not constitute an endorsement by Statistics Canada.
- Estimates of the components of interprovincial migration, quarterly (17-10-0020-01; 4 series; latest Q2 2026; retrieved 2026-10-23). Adapted from Statistics Canada, Estimates of the components of interprovincial migration, quarterly, Table 17-10-0020-01. This does not constitute an endorsement by Statistics Canada. and Statistics Canada, Estimates of the components of interprovincial migration, quarterly, Table 17-10-0020-01. This does not constitute an endorsement by Statistics Canada.
- Population estimates, quarterly (17-10-0009-01; 10 series; latest 1 July 2026; retrieved 2026-10-23). Adapted from Statistics Canada, Population estimates, quarterly, Table 17-10-0009-01. This does not constitute an endorsement by Statistics Canada.
- Estimates of the number of non-permanent residents by type, quarterly (17-10-0121-01; 3 series; latest Q3 2026; retrieved 2026-10-23). Adapted from Statistics Canada, Estimates of the number of non-permanent residents by type, quarterly, Table 17-10-0121-01. This does not constitute an endorsement by Statistics Canada.
- Canada Mortgage and Housing Corporation, housing starts, all areas, Canada and provinces, seasonally adjusted at annual rates, monthly (34-10-0158-01; 2 series; latest September 2026; retrieved 2026-10-23). Adapted from Statistics Canada, Canada Mortgage and Housing Corporation, housing starts, all areas, Canada and provinces, seasonally adjusted at annual rates, monthly, Table 34-10-0158-01. This does not constitute an endorsement by Statistics Canada.
- Labour force characteristics, monthly, seasonally adjusted and trend-cycle (14-10-0287-01; 3 series; latest October 2026; retrieved 2026-11-07). Adapted from Statistics Canada, Labour force characteristics, monthly, seasonally adjusted and trend-cycle, Table 14-10-0287-01. This does not constitute an endorsement by Statistics Canada.
- Components of population change by census metropolitan area and census agglomeration, 2021 boundaries (17-10-0149-01; 10 series; latest 2024; retrieved 2026-10-25). Adapted from Statistics Canada, Components of population change by census metropolitan area and census agglomeration, 2021 boundaries, Table 17-10-0149-01. This does not constitute an endorsement by Statistics Canada.
Documents
- Immigration, Refugees and Citizenship Canada: Supplementary Information for the 2026-2028 Immigration Levels Plan (retrieved 2026-10-25)
- Gouvernement du Québec (Immigration et Intégration): Tabling of orientations on immigration for 2026–2029 and of the Immigration Plan for 2026 and complementary measures (retrieved 2026-10-25)
- Statistics Canada: The Daily: Canada's population estimates, second quarter 2026 (retrieved 2026-11-07)
- Government of Manitoba (Manitoba Finance): Manitoba Budget 2026 (tabled 24 March 2026) (retrieved 2026-11-07)
- Statistics Canada, Table 17-10-0009-01, Population estimates, quarterly (retrieved 2026-10-22)
Approved by an editor on 2026-11-09; published 2026-11-09. See the corrections log.