Research · Alberta · Saskatchewan
Canada’s export map: which provinces sell energy, and which sell to America
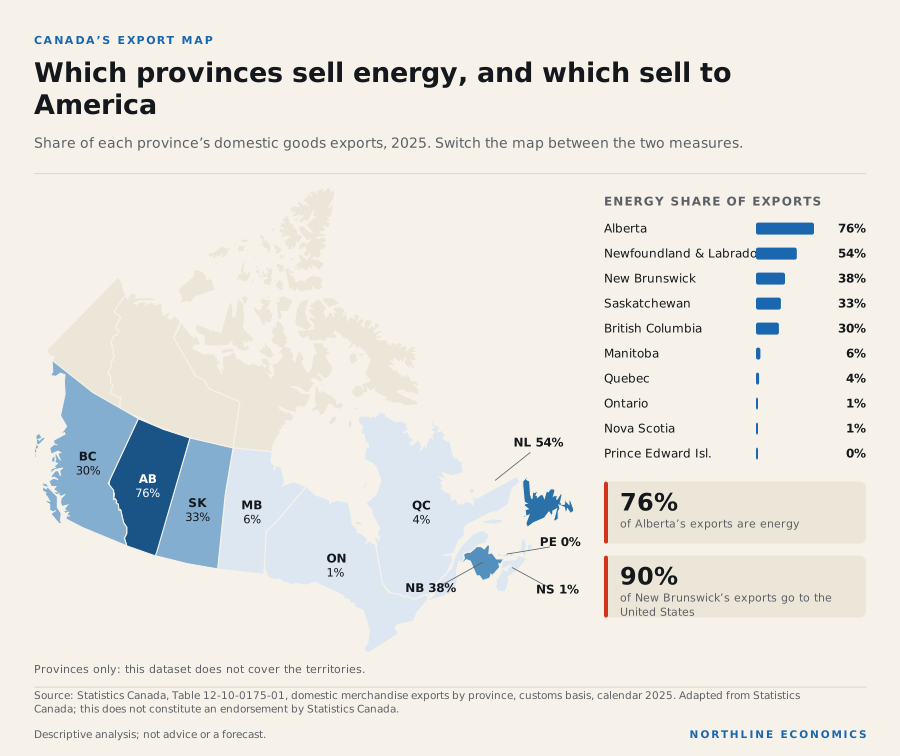
In 2025 Ontario sold the most. Alberta sold the energy. New Brunswick sold almost everything to one customer. Three ways of being an export economy, in one map.
By Northline research deskUpdated 2026-11-0615 min readData to October 2026
The data behind this graphic
| Place | Energy share | Sold to the United States |
|---|---|---|
| Newfoundland and Labrador | 54% | 35% |
| Prince Edward Island | 0% | 80% |
| Nova Scotia | 1% | 69% |
| New Brunswick | 38% | 90% |
| Quebec | 4% | 72% |
| Ontario | 1% | 72% |
| Manitoba | 6% | 66% |
| Saskatchewan | 33% | 54% |
| Alberta | 76% | 85% |
| British Columbia | 30% | 51% |
Three provinces, three different export economies
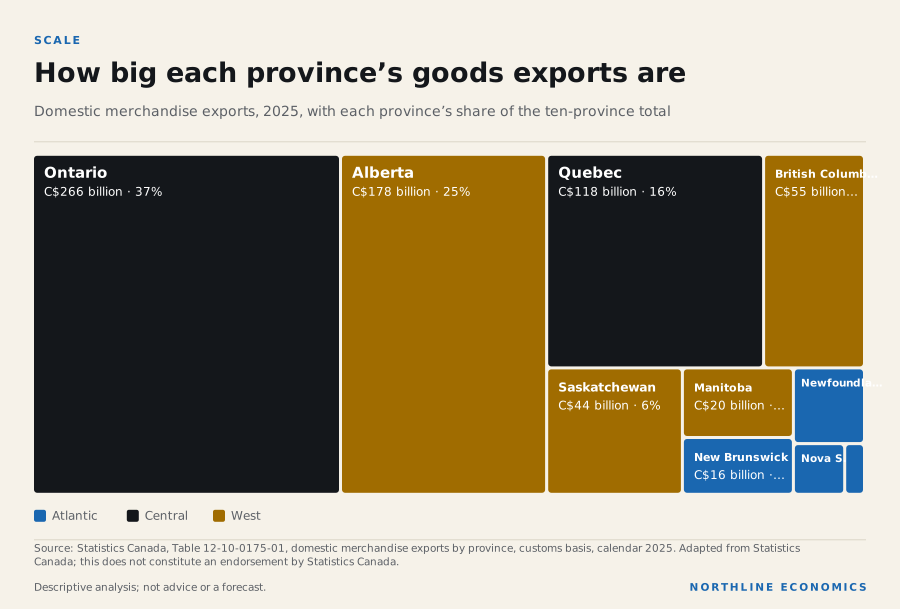
Which province sells the most to the rest of the world? By value, Ontario: its domestic goods exports came to C$266 billion in 2025. Alberta sold C$178 billion. Quebec sold C$118 billion. Together the ten provinces in this table sold C$718 billion.
The difference lies in what they sold, and to whom. Energy products were 76% of Alberta’s exports and 1% of Ontario’s. About 85% of what Alberta sold crossed the border to the United States, against 35% of what Newfoundland and Labrador sold. The map above shows both measures; use the buttons to switch between them.
The data behind this graphic
| Item | Value |
|---|---|
| Newfoundland and Labrador | C$14 billion |
| Prince Edward Island | C$3 billion |
| Nova Scotia | C$7 billion |
| New Brunswick | C$16 billion |
| Quebec | C$118 billion |
| Ontario | C$266 billion |
| Manitoba | C$20 billion |
| Saskatchewan | C$44 billion |
| Alberta | C$178 billion |
| British Columbia | C$55 billion |
Those two questions, what a province sells and where it goes, are easy to blur into one. They are different risks, and the rest of this note keeps them apart.
Where the energy comes from
Start with scale. The ten provinces together exported C$189 billion of energy products in 2025. Alberta alone accounts for 72% of that. Saskatchewan contributes 8%, British Columbia 9%, Newfoundland and Labrador 4% and New Brunswick 3%. Quebec, Ontario and Manitoba supply smaller shares, and Nova Scotia and Prince Edward Island almost none.
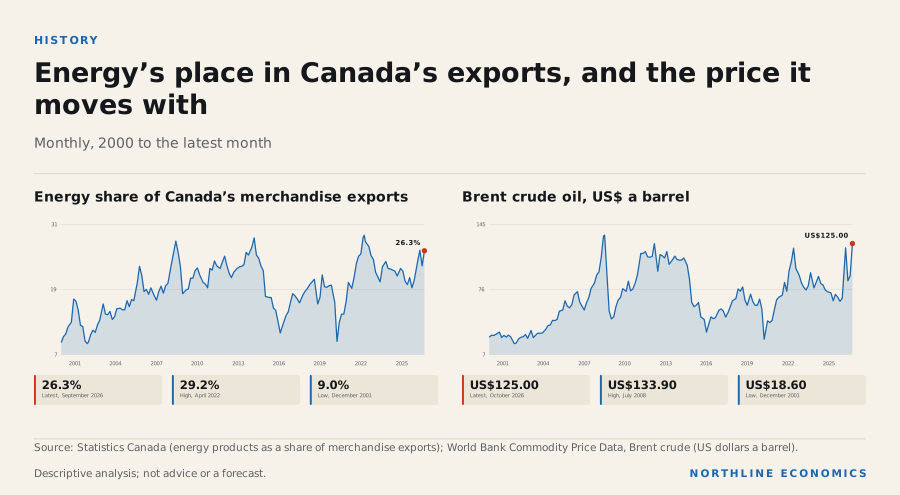
That concentration matters for how Canada’s energy exports behave as a whole. When the price of crude oil moves, one province feels most of the change in the value of what leaves the country. Since the series begins in 1997, the energy share of Canada’s merchandise exports has been as low as 5.9% (February 1999) and as high as 29.2% (April 2022). It stood at 26.3% in September 2026.
The data behind this graphic
| Panel | Shows |
|---|---|
| Energy share of Canada’s merchandise exports | timeline |
| Brent crude oil, US$ a barrel | timeline |
Both panels rise and fall over many of the same stretches of years. Brent crude averaged as much as US$133.90 a barrel in July 2008 and stood at US$125.00 in October 2026. This note does not claim a precise relationship between the two lines. The chart shows that the energy share of exports rises and falls with a global price that no Canadian province sets.
Follow Alberta’s exports
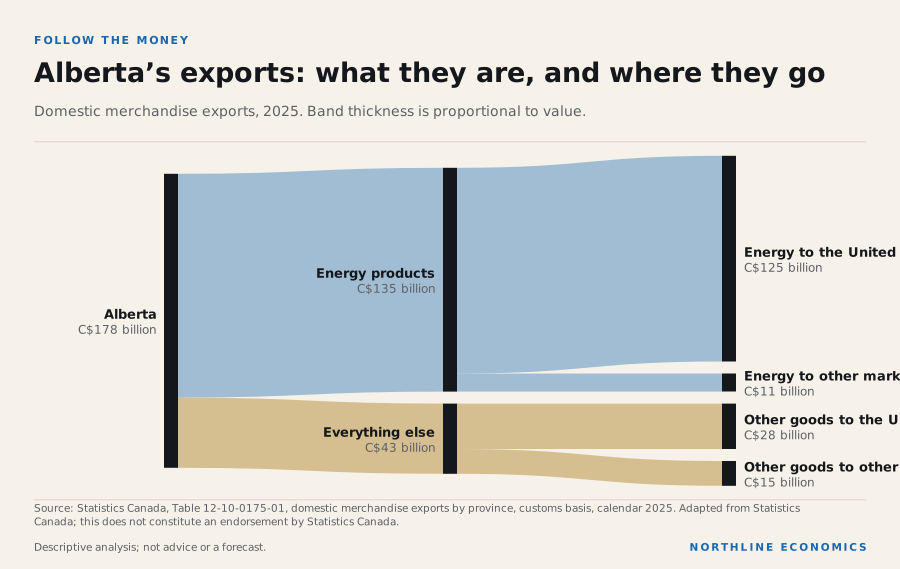
Alberta is the best place to see the two risks separately, because energy is both the dominant product and, for the most part, a single-customer business.
The data behind this graphic
| From | To | Value |
|---|---|---|
| Alberta | Energy products | C$135 billion |
| Alberta | Everything else | C$43 billion |
| Energy products | Energy to the United States | C$125 billion |
| Energy products | Energy to other markets | C$11 billion |
| Everything else | Other goods to the United States | C$28 billion |
| Everything else | Other goods to other markets | C$15 billion |
Of the C$135 billion of energy products Alberta exported, C$125 billion went to the United States. In other words, 92% of Alberta’s energy exports have one destination. The rest of Alberta’s goods exports are more diversified by destination in this table: they total C$43 billion, of which C$28 billion went to the United States.
It is tempting to read this as Alberta having two economies, a concentrated energy one and a diversified one. The data support the first half of that picture clearly. For the second half, a table of destinations does not say how diversified the underlying products are.
Dependence is not the same as destination
Now put the two measures side by side across provinces. Newfoundland and Labrador is the clearest contrast with Alberta. Energy products were 54% of its exports, a higher share than in any province except Alberta. Yet only 35% of its goods exports went to the United States, the lowest share of any province in the table. A province can depend heavily on one commodity and still be spread across markets.
New Brunswick is the mirror image. Its energy share is lower, at 38%, but 90% of its exports went to the United States, the highest share in the table. Prince Edward Island sold 80% of its goods to the United States and almost no energy at all.
For a business or a government, the two measures call for different questions:
- A high energy share is exposure to a price. It asks what happens to export revenue when oil or gas prices change.
- A high United States share is exposure to a customer and its rules. It asks what happens when demand, regulation or trade policy in one country changes.
- Both together, as in Alberta, compound: the same buyers are the market for the same product.
The data cannot say which risk matters more. That depends on how substitutable the product is, how easily it can reach other buyers, and what the province’s other industries would absorb. Those are reasons to look beyond a single table.
Big exporters, small energy sectors
Ontario and Quebec complete the picture. Ontario’s exports were 37% of the ten-province total and Quebec’s 16%. Energy was 1% and 4% of their exports. About 72% of Ontario’s goods and 72% of Quebec’s went to the United States.
By these measures neither is an energy economy. Both are large, and both lean heavily on one customer. A change in United States demand would register in these two provinces’ exports far more than a change in oil prices.
Exports are not jobs
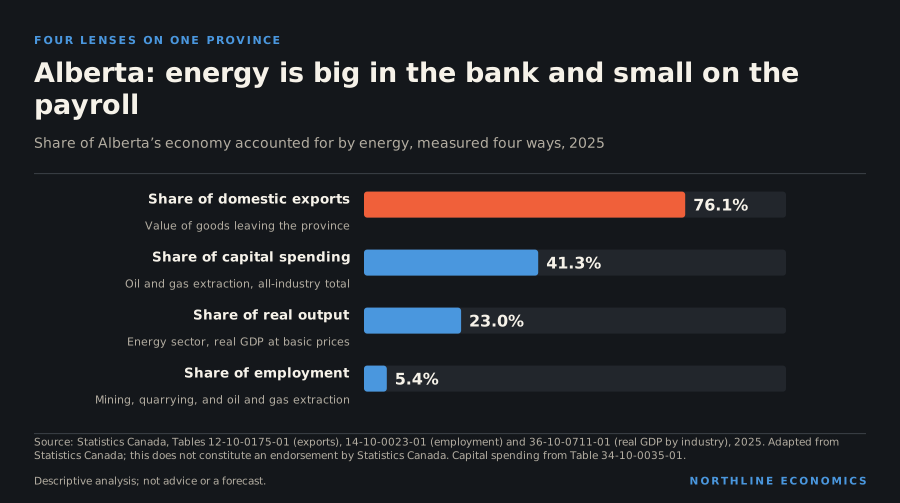
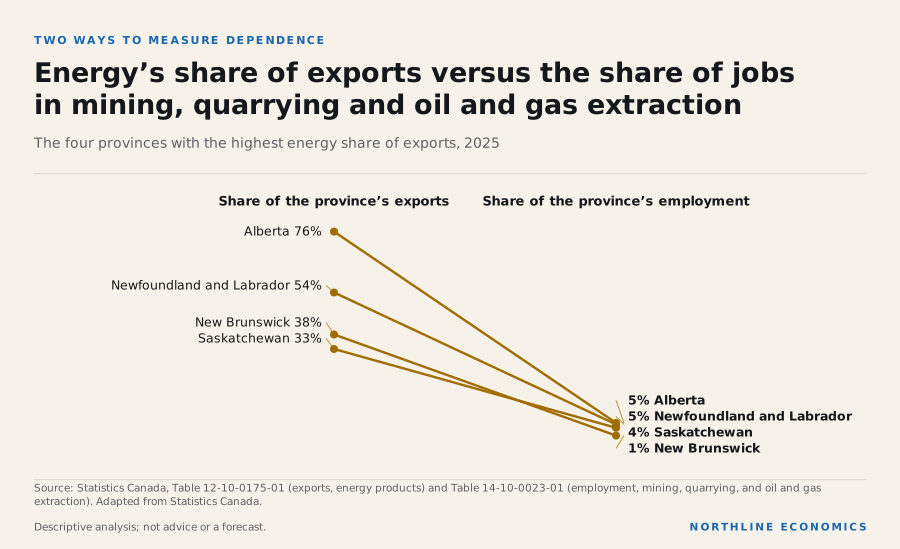
A question follows from the Alberta chart. If energy is more than three-quarters of what Alberta sells abroad, shouldn’t it be most of what Albertans do for a living? It is not, and the gap is the most useful thing this data reveals.
The data behind this graphic
| Item | Share of the province’s exports | Share of the province’s employment |
|---|---|---|
| Alberta | 76% | 5% |
| Newfoundland and Labrador | 54% | 5% |
| New Brunswick | 38% | 1% |
| Saskatchewan | 33% | 4% |
In Alberta, mining, quarrying and oil and gas extraction employed 5% of workers in 2025, against 76% of exports. In Newfoundland and Labrador the employment share was 5% against 54% of exports, in New Brunswick 1% against 38%, and in Saskatchewan 4% against 33%. The two measures do not cover the same activities: energy products include refined petroleum and other processed goods, while the employment measure counts only mining, quarrying and oil and gas extraction, which leaves out refining and includes mines that produce no energy. The comparison shows the difference in scale, not the number of jobs behind energy exports.
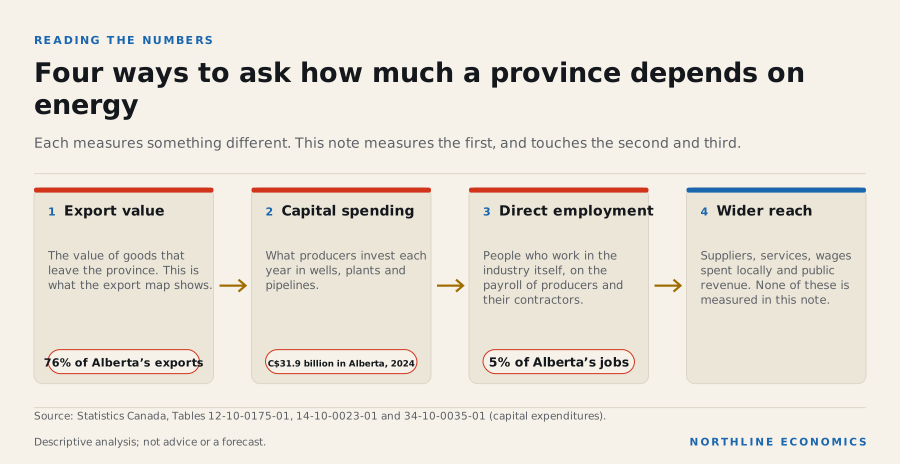
Four different questions hide inside the word “dependence”, and they have different answers.
The data behind this graphic
| Step | What happens |
|---|---|
| Export value | The value of goods that leave the province. This is what the export map shows. |
| Capital spending | What producers invest each year in wells, plants and pipelines. |
| Direct employment | People who work in the industry itself, on the payroll of producers and their contractors. |
| Wider reach | Suppliers, services, wages spent locally and public revenue. None of these is measured in this note. |
Export value tells you what leaves the province. Capital spending tells you what producers invest: in Alberta, oil and gas extraction companies spent C$31.9 billion on capital in 2024, against C$38.0 billion in 2015, in current dollars. Direct employment counts the people in the industry itself. Wider reach is everything else: the engineers, accountants, truckers and restaurants that sell to the industry or its workers, and the public revenue it generates. This note measures the first, touches the second and third, and does not measure the fourth.
A plausible reading of the gap between export share and job share is that extraction is capital-intensive: it takes large amounts of equipment and relatively few workers to produce a high value of output. Northline has not measured capital intensity here, so this is an interpretation, not a finding. The companion note, Where the money comes from is not where the jobs are, looks at the Alberta case in more detail.
The middle of the map
Between the energy giants and the manufacturing giants sit the provinces that are harder to summarize, and the map is most useful here.
British Columbia sold 30% energy and sent 51% of its goods to the United States. Both shares are moderate next to Alberta’s. Saskatchewan looks similar at first glance, with 33% energy and 54% sent to the United States, but its energy exports are a larger part of the provincial total than British Columbia’s are of its own, and 8% of the ten provinces’ energy exports start there.
Manitoba is closer to the central provinces: 6% energy and 66% to the United States. Nova Scotia’s energy share was 1% with 69% of exports going to the United States. Both are small exporters next to Ontario or Alberta, which makes their shares more sensitive to one or two large shipments than the shares of the big provinces are.
That last point is worth keeping in mind for every small province in the table: a share of a small total can move a long way on one contract.
Size, not just share
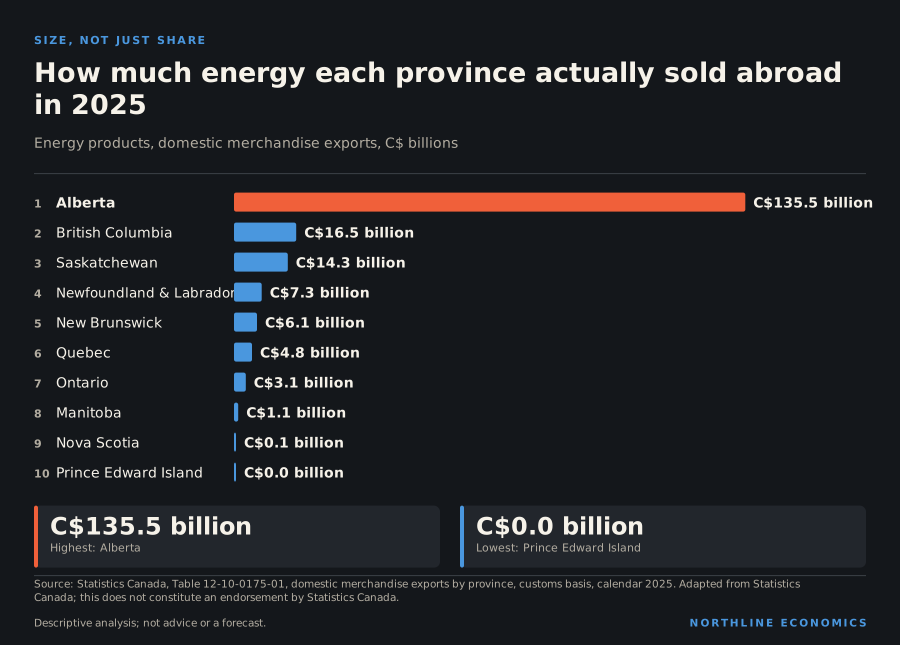
Everything above is about shares. A share says how important energy is to a province’s own export bill; it does not say how much energy the province sells. The two rankings can disagree, and where they do, the disagreement is informative.
The data behind this graphic
| Item | Value |
|---|---|
| Alberta | C$135.5 billion |
| British Columbia | C$16.5 billion |
| Saskatchewan | C$14.3 billion |
| Newfoundland and Labrador | C$7.3 billion |
| New Brunswick | C$6.1 billion |
| Quebec | C$4.8 billion |
| Ontario | C$3.1 billion |
| Manitoba | C$1.1 billion |
| Nova Scotia | C$0.1 billion |
| Prince Edward Island | C$0.0 billion |
Alberta’s energy exports were C$135.5 billion in 2025, many times any other province’s. British Columbia sold C$16.5 billion, Saskatchewan C$14.3 billion and Newfoundland and Labrador C$7.3 billion. New Brunswick, where energy is 38% of exports, sold C$6.1 billion. Quebec, where energy is only 4% of exports, sold C$4.8 billion, and Ontario sold C$3.1 billion.
The lesson is that a province can be a large energy exporter and not an energy economy, and the reverse. Quebec and Ontario, with large export bases, sell real amounts of energy that barely register as a share of what they sell. New Brunswick sells more energy than either, and it is 38% of its exports.
Share and size answer different questions. Share is the right measure for a province asking how exposed its export revenue is to energy prices. Size is the right measure for a national or a market-level question, such as how much of Canada’s energy exports depends on one province. Northline reports both for that reason.
Where the data stop
Northline’s extract covers the ten provinces. Statistics Canada’s table also reports the territories, where mining and, in some cases, energy are significant, but they are not included here. The table assigns exports to the province of origin or of clearance, which for pipelines and rail shipments can differ from where a barrel was produced. The picture of Alberta is therefore a picture of what leaves Alberta, which is a good proxy for what Alberta produces and sells but is not the same thing.
A decade of boom, pause and rebuilding
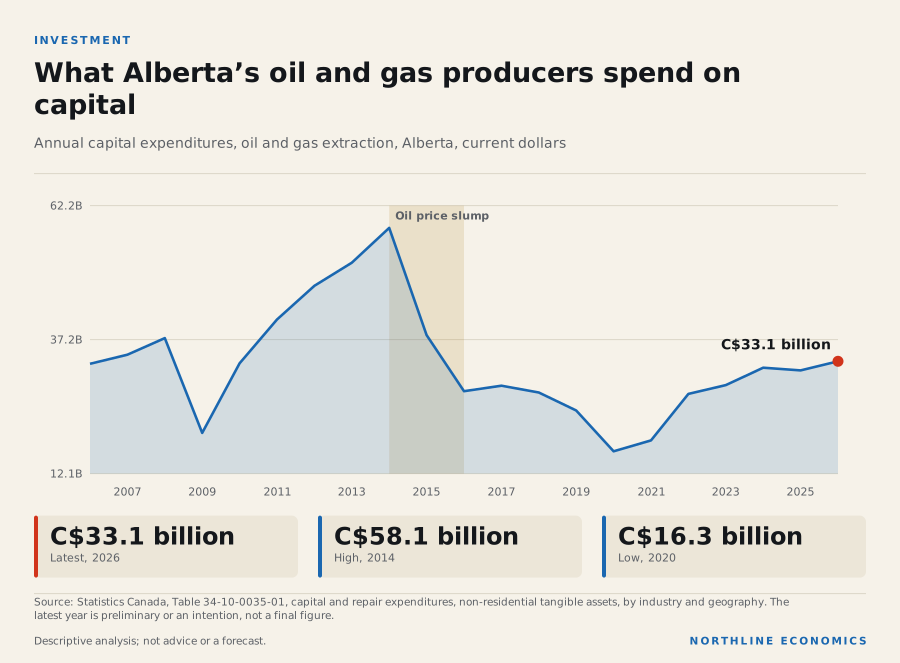
Export values are a snapshot. The more interesting story is what producers do with the revenue. Alberta’s oil and gas companies spent as much as C$58.1 billion on capital in 2014, the peak in the last twenty years of this series, and as little as C$16.3 billion in 2020.
The data behind this graphic
| Period | Value |
|---|---|
| 2026-01 | 3.30962e+10 |
| 2025-01 | 3.14015e+10 |
| 2024-01 | 3.18992e+10 |
| 2023-01 | 2.86352e+10 |
| 2022-01 | 2.70011e+10 |
| 2021-01 | 1.82918e+10 |
| 2020-01 | 1.62528e+10 |
| 2019-01 | 2.38797e+10 |
| 2018-01 | 2.72592e+10 |
| 2017-01 | 2.8526e+10 |
| 2016-01 | 2.74915e+10 |
| 2015-01 | 3.80049e+10 |
| 2014-01 | 5.80655e+10 |
| 2013-01 | 5.15557e+10 |
| 2012-01 | 4.72224e+10 |
| 2011-01 | 4.09187e+10 |
| 2010-01 | 3.27139e+10 |
| 2009-01 | 1.96853e+10 |
| 2008-01 | 3.74345e+10 |
| 2007-01 | 3.43314e+10 |
| 2006-01 | 3.26357e+10 |
The shaded band marks the years when crude prices fell sharply, visible in the Brent panel above. Capital spending fell with them and has recovered partway since, though in current dollars, which do not adjust for rising costs. The latest figure in the series is a preliminary estimate or an intention, and Statistics Canada may revise it.
One reading is that investment follows price expectations with a delay, which would make a province’s employment and public finances more exposed to the price cycle than its current export share suggests. The data here show the pattern of spending but not the reasons for it.
Three common misreadings
“The biggest exporter must be the energy province.” By value, Ontario sold more than any other province in 2025, and energy was almost none of it. Size and specialization are different things.
“A high energy share means a high share of energy jobs.” The comparison above shows the opposite can hold. In all four provinces with the highest energy shares, the share of workers in extraction is a small fraction of the share of exports.
“A high United States share means the same exposure everywhere.” The United States took 90% of New Brunswick’s exports and 85% of Alberta’s, but the products differ, and so do the alternatives. A share says who the customer is, not how easily a producer could find another.
What this means for decisions
For a business that sells to or buys from these provinces, the export map is a first screen for where price risk and customer risk sit. A supplier to Alberta energy companies is exposed to the price cycle even if it never sells a barrel. A manufacturer in Ontario or Quebec is exposed mainly to United States demand for factory goods.
For economic development organizations, the lesson is that a headline specialization can hide a broader base, and a broad base can hide a single large customer. Comparing a province’s export share with its employment share, as the Alberta panel does, is a quick check on how much of the local economy a commodity actually touches.
For households, the link is mostly indirect: through provincial revenues, regional employment and housing demand. This note does not measure those channels.
Northline does not offer investment advice. The point of the comparison is to separate what the data establish from what they only suggest.
What this does and does not show
It shows, for one year, what each province sold and where it went. It does not show trends over time by province, because this comparison covers 2025 alone. It covers goods, not services, which are a large part of the economy in several provinces. It excludes the territories. It uses customs-basis values, which assign exports to the province of origin or clearance, and which exclude re-exports.
A share is also not a size. Prince Edward Island’s 80% United States share and Ontario’s 72% describe very different volumes of trade. And because each province’s shares are measured against a different total, the shares cannot be added across provinces.
What to watch
If you follow the economy of an energy province, three series carry most of the signal: the energy share of Canada’s merchandise exports, the United States share of those exports, and the price of crude oil. Each is in the Northline data library and can be followed from the Monitoring page. If you are comparing places for a business decision, the exposure profile puts each province’s export shares beside the share of local jobs in key industries.
Method
Values are sums of the twelve monthly customs-basis values for calendar 2025 from Statistics Canada table 12-10-0175-01. A province’s share is its value divided by its total domestic merchandise exports. The ten-province total is the sum of the ten rows, not Canada’s total exports. Employment shares are from table 14-10-0023-01, annual averages for 2025. The national series are Statistics Canada’s merchandise trade and the World Bank’s monthly Brent price. Derived shares are computed by Northline from those values.
Keep exploring
- Canada: trade dashboard
- Compare these places
- Where the money comes from is not where the jobs are: Alberta’s energy paradox
- Explore the related relationships
- One customer, many products: Canada’s goods trade with the United States
Related research
Sources, method and limits
- Limitations
- Domestic merchandise exports on a customs basis for calendar 2025: goods only, re-exports excluded, province of origin as Statistics Canada assigns it. Northline’s extract covers the ten provinces, not the territories, which the table also reports. A share of exports is not a share of provincial output, income or employment, and shares are not sizes.
- Preparation
- Prepared by the Northline research desk with AI assistance; every figure is read from the data library or a cited source at build time.
Data
- International merchandise trade by commodity, monthly (12-10-0163-01; 1 series; latest September 2026; retrieved 2026-11-05). Adapted from Statistics Canada, International merchandise trade by commodity, monthly, Table 12-10-0163-01. This does not constitute an endorsement by Statistics Canada. and Statistics Canada, International merchandise trade for all countries and by Principal Trading Partners, monthly, Table 12-10-0011-01. This does not constitute an endorsement by Statistics Canada.
- Crude oil, Brent, monthly average price (Pink Sheet (monthly prices); 1 series; latest October 2026; retrieved 2026-11-05). Source: World Bank, Commodity Price Data (The Pink Sheet), Crude oil, Brent, updated November 03, 2026. CC BY (version per the Bank licence page); no changes to values.
- Capital and repair expenditures, non-residential tangible assets, by industry and geography (34-10-0035-01; 1 series; latest 2026; retrieved 2026-10-30). Adapted from Statistics Canada, Capital and repair expenditures, non-residential tangible assets, by industry and geography, Table 34-10-0035-01. This does not constitute an endorsement by Statistics Canada.
Documents
- Statistics Canada, Table 12-10-0175-01, International merchandise trade by province, commodity, and Principal Trading Partners (retrieved 2026-10-23)
- Statistics Canada, Table 14-10-0023-01, Labour force characteristics by industry, annual (retrieved 2026-10-23)
Approved by an editor on 2026-11-09; published 2026-11-09. See the corrections log.