Research · World · Australia
Pay per hour has run ahead of output per hour: reading the productivity gap
Since the end of 2019, pay per hour in Canada’s business sector has grown far faster than output per hour. What the gap does and does not mean.
By Northline research deskUpdated 2026-11-0614 min readData to September 2026
The data behind this graphic
| Series | Latest |
|---|---|
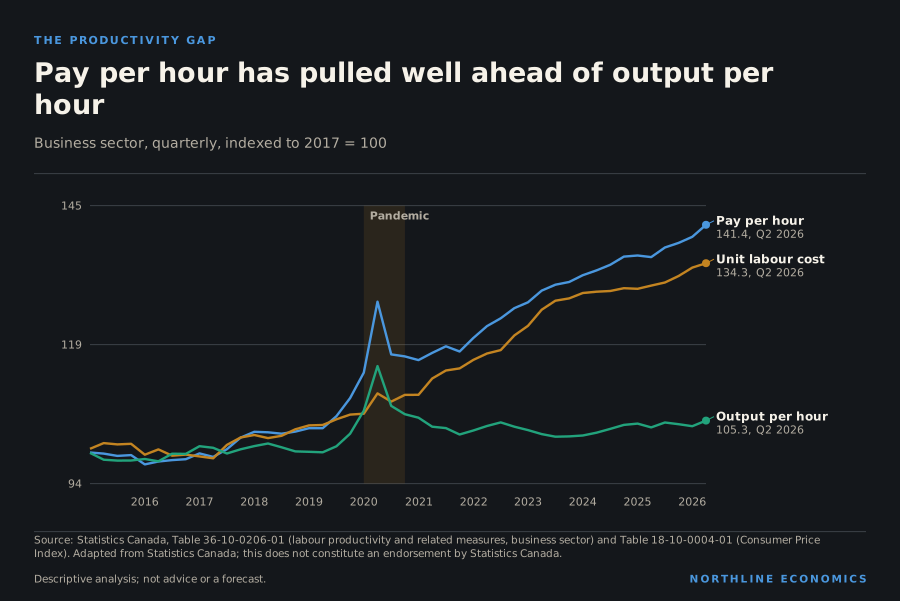
| Pay per hour | 141.4, Q2 2026 |
| Unit labour cost | 134.3, Q2 2026 |
| Output per hour | 105.3, Q2 2026 |
What an hour of work produces
Productivity is how much output an hour of work produces. Over long periods it is what allows living standards to rise: an economy that produces more per hour can pay more per hour without raising prices. The data put a figure on one comparison: how pay per hour and output per hour have moved in Canada’s business sector.
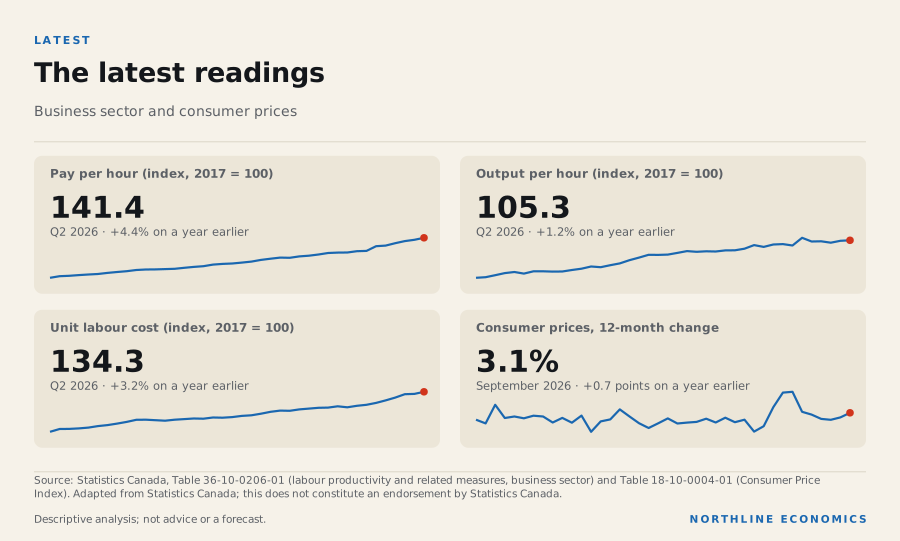
Both indices are set to 100 in 2017. In Q2 2026, compensation per hour stood at 141.4 and real output per hour at 105.3. Pay per hour has run far ahead.
Start with the size of the gap
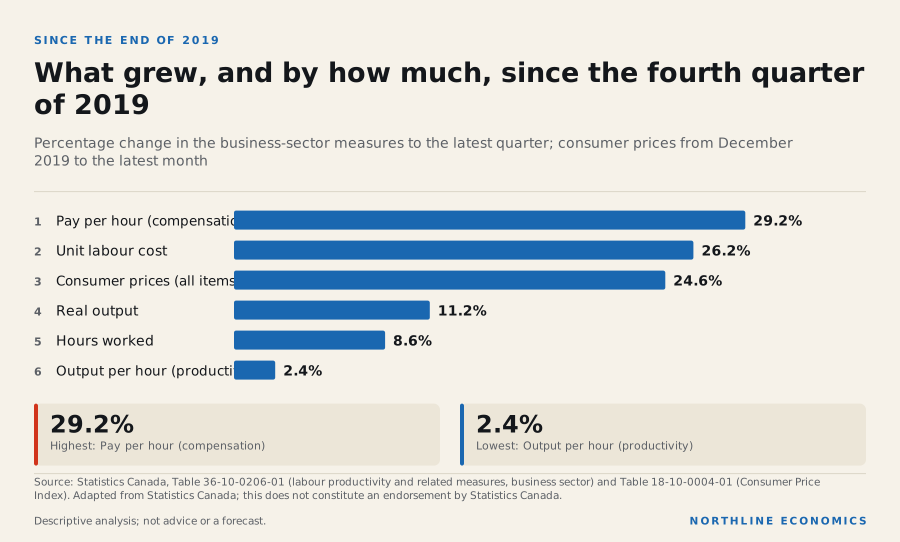
Since the end of 2019, business-sector compensation per hour is up 29.2%. Output per hour is up 2.4%. Unit labour cost, which combines the two, is up 26.2%.
The data behind this graphic
| Item | Value |
|---|---|
| Pay per hour (compensation) | 29.2% |
| Unit labour cost | 26.2% |
| Consumer prices (all items) | 24.6% |
| Real output | 11.2% |
| Hours worked | 8.6% |
| Output per hour (productivity) | 2.4% |
Two things in this chart deserve attention. The first is the contrast between the two measures of work: real output is up 11.2% while hours worked are up 8.6%. Most of the extra output since 2019 was produced by working more hours, not by producing more in each hour.
The second is the consumer price line. Prices rose 24.6% from December 2019 to September 2026. That is close to the rise in pay per hour, which is the point of the next section.
Why a gap appears
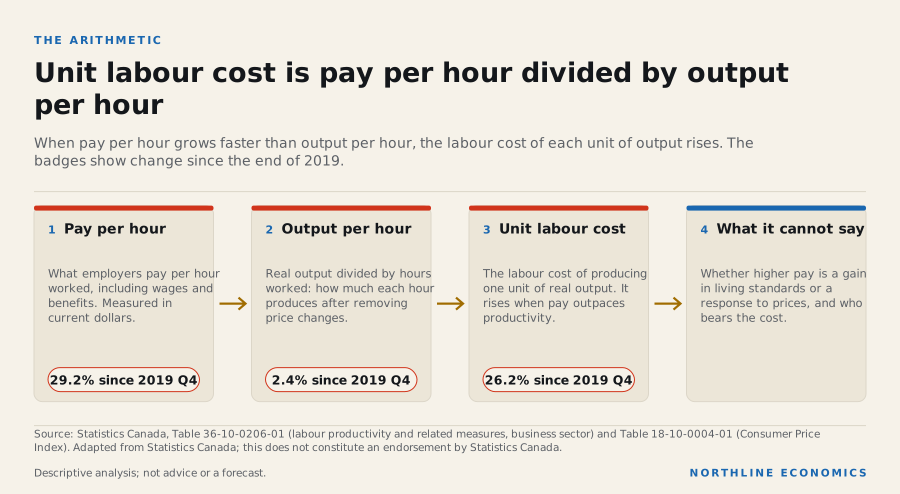
When pay per hour grows faster than output per hour, the labour cost of each unit of output rises. That is the definition of unit labour cost, and the arithmetic is simple enough to draw.
The data behind this graphic
| Step | What happens |
|---|---|
| Pay per hour | What employers pay per hour worked, including wages and benefits. Measured in current dollars. |
| Output per hour | Real output divided by hours worked: how much each hour produces after removing price changes. |
| Unit labour cost | The labour cost of producing one unit of real output. It rises when pay outpaces productivity. |
| What it cannot say | Whether higher pay is a gain in living standards or a response to prices, and who bears the cost. |
Part of the gap reflects ordinary inflation. Compensation is measured in current dollars and output per hour in real terms, so rising prices alone will open a gap between them. The charts do not separate that effect from any real change in the share of income going to labour, and the consumer price comparison above is only a rough guide to how much of the gap prices explain.
The twelve-month change in unit labour cost was 3.2% in the latest quarter and productivity grew 1.2% over the same year.
A series that swings
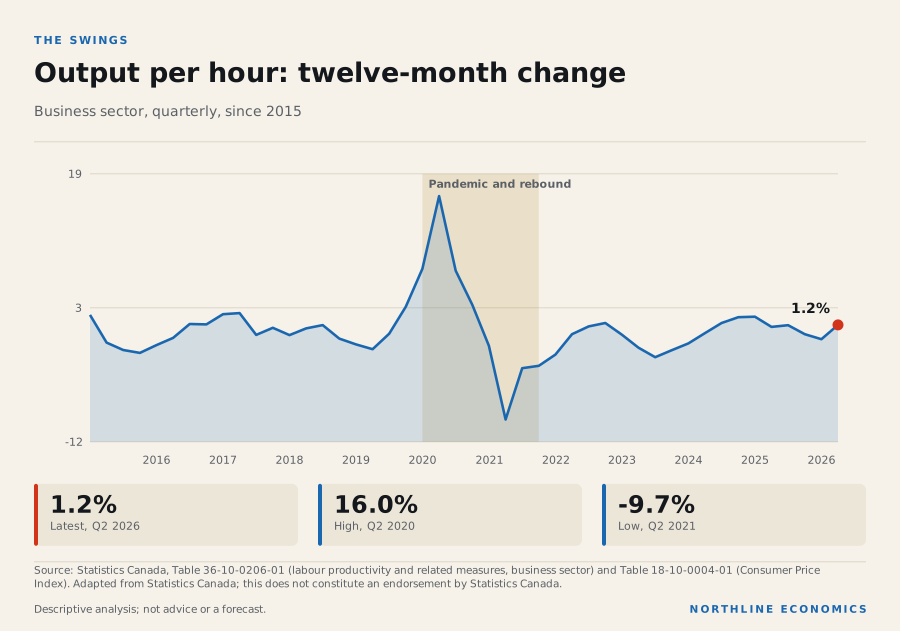
Productivity is not a smooth line. In the pandemic it jumped, and it then fell back.
The data behind this graphic
| Period | Value |
|---|---|
| 2026-04 | 1.19 |
| 2026-01 | -0.46 |
| 2025-10 | 0.12 |
| 2025-07 | 1.15 |
| 2025-04 | 0.96 |
| 2025-01 | 2.13 |
| 2024-10 | 2.07 |
| 2024-07 | 1.4 |
| 2024-04 | 0.24 |
| 2024-01 | -0.94 |
| 2023-10 | -1.72 |
| 2023-07 | -2.52 |
| 2023-04 | -1.43 |
| 2023-01 | 0.06 |
| 2022-10 | 1.4 |
| 2022-07 | 1.01 |
| 2022-04 | 0.12 |
| 2022-01 | -2.22 |
| 2021-10 | -3.51 |
| 2021-07 | -3.79 |
| 2021-04 | -9.67 |
| 2021-01 | -1.21 |
| 2020-10 | 3.49 |
| 2020-07 | 7.41 |
The twelve-month change in output per hour reached 16.0% in Q2 2020 and fell to -9.7% in Q2 2021.
Neither extreme says much about the underlying capacity of the economy. They likely reflect a sudden change in which hours were counted. That reading of the pandemic swing is Northline’s interpretation of how composition changes affect a ratio; the series itself does not break out the composition of hours.
What this does and does not mean
A gap between pay and output per hour is sometimes read as a sign of a squeeze on firms, or of a shift in income from owners to workers. The data here cannot say either, for three reasons.
First, as above, prices alone open a gap. Second, compensation includes employer benefits and payroll costs, not just take-home pay. Third, the business sector is an aggregate: some industries have seen output per hour rise strongly while others have not, and averages hide that.
What the data do establish is more modest and still useful. Since the end of 2019, unit labour cost is up 26.2%, consumer prices are up 24.6% over a slightly different span, and output per hour is up 2.4%. The labour cost of each unit of output has risen at about the pace of prices, with almost none of the rise matched by output per hour.
The data behind this graphic
| Indicator | Place | Latest | Period | Change |
|---|---|---|---|---|
| Pay per hour (index, 2017 = 100) | Canada | 141.4 | Q2 2026 | +4.4% on a year earlier |
| Output per hour (index, 2017 = 100) | Canada | 105.3 | Q2 2026 | +1.2% on a year earlier |
| Unit labour cost (index, 2017 = 100) | Canada | 134.3 | Q2 2026 | +3.2% on a year earlier |
| Consumer prices, 12-month change | Canada | 3.1% | September 2026 | +0.7 points on a year earlier |
Canada against the world
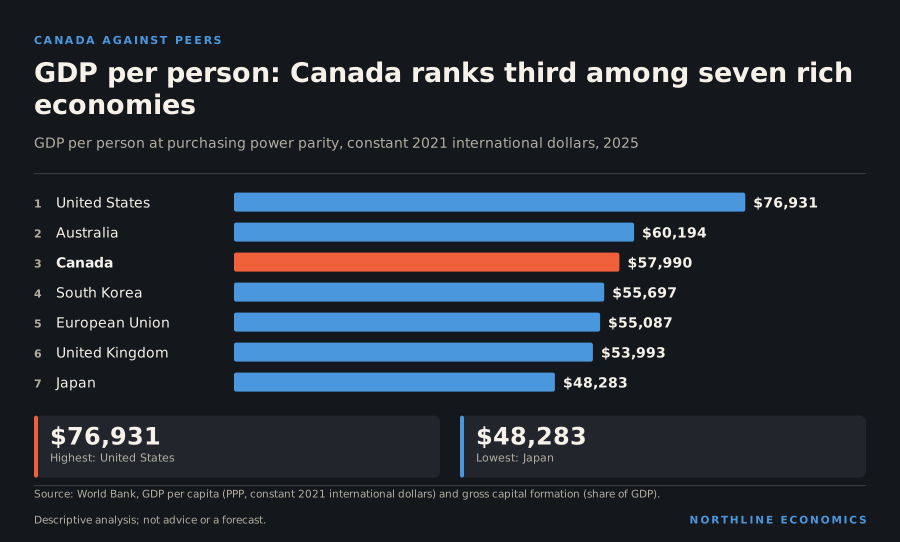
Productivity is a domestic story, but it has a foreign benchmark. The most common way to compare living standards across countries is GDP per person, adjusted for differences in prices so that a dollar buys the same amount everywhere. On that measure Canadians produced $57,990 of output each in 2025. The United States stood at $76,931, Australia at $60,194, South Korea at $55,697, the European Union at $55,087, the United Kingdom at $53,993 and Japan at $48,283.
The data behind this graphic
| Item | Value |
|---|---|
| United States | $76,931 |
| Australia | $60,194 |
| Canada | $57,990 |
| South Korea | $55,697 |
| European Union | $55,087 |
| United Kingdom | $53,993 |
| Japan | $48,283 |
Canada ranks third of the seven, ahead of South Korea, the European Union, the United Kingdom and Japan, and well behind the United States. That is not alarming in itself. The more telling comparison is the direction of travel.
Slower growth since 2000
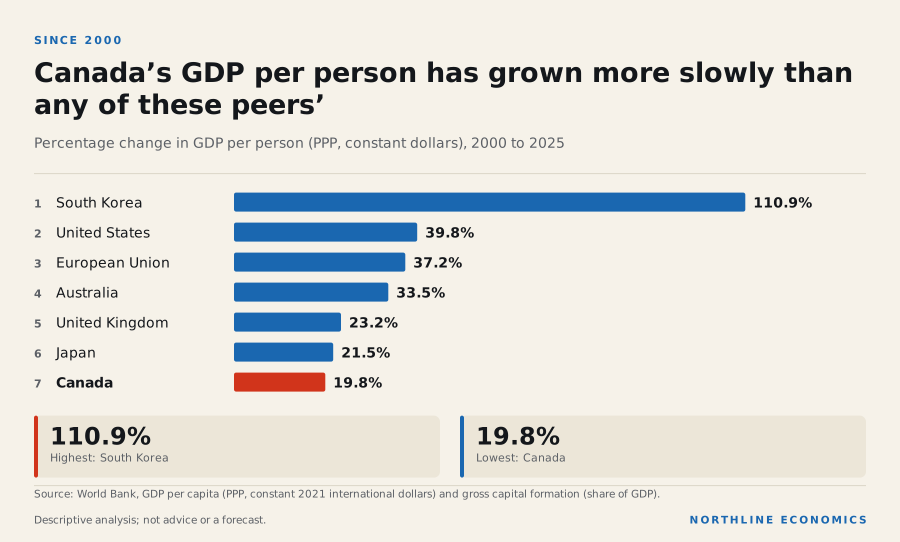
Between 2000 and 2025, GDP per person rose 19.8% in Canada, against 39.8% in the United States, 37.2% in the European Union and 33.5% in Australia. Only Japan, at 21.5%, and the United Kingdom, at 23.2%, grew by a similar amount. South Korea, starting from a much lower base, grew 110.9%.
The data behind this graphic
| Item | Value |
|---|---|
| South Korea | 110.9% |
| United States | 39.8% |
| European Union | 37.2% |
| Australia | 33.5% |
| United Kingdom | 23.2% |
| Japan | 21.5% |
| Canada | 19.8% |
A peer group chosen differently would show a different ranking, and a convergence story (poorer countries growing faster as they catch up) explains Korea’s figure and not Canada’s. What the comparison supports is narrower: over this period Canada did not keep pace with the richer economies that started near it.
The data behind this graphic
| Series | Latest |
|---|---|
| United States | $76,931, 2025 |
| Canada | $57,990, 2025 |
| European Union | $55,087, 2025 |
| United Kingdom | $53,993, 2025 |
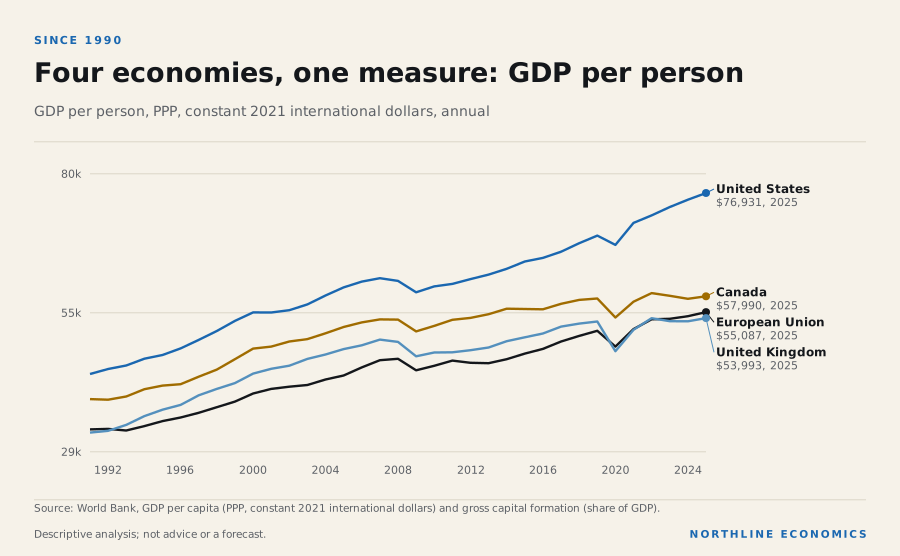
The lines show where the gap with the United States opened. In 1990, GDP per person was $40,475 in Canada and $44,384 in the United States; by 2025 the figures were $57,990 and $76,931.
Output per person at home
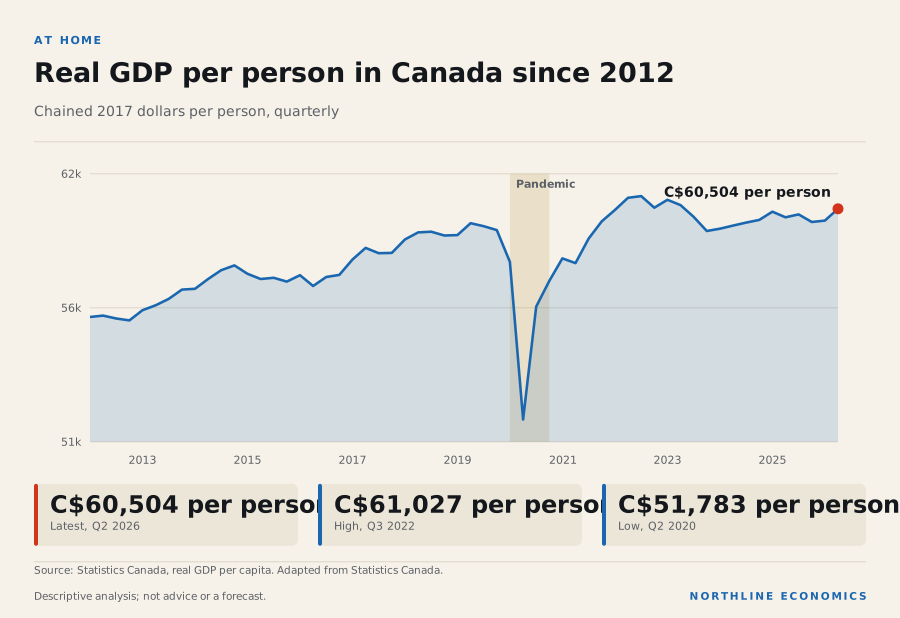
Closer to home, the same picture appears in a different measure. Real GDP in Canada was C$60,504 per person in Q2 2026. That is 5.8% higher than at the start of 2014 and only 1.5% higher than at the end of 2019. It peaked at C$61,027 per person in Q3 2022, and the latest figure sits 0.9% below that peak.
The data behind this graphic
| Period | Value |
|---|---|
| 2026-04 | 60504 |
| 2026-01 | 60014 |
| 2025-10 | 59955 |
| 2025-07 | 60270 |
| 2025-04 | 60151 |
| 2025-01 | 60383 |
| 2024-10 | 60045 |
| 2024-07 | 59932 |
| 2024-04 | 59808 |
| 2024-01 | 59678 |
| 2023-10 | 59585 |
| 2023-07 | 60173 |
| 2023-04 | 60656 |
| 2023-01 | 60877 |
| 2022-10 | 60548 |
| 2022-07 | 61027 |
| 2022-04 | 60956 |
| 2022-01 | 60455 |
| 2021-10 | 59986 |
| 2021-07 | 59274 |
| 2021-04 | 58255 |
| 2021-01 | 58450 |
| 2020-10 | 57517 |
| 2020-07 | 56455 |
This is the productivity story seen from a different side. Real business-sector output has grown, as the earlier chart showed, but the population grew 10.5% from the end of 2019 to 1 July 2026, and so output per person has barely moved. The business-sector figures for output per hour and the national figures for output per person tell the same story from two directions.
Is Canada simply not investing enough?
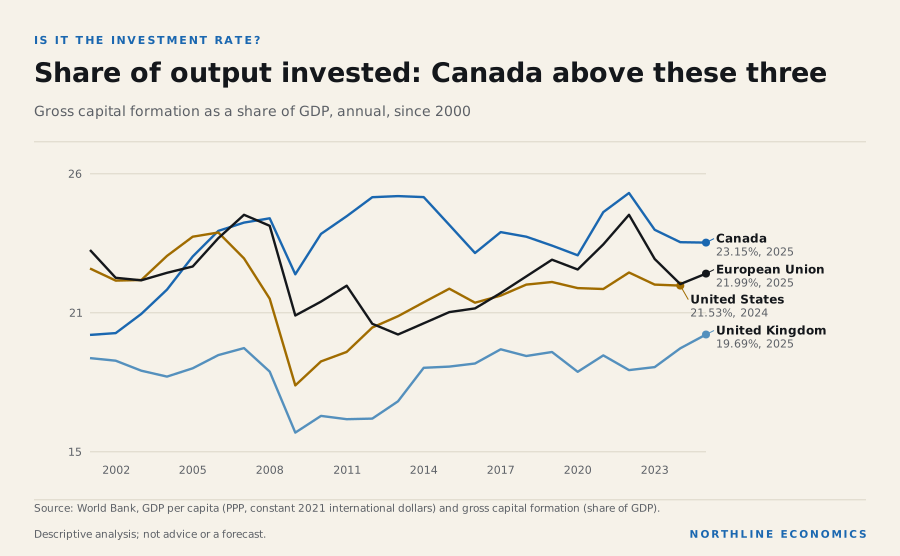
A common explanation for weak productivity is weak investment: workers equipped with less capital produce less per hour. The data do not support a simple version of that story. In 2025, gross capital formation, the share of output that goes into buildings, machinery and other durable assets, was 23.2% of GDP in Canada. It was 21.5% in the United States (2024), 22.0% in the European Union and 19.7% in the United Kingdom.
The data behind this graphic
| Series | Latest |
|---|---|
| Canada | 23.15%, 2025 |
| United States | 21.53%, 2024 |
| European Union | 21.99%, 2025 |
| United Kingdom | 19.69%, 2025 |
Canada invests a larger share of its output than the United States, the European Union and the United Kingdom do, and a smaller share than Australia (24.5%), Japan (27.7% in 2024) and South Korea (29.1%). A simple version of the investment story would predict a lower share in Canada than in all its peers, and the data do not show that.
The Bank of Canada has said that businesses in Canada have been investing too little for too long, and that this is one of the main reasons for the country’s poor productivity. The share above covers all investment, not only business investment, so it does not settle the question.
Evidence: Bank of Canada: Toward a virtuous circle for productivity (speech, N. Vincent)
What the headline share cannot show is the composition of investment. Capital formation counts housing, resource extraction projects and public infrastructure as well as machinery, software and research. A country can invest heavily in assets that raise living standards without raising output per hour in the near term. Northline has not measured the composition here, so this is a reason to look further, not a finding.
Three things that look wrong and are not
Pay up 29.2%, and workers only a little better off. Pay per hour rose 29.2% since the end of 2019, while consumer prices rose 24.6% over a slightly different span. A worker whose pay tracked the business-sector average has seen purchasing power rise by only a few per cent. The headline is large because the price level moved, not because the economy found a way to pay workers much more.
Output grew faster than the economy’s ability to produce per hour. Real output is up 11.2% and hours worked are up 8.6%. When output grows mainly because people work more hours, growth comes with little gain in how much each hour produces. Since the end of 2019, it is hours, not productivity, that did most of the work.
The best year for productivity was the worst year for the economy. Output per hour jumped in the second quarter of 2020, when the economy contracted sharply. The jump says little about the economy’s capacity to produce.
A standard explanation is compositional: if the hours that disappear first are disproportionately in low-output activities, the average output of the hours that remain rises. Northline has not measured the composition of hours, so this is an interpretation.
What would change the picture
Productivity is slow to move and easy to misread, so it helps to know what to watch.
- Output per hour excluding the pandemic years. The series is dominated by the 2020 to 2021 swing, so changes after that matter more than the headline level.
- Unit labour cost against consumer prices. If unit labour cost keeps rising faster than prices, margins are being squeezed or prices must rise; if it falls behind, the opposite.
- Investment composition. The headline share does not settle the question, so the type of investment is the next thing to check.
- Hours versus output. If growth in hours slows, for example as the number of temporary residents falls, growth in output must come from productivity or not at all. The companion note on population flows sets out how temporary-resident flows have reversed.
Each of these series is in the Northline data library and can be followed from the Monitoring page.
What this means for decisions
For employers, unit labour cost is a measure of cost pressure that does not depend on any single wage settlement. A rising unit labour cost combined with weak productivity growth raises the value of investments that raise output per hour.
For policymakers, the contrast between hours and output per hour is the central fact of growth since 2019, though in the latest year hours were flat. Growth driven mainly by more hours is limited by how many hours there are to add.
For workers and households, pay per hour is up 29.2% and consumer prices 24.6% over this period in aggregate, which is why a headline wage increase does not by itself mean a gain in purchasing power.
Northline does not offer advice. The comparison is a description of what the aggregate data show.
Method
Business-sector indices (2017 = 100) are read from Statistics Canada table 36-10-0206-01 and consumer prices from table 18-10-0004-01. Changes since the fourth quarter of 2019 are computed from the index values; the consumer price change runs from December 2019 to the latest month. Source: Adapted from Statistics Canada. This does not constitute an endorsement by Statistics Canada.
Keep exploring
- /canada/#productivity
- Explore the related relationships
- How a Bank of Canada decision reaches your mortgage, and why it takes time
- One customer, many products: Canada’s goods trade with the United States
- Three ways to grow or shrink: the flows behind each province’s population
Related research
Sources, method and limits
- Limitations
- Business-sector aggregate only. Compensation per hour includes wages and employer benefits and is not the same as take-home pay. The comparison is between indices from a common base year, so it does not say which level is right, only how they diverged. Compensation is in current dollars and output per hour in real terms, so price changes alone open a gap between them.
- Preparation
- Prepared by the Northline research desk with AI assistance; every figure is read from the data library or a cited source at build time.
Data
- Indexes of business sector labour productivity, unit labour cost and related measures, seasonally adjusted (36-10-0206-01; 7 series; latest Q2 2026; retrieved 2026-10-23). Adapted from Statistics Canada, Indexes of business sector labour productivity, unit labour cost and related measures, seasonally adjusted, Table 36-10-0206-01. This does not constitute an endorsement by Statistics Canada.
- Consumer Price Index, monthly, not seasonally adjusted (18-10-0004-01; 1 series; latest September 2026; retrieved 2026-10-23). Adapted from Statistics Canada, Consumer Price Index, monthly, not seasonally adjusted, Table 18-10-0004-01. This does not constitute an endorsement by Statistics Canada.
- GDP per capita, PPP (constant 2021 international $): Canada (WDI NY.GDP.PCAP.PP.KD; 7 series; latest 2025; retrieved 2026-11-05). Source: World Bank, World Development Indicators, NY.GDP.PCAP.PP.KD (GDP per capita, PPP (constant 2021 international $)), updated 2026-10-08. CC BY 4.0; no changes to values. Underlying source: International Comparison Program (ICP), World Bank (WB), uri: https://www.worldbank.org/en/programs/icp/data, note: This information is for ICP’s PPPs utilized in WDI, publisher: International Compari.
- Gross domestic product, expenditure-based, Canada, quarterly (36-10-0104-01; 1 series; latest Q2 2026; retrieved 2026-10-23). Adapted from Statistics Canada, Gross domestic product, expenditure-based, Canada, quarterly, Table 36-10-0104-01. This does not constitute an endorsement by Statistics Canada. and Statistics Canada, Population estimates, quarterly, Table 17-10-0009-01. This does not constitute an endorsement by Statistics Canada.
- Population estimates, quarterly (17-10-0009-01; 1 series; latest 1 July 2026; retrieved 2026-10-23). Adapted from Statistics Canada, Population estimates, quarterly, Table 17-10-0009-01. This does not constitute an endorsement by Statistics Canada.
- Gross capital formation (investment): Canada (WDI NE.GDI.TOTL.ZS; 7 series; latest 2025; retrieved 2026-11-05). Source: World Bank, World Development Indicators, NE.GDI.TOTL.ZS (Gross capital formation (% of GDP)), updated 2026-10-08. CC BY 4.0; no changes to values. Underlying source: Country official statistics, National Statistical Organizations and/or Central Banks;.
Documents
- Bank of Canada: Toward a virtuous circle for productivity (speech, N. Vincent) (retrieved 2026-10-25)
- Statistics Canada, Table 36-10-0206-01, Labour productivity and related measures by business sector industry (retrieved 2026-10-22)
- World Bank, World Development Indicators: GDP per capita, PPP (constant 2021 international $) and gross capital formation (% of GDP) (retrieved 2026-10-23)
Approved by an editor on 2026-11-09; published 2026-11-09. See the corrections log.