Research · United States · World
How a Bank of Canada decision reaches your mortgage, and why it takes time
Almost nobody pays the policy rate. Between a decision in Ottawa and a payment at the kitchen table sit bond markets, lenders and a renewal date.
By Northline research deskUpdated 2026-11-0615 min readData to 28 October 2026
The data behind this graphic
| Step | What happens |
|---|---|
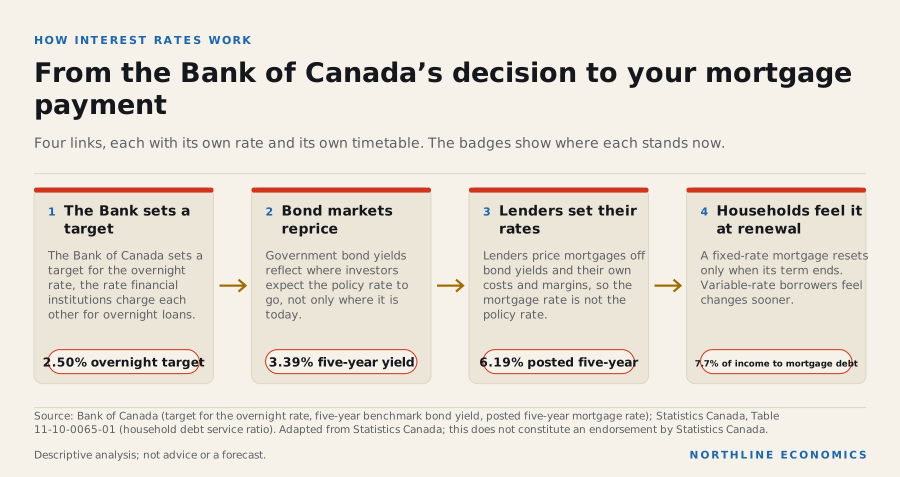
| The Bank sets a target | The Bank of Canada sets a target for the overnight rate, the rate financial institutions charge each other for overnight loans. |
| Bond markets reprice | Government bond yields reflect where investors expect the policy rate to go, not only where it is today. |
| Lenders set their rates | Lenders price mortgages off bond yields and their own costs and margins, so the mortgage rate is not the policy rate. |
| Households feel it at renewal | A fixed-rate mortgage resets only when its term ends. Variable-rate borrowers feel changes sooner. |
The rate nobody pays
When the Bank of Canada announces a decision, the number in the headline is the overnight target rate. At the time of writing it is 2.50%. It is the interest rate the Bank wants financial institutions to charge each other on one-day loans, and the public does not borrow in that market.
Evidence: Bank of Canada: Understanding our policy interest rate (explainer)
What people pay is something else: a mortgage rate, a line-of-credit rate, a lease. The posted five-year mortgage rate is 6.19%, about two and a half times the policy rate. The gap is not an error. It is the sum of everything that sits between a central bank decision and a loan: what investors expect the policy rate to do, what it costs a lender to raise money, the risk of the borrower, and the lender’s margin.
This note follows that chain one link at a time, using the published data for each, and ends where the policy rate actually lands: on the household’s budget.
Link one: the target and the inflation goal
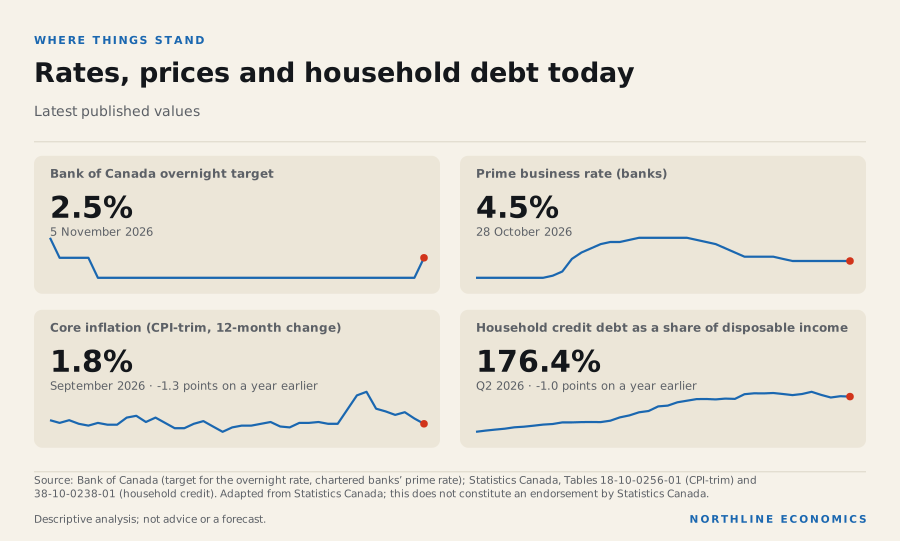
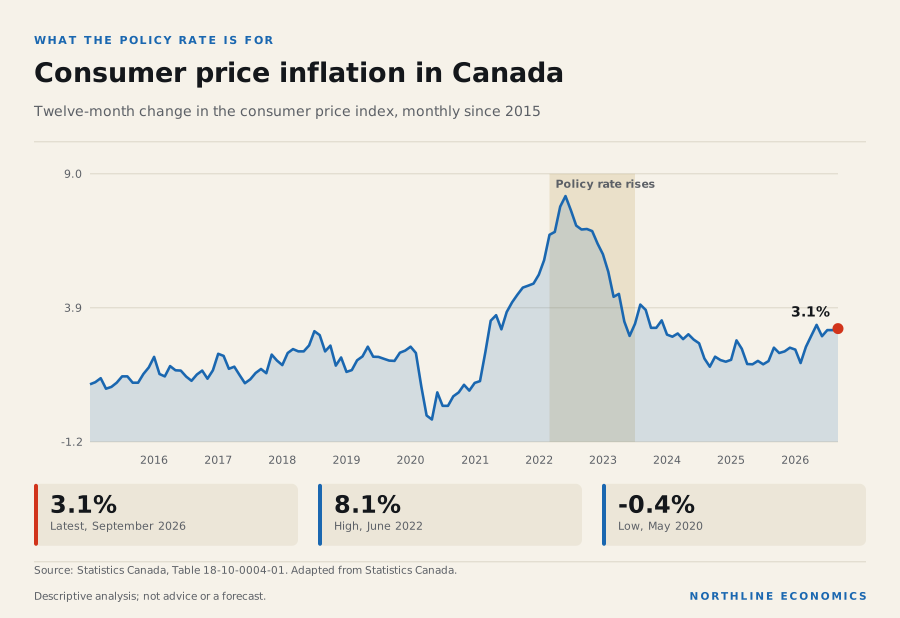
The Bank of Canada’s stated aim is to keep inflation near 2%, within a control range of 1% to 3%. If growth could push inflation up, the Bank says it might raise its target rate; if a weak economy could pull inflation down, it might lower it. Consumer prices rose 3.1% in the twelve months to September 2026, and a core measure, CPI-trim, rose 1.8%.
Evidence: Bank of Canada: Understanding our policy interest rate (explainer)
The data behind this graphic
| Indicator | Place | Latest | Period | Change |
|---|---|---|---|---|
| Bank of Canada overnight target | Canada | 2.5% | 5 November 2026 | |
| Prime business rate (banks) | Canada | 4.5% | 28 October 2026 | |
| Core inflation (CPI-trim, 12-month change) | Canada | 1.8% | September 2026 | -1.3 points on a year earlier |
| Household credit debt as a share of disposable income | Canada | 176.4% | Q2 2026 | -1.0 points on a year earlier |
The target has not been static. It stood at 0.25% in early 2022, rose through to a peak of 5.00% on 13 July 2023, came down to 2.25% and, with the decision of 28 October 2026, went back up to 2.50%. That is a very large swing in a short time, and it is the reason this chain matters: the same decision lands differently depending on how far along each link a household is.
Evidence: Bank of Canada: Bank of Canada raises the policy rate by 25 basis points to 2½% (28 October 2026)
Link two: bond markets look ahead
Between the overnight rate and a mortgage sit government bond yields, which Bank of Canada staff say directly influence the interest rates charged on mortgages and business loans. The Bank says a policy-rate change can affect long-term rates, especially if people expect that change to be long-lasting, so a five-year bond yield reflects expectations about short-term rates, along with other factors, rather than the current policy rate alone. That is why the five-year yield can move before the Bank does, and why it can stay put when the Bank moves in line with expectations.
Evidence: Bank of Canada: The rise in the Canadian term premium in a global context (Sparks at Bank article by Eugene Trostin, James Ketcheson and Antonio Diez de los Rios, March 2026); Bank of Canada: What’s behind your mortgage rate (The Economy, Plain and Simple)
The data behind this graphic
| Series | Latest |
|---|---|
| Overnight target | 2.50%, 5 November 2026 |
| Five-year bond yield | 3.39%, 5 November 2026 |
| Posted five-year mortgage | 6.19%, 28 October 2026 |
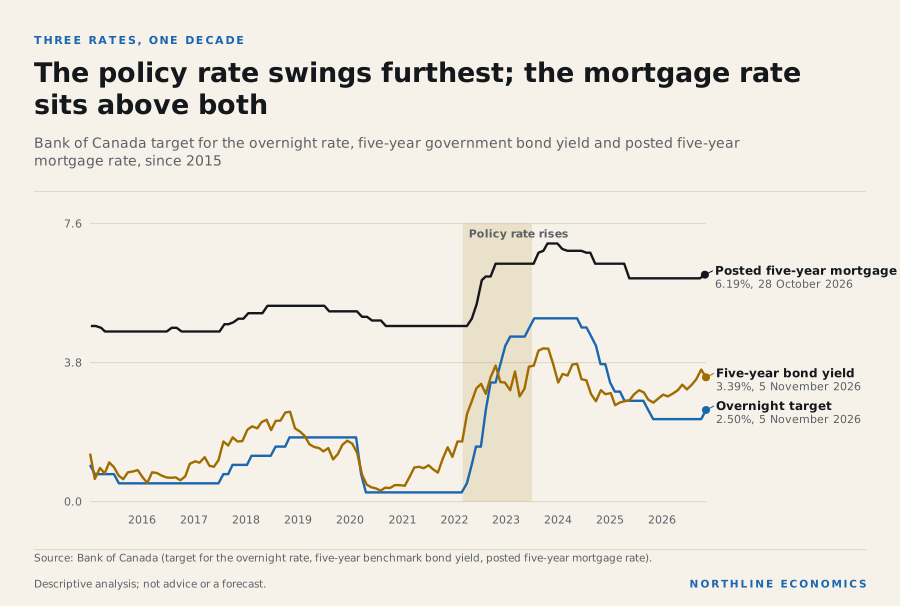
The chart puts three rates on one axis. The overnight target, the five-year bond yield and the posted five-year mortgage rate share a rough direction of travel, but they do not sit on top of one another and they do not move together by the same amount. The five-year yield stood at 3.39% on 5 November 2026. The posted mortgage rate sits well above it.
Link three: lenders add their own layer
The Bank of Canada says a lender’s funding cost makes up most of the interest rate on a mortgage, and that the lender’s operating costs and the risk that a borrower will not repay also count. In the data the difference is visible: the posted five-year mortgage rate was 6.19% on 28 October 2026 against a five-year bond yield of 3.62% on the same day.
Evidence: Bank of Canada: What’s behind your mortgage rate (The Economy, Plain and Simple)
The gap between the posted rate and the bond yield is not a constant, and Northline draws no causal conclusion from the comparison. One reading is that lender margins and funding costs, not only the Bank’s decisions, shape what borrowers face. The posted rate is also a benchmark, not what most borrowers actually negotiate, so it should be read as an indicator and not as an offer.
For businesses the equivalent benchmark is the prime rate, which stood at 4.45% on 28 October 2026, before the increase took effect. Many business loans and lines of credit are priced as a spread over prime, which is itself set by the banks in relation to the policy rate.
Evidence: Bank of Canada: Tiff Macklem, Governor: Monetary policy at work, remarks to CFA Québec (7 February 2023); Bank of Canada: Understanding our policy interest rate (explainer)
Link four: the household feels it at renewal
Here the chain becomes personal. A household with a fixed-rate mortgage is protected from rate changes until its term ends. At renewal the new rate applies to the remaining balance, and the payment resets. A household with a variable-rate mortgage feels changes sooner. How much a rate decision matters to a household therefore depends on when it renews, which these national series cannot show.
Evidence: Bank of Canada: Tiff Macklem, Governor: Monetary policy at work, remarks to CFA Québec (7 February 2023); Bank of Canada: What’s behind your mortgage rate (The Economy, Plain and Simple)
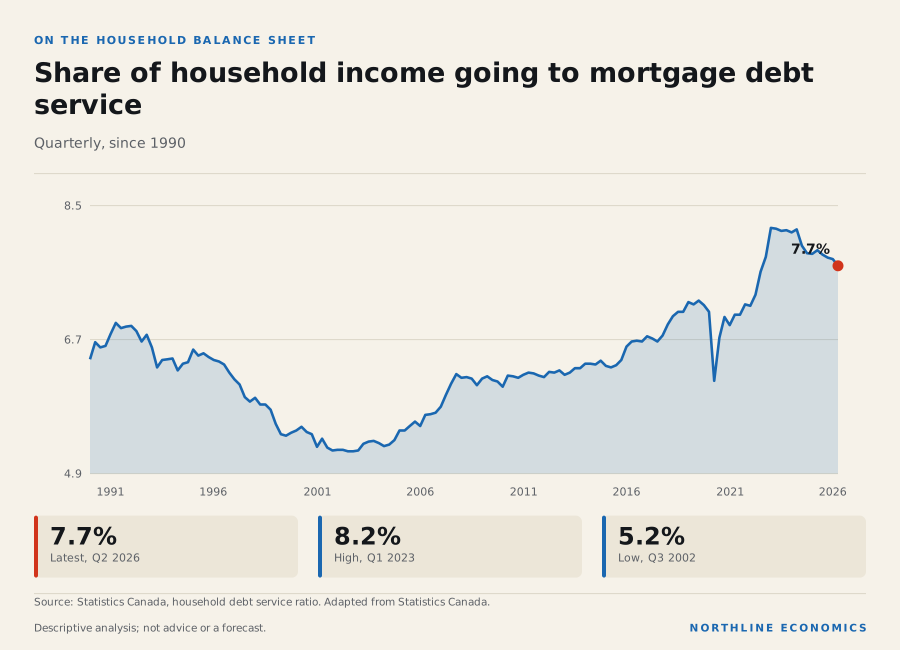
What the data do show is the weight of debt that interest rates act on. Household credit debt was 176.4% of disposable income in Q2 2026. A narrower measure, mortgage and consumer credit liabilities, was 168.0% of disposable income in the latest quarter, against 162.9% in early 2015.
The data behind this graphic
| Period | Value |
|---|---|
| 2026-04 | 7.72 |
| 2026-01 | 7.81 |
| 2025-10 | 7.83 |
| 2025-07 | 7.87 |
| 2025-04 | 7.93 |
| 2025-01 | 7.88 |
| 2024-10 | 7.89 |
| 2024-07 | 7.99 |
| 2024-04 | 8.21 |
| 2024-01 | 8.17 |
| 2023-10 | 8.2 |
| 2023-07 | 8.19 |
| 2023-04 | 8.22 |
| 2023-01 | 8.23 |
| 2022-10 | 7.84 |
| 2022-07 | 7.64 |
| 2022-04 | 7.33 |
| 2022-01 | 7.18 |
| 2021-10 | 7.2 |
| 2021-07 | 7.06 |
| 2021-04 | 7.06 |
| 2021-01 | 6.92 |
| 2020-10 | 7.03 |
| 2020-07 | 6.75 |
The share of household income going to mortgage debt service was 7.7% in Q2 2026. It reached 8.2% in Q1 2023, the highest in the last thirty years of this series, and 5.2% at its low in Q3 2002.
The data behind this graphic
| Item | January 2022 | Latest |
|---|---|---|
| Overnight target | 0.25% | 2.50% |
| Five-year bond yield | 1.39% | 3.39% |
| Posted five-year mortgage | 4.79% | 6.19% |
| Mortgage debt service (share of income) | 7.2% | 7.7% |
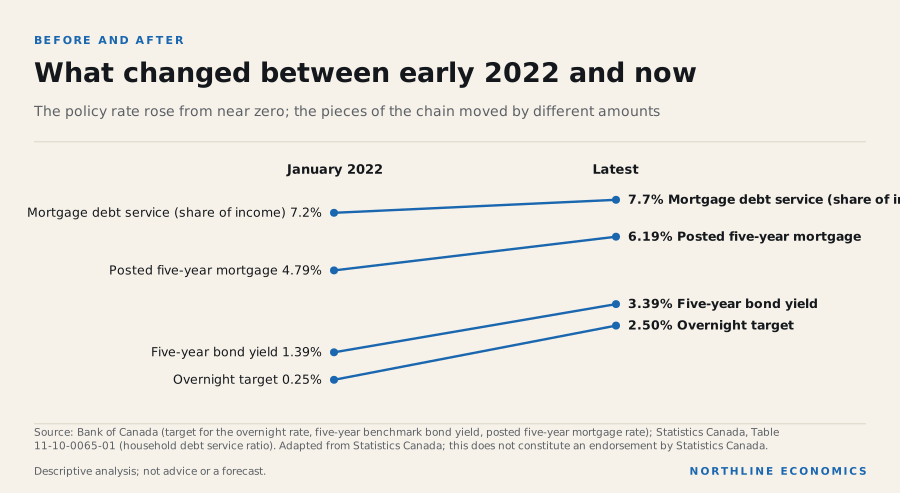
Compare early 2022 with today. The overnight target went from 0.25% to 2.50%. The five-year yield went from 1.39% to 3.39% and the posted mortgage rate from 4.79% to 6.19%. The share of income going to mortgage debt service moved from 7.2% to 7.7%. Each link moved by a different amount. The share of income going to debt service moved by a fraction of a point, far less than any of the interest rates did.
A renewal timetable, in which many borrowers have not yet reset to today’s rates, would produce a pattern like this. The national data cannot show whether it is the explanation.
What the price index shows
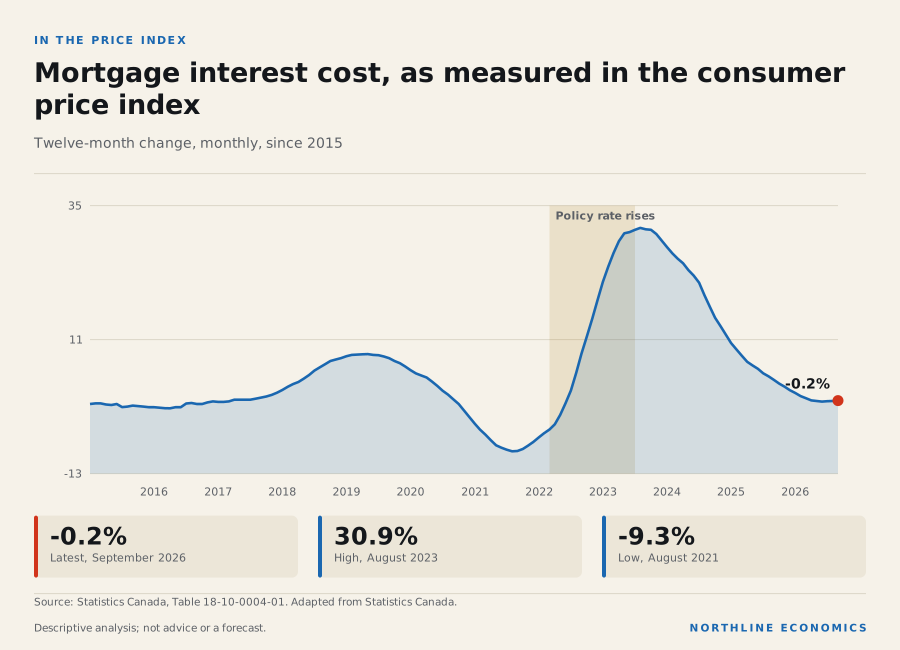
Mortgage interest cost is a component of the consumer price index. Statistics Canada says it estimates the interest owed on mortgage balances, and that new interest rates reach it only through mortgages newly initiated or renegotiated, generally a small share of existing mortgages. So it responds slowly and in a drawn-out way.
The data behind this graphic
| Period | Value |
|---|---|
| 2026-09 | -0.16 |
| 2026-08 | -0.22 |
| 2026-07 | -0.27 |
| 2026-06 | -0.33 |
| 2026-05 | -0.22 |
| 2026-04 | -0.11 |
| 2026-03 | 0.28 |
| 2026-02 | 0.66 |
| 2026-01 | 1.22 |
| 2025-12 | 1.72 |
| 2025-11 | 2.34 |
| 2025-10 | 2.91 |
| 2025-09 | 3.56 |
| 2025-08 | 4.21 |
| 2025-07 | 4.76 |
| 2025-06 | 5.56 |
| 2025-05 | 6.18 |
| 2025-04 | 6.82 |
| 2025-03 | 7.91 |
| 2025-02 | 9.03 |
| 2025-01 | 10.18 |
| 2024-12 | 11.71 |
| 2024-11 | 13.24 |
| 2024-10 | 14.72 |
Its twelve-month change reached 30.9% in August 2023, an extraordinary figure, and was -0.2% in the latest month.
One reading is that the peak reflects how many mortgages had reset to far higher rates by then. Northline has not measured resets, so this is an interpretation.
Canada is not alone
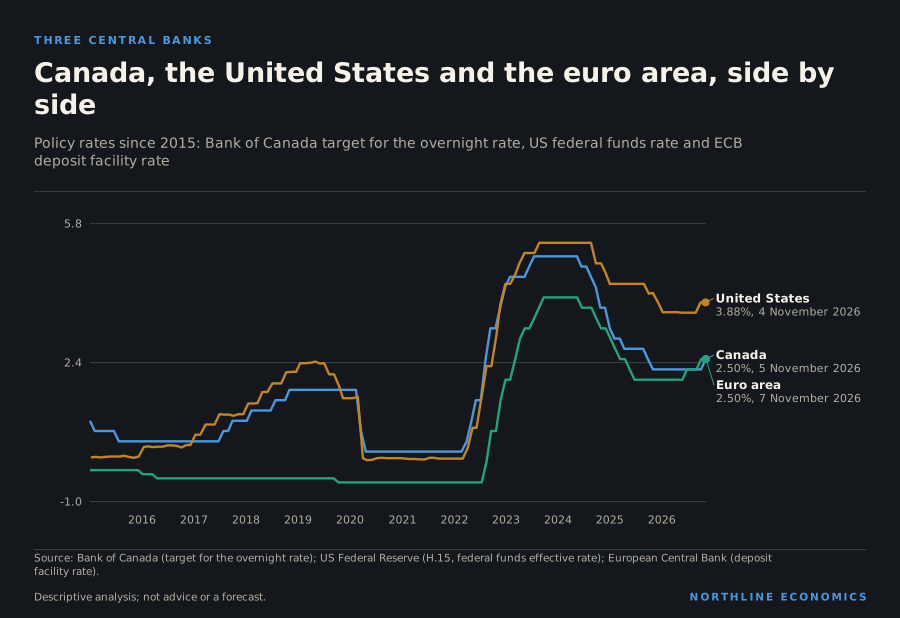
The Bank of Canada does not set rates in isolation. Its counterparts face similar decisions, and the paths they have taken are visible side by side. The overnight target is 2.50%. The United States federal funds rate is 3.88% and the European Central Bank’s deposit facility rate is 2.50%.
The data behind this graphic
| Series | Latest |
|---|---|
| Canada | 2.50%, 5 November 2026 |
| United States | 3.88%, 4 November 2026 |
| Euro area | 2.50%, 7 November 2026 |
The three followed the same broad route: very low rates through the pandemic (the euro area’s deposit rate was below zero, at -0.50% at its low), a steep climb from 2022, a plateau, a descent and, in 2026, increases at all three. They did not move on the same dates or by the same amounts. At the peak, the Bank of Canada’s target was 5.00%, on 13 July 2023; the US federal funds rate reached 5.33%, on 2 August 2023.
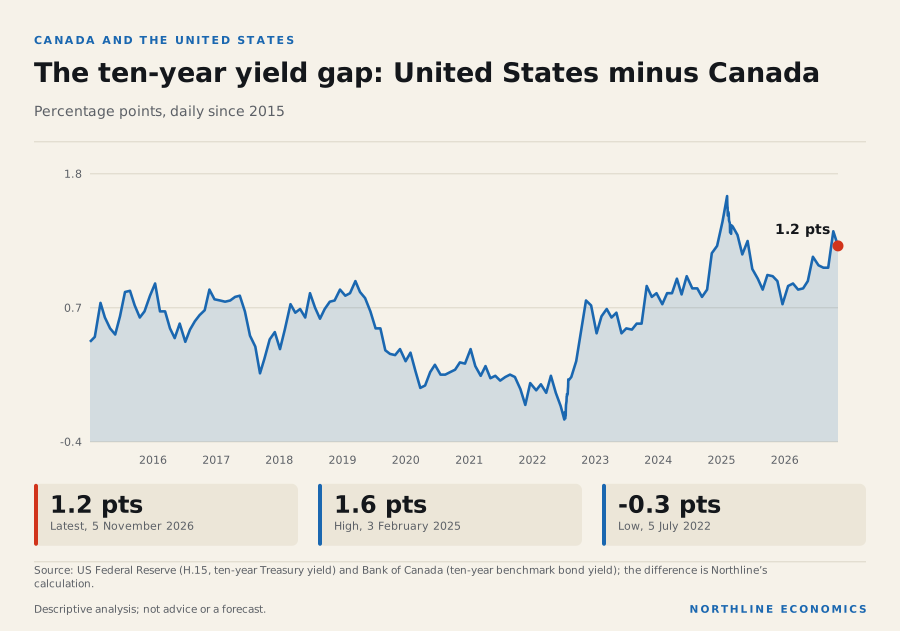
The interesting differences are in the gaps. The ten-year government bond yield in the United States stood at 4.84% and in Canada at 3.67%, a gap of 1.2 percentage points. The average gap since 2010 was 0.4 percentage points and the widest was 1.6 percentage points, on 3 February 2025.
The data behind this graphic
| Period | Value |
|---|---|
| 2026-11 | 1.17 |
| 2026-10 | 1.29 |
| 2026-09 | 0.99 |
| 2026-08 | 0.99 |
| 2026-07 | 1.01 |
| 2026-06 | 1.08 |
| 2026-05 | 0.88 |
| 2026-04 | 0.82 |
| 2026-03 | 0.81 |
| 2026-02 | 0.86 |
| 2026-01 | 0.84 |
| 2025-12 | 0.69 |
| 2025-11 | 0.88 |
| 2025-10 | 0.92 |
| 2025-09 | 0.93 |
| 2025-08 | 0.81 |
| 2025-07 | 0.9 |
| 2025-06 | 0.98 |
| 2025-05 | 1.21 |
| 2025-04 | 1.1 |
| 2025-04 | 1.26 |
| 2025-03 | 1.33 |
| 2025-02 | 1.34 |
| 2025-02 | 1.32 |
A wide gap between American and Canadian long-term yields is one factor that can influence how the Canadian dollar trades against the American dollar and what Canadian lenders pay for funds. This note does not measure either link, and the gap has several possible causes, including different growth and inflation outlooks and the supply of government bonds.
What the bond market was saying
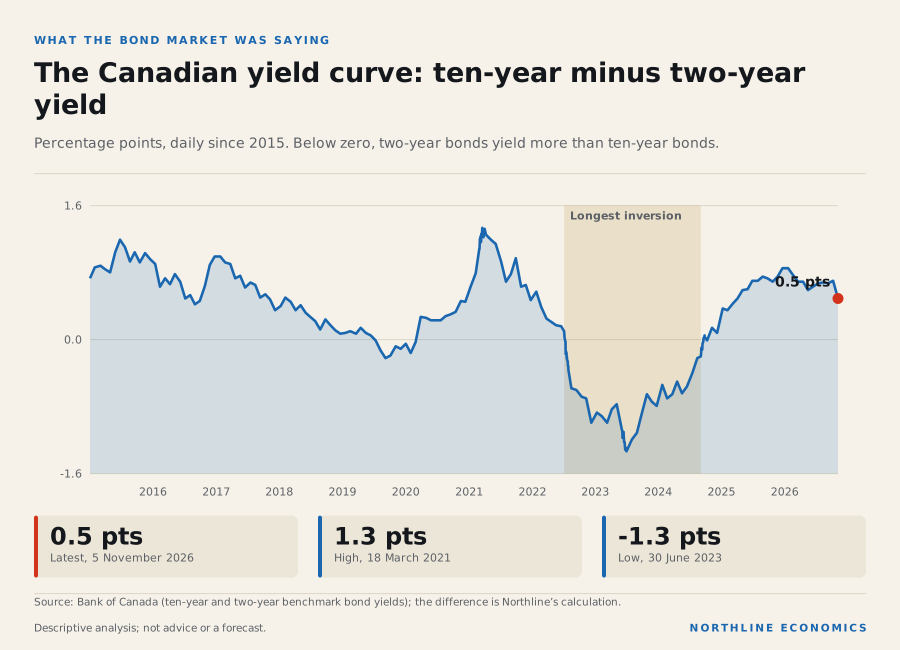
An earlier link in the chain, the shape of the yield curve, carries information about market expectations: the Bank of Canada has said bond yields can tell us what investors think about the prospects for growth and inflation. Normally longer-term bonds yield more than shorter-term ones. When short-term yields move above long-term yields, the curve is said to be inverted, which the Bank said is often seen as a sign that a recession is imminent, while adding that no indicator is perfect.
The data behind this graphic
| Period | Value |
|---|---|
| 2026-11 | 0.5 |
| 2026-10 | 0.71 |
| 2026-09 | 0.68 |
| 2026-08 | 0.69 |
| 2026-07 | 0.68 |
| 2026-06 | 0.64 |
| 2026-05 | 0.6 |
| 2026-04 | 0.7 |
| 2026-03 | 0.7 |
| 2026-02 | 0.78 |
| 2026-01 | 0.86 |
| 2025-12 | 0.86 |
| 2025-11 | 0.76 |
| 2025-10 | 0.7 |
| 2025-09 | 0.74 |
| 2025-08 | 0.76 |
| 2025-07 | 0.71 |
| 2025-06 | 0.71 |
| 2025-05 | 0.61 |
| 2025-05 | 0.6 |
| 2025-04 | 0.5 |
| 2025-03 | 0.44 |
| 2025-02 | 0.36 |
| 2025-01 | 0.38 |
The curve slope, ten-year minus two-year, is 0.5 percentage points now. It fell to -1.3 percentage points on 30 June 2023, the deepest inversion in this record. The longest unbroken stretch below zero ran from July 2022 to September 2024.
An inversion is a signal that markets expected the Bank to cut rates, not a forecast that it would, and it has not always been followed by a downturn. It is useful as a statement of what investors were pricing, not of what happened next.
The thing the policy rate is for
Behind every decision is the inflation target. Consumer prices rose 3.1% in the twelve months to September 2026, against a target of 2% and a control range of 1% to 3%.
The data behind this graphic
| Period | Value |
|---|---|
| 2026-09 | 3.09 |
| 2026-08 | 3.03 |
| 2026-07 | 3.03 |
| 2026-06 | 2.8 |
| 2026-05 | 3.23 |
| 2026-04 | 2.82 |
| 2026-03 | 2.39 |
| 2026-02 | 1.78 |
| 2026-01 | 2.29 |
| 2025-12 | 2.36 |
| 2025-11 | 2.22 |
| 2025-10 | 2.16 |
| 2025-09 | 2.36 |
| 2025-08 | 1.85 |
| 2025-07 | 1.73 |
| 2025-06 | 1.86 |
| 2025-05 | 1.73 |
| 2025-04 | 1.74 |
| 2025-03 | 2.32 |
| 2025-02 | 2.64 |
| 2025-01 | 1.9 |
| 2024-12 | 1.83 |
| 2024-11 | 1.89 |
| 2024-10 | 2.02 |
The peak in inflation, 8.1% in June 2022, came before the policy rate reached its own peak, which is the sequence a tightening cycle would produce: prices rise, the Bank responds, and rates peak after inflation does. The chart does not show that rates caused inflation to fall; other forces, including falling energy prices, also acted.
Business borrowing and the prime rate
Everything so far has concerned households. For businesses the link is shorter. The prime business rate set by the chartered banks was 4.45% on 28 October 2026, before the increase took effect, when the overnight target was 2.25%. Many business loans and lines of credit are priced as a margin over prime. Prime follows the policy rate at a roughly steady margin, so the cost of a floating-rate business loan changes soon after the Bank acts, which is why variable-rate borrowers feel its decisions first.
What this means for decisions
For households with a mortgage, the practical question is when your term ends and what the rate environment is then. The national chain says nothing about your date, but it does show how large the gap can be between the rate at signing and the rate at renewal.
For businesses that borrow at prime plus a spread, the link is shorter: the prime rate follows the policy rate closely, so the cost of a floating-rate line of credit tracks the Bank’s decisions faster than a household mortgage does.
For analysts and policymakers, the chain is a reminder that the overnight target is a lever with variable lags. The household link is the last and slowest, and the national debt-to-income ratio indicates how much sits behind it.
Northline does not offer financial advice.
What this does not show
These are national series. They do not show how many households renew in a given year, how many hold variable-rate mortgages, or how a particular city or income group is affected. They do not forecast any future decision by the Bank of Canada, and nothing in the comparison of rates establishes cause and effect.
Method
Latest values are read from the series listed in this note’s sources. The overnight target, benchmark bond yields, prime rate and posted mortgage rate come from the Bank of Canada’s published series; household credit, debt service and the consumer price index come from Statistics Canada; the US federal funds rate and Treasury yield come from the US Federal Reserve (H.15) and the euro-area deposit rate from the European Central Bank. The yield-curve slope and the US–Canada yield gap are Northline’s calculations. Reused under the Bank of Canada’s terms and the Statistics Canada Open Licence. This does not constitute an endorsement by Statistics Canada.
Keep exploring
- Canada: interest-rate dashboard
- Explore the related relationships
- Work on this in Intelligence Studio
- Same index, different cities: how new-home prices diverged after 2016
- Pay per hour has run ahead of output per hour: reading the productivity gap
Related research
Sources, method and limits
- Limitations
- National series only; household effects differ by province, income and mortgage type. The posted mortgage rate is a lender-posted benchmark, not the rate most borrowers actually receive. No claim here is a forecast, and these series cannot say how many households renew in a given year or hold variable-rate mortgages.
- Preparation
- Prepared by the Northline research desk with AI assistance; every figure is read from the data library or a cited source at build time.
Data
- Bank of Canada target for the overnight rate (business daily) (V39079; 1 series; latest 5 November 2026; retrieved 2026-11-07). Source: Bank of Canada, Target for the overnight rate (business daily) (V39079). Content reused under the Bank of Canada terms (https://www.bankofcanada.ca/terms/); changes: values unchanged.
- Conventional 5-year mortgage rate (posted) (V80691335; 1 series; latest 28 October 2026; retrieved 2026-11-03). Source: Bank of Canada, Conventional mortgage, 5-year (V80691335). Content reused under the Bank of Canada terms (https://www.bankofcanada.ca/terms/); changes: values unchanged.
- Consumer Price Index, monthly, not seasonally adjusted (18-10-0004-01; 2 series; latest September 2026; retrieved 2026-10-23). Adapted from Statistics Canada, Consumer Price Index, monthly, not seasonally adjusted, Table 18-10-0004-01. This does not constitute an endorsement by Statistics Canada.
- Consumer Price Index (CPI) statistics, measures of core inflation and other related statistics - Bank of Canada definitions (18-10-0256-01; 1 series; latest September 2026; retrieved 2026-10-23). Adapted from Statistics Canada, Consumer Price Index (CPI) statistics, measures of core inflation and other related statistics - Bank of Canada definitions, Table 18-10-0256-01. This does not constitute an endorsement by Statistics Canada.
- Government of Canada benchmark bond yield, 5-year (BD.CDN.5YR.DQ.YLD; 1 series; latest 5 November 2026; retrieved 2026-11-07). Source: Bank of Canada, Benchmark bond yield, 5-year (BD.CDN.5YR.DQ.YLD). Content reused under the Bank of Canada terms (https://www.bankofcanada.ca/terms/); changes: values unchanged.
- Chartered banks prime business rate (V80691311; 1 series; latest 28 October 2026; retrieved 2026-11-03). Source: Bank of Canada, Prime rate (V80691311). Content reused under the Bank of Canada terms (https://www.bankofcanada.ca/terms/); changes: values unchanged.
- Household sector credit market summary table, seasonally adjusted estimates (38-10-0238-01; 2 series; latest Q2 2026; retrieved 2026-10-23). Adapted from Statistics Canada, Household sector credit market summary table, seasonally adjusted estimates, Table 38-10-0238-01. This does not constitute an endorsement by Statistics Canada.
- Debt service indicators of households, national balance sheet accounts (11-10-0065-01; 1 series; latest Q2 2026; retrieved 2026-10-25). Adapted from Statistics Canada, Debt service indicators of households, national balance sheet accounts, Table 11-10-0065-01. This does not constitute an endorsement by Statistics Canada.
- US federal funds effective rate, weekly average (Federal Reserve statistical release H.15; 3 series; latest 4 November 2026; retrieved 2026-11-07). Source: Board of Governors of the Federal Reserve System, Selected Interest Rates (H.15), Federal funds effective rate. Values unmodified; Treasury yields are Treasury-published constant-maturity estimates.
- ECB deposit facility rate (ECB FM; 1 series; latest 7 November 2026; retrieved 2026-11-07). Source: ECB statistics (Financial market data), series FM/D.U2.EUR.4F.KR.DFR.LEV. Data unmodified; retrieved 2026-11-07 through the ECB Data Portal API.
- Government of Canada benchmark bond yield, 10-year (BD.CDN.10YR.DQ.YLD; 2 series; latest 5 November 2026; retrieved 2026-11-07). Source: Bank of Canada, Benchmark bond yield, 10-year (BD.CDN.10YR.DQ.YLD). Content reused under the Bank of Canada terms (https://www.bankofcanada.ca/terms/); changes: values unchanged.
Documents
- Bank of Canada: Understanding our policy interest rate (explainer) (retrieved 2026-11-06)
- Bank of Canada: Bank of Canada raises the policy rate by 25 basis points to 2½% (28 October 2026) (retrieved 2026-11-07)
- Bank of Canada: The rise in the Canadian term premium in a global context (Sparks at Bank article by Eugene Trostin, James Ketcheson and Antonio Diez de los Rios, March 2026) (retrieved 2026-11-07)
- Bank of Canada: What’s behind your mortgage rate (The Economy, Plain and Simple) (retrieved 2026-11-06)
- Bank of Canada: Tiff Macklem, Governor: Monetary policy at work, remarks to CFA Québec (7 February 2023) (retrieved 2026-11-07)
- Statistics Canada: Shelter in the Canadian CPI: An overview, 2023 update (Prices Analytical Series, Catalogue no. 62F0014M) (retrieved 2026-11-06)
- Bank of Canada: Stephen S. Poloz, Governor: Making Sense of Markets, remarks to the Canada–UK Chamber of Commerce (5 November 2018) (retrieved 2026-11-06)
- Bank of Canada, Valet API: target for the overnight rate, benchmark bond yields and posted mortgage rate (retrieved 2026-10-22)
- Statistics Canada, Table 38-10-0238-01, Household sector credit market summary table (retrieved 2026-10-22)
- Statistics Canada, Table 18-10-0004-01, Consumer Price Index, monthly (retrieved 2026-10-22)
Approved by an editor on 2026-11-09; published 2026-11-09. See the corrections log.