Research · Ontario · Alberta
Same word, different place: why provincial, metropolitan and national data are not interchangeable
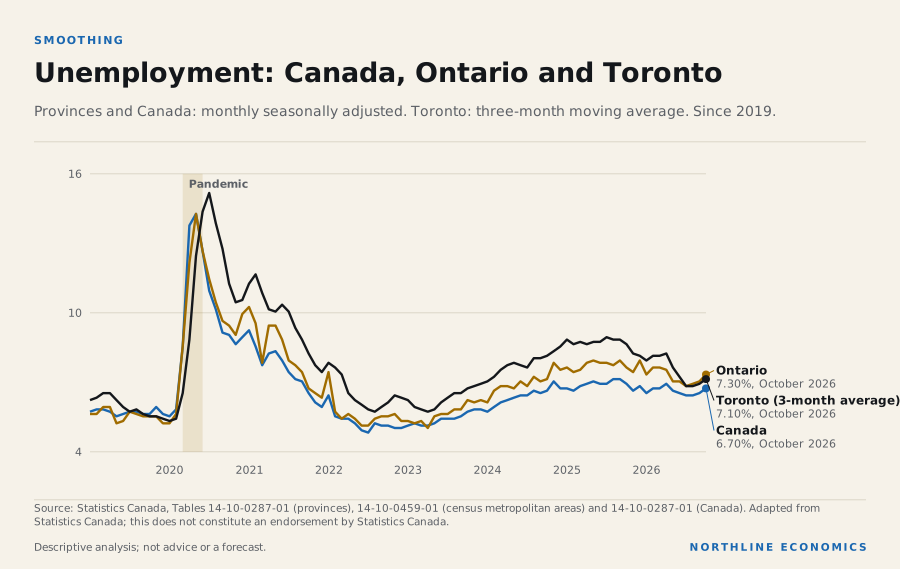
‘Toronto’s unemployment rate’ and ‘Ontario’s’ can be measured on different smoothing, different boundaries and different dates. Put on one chart without care, they mislead.
By Northline research deskUpdated 2026-11-068 min readData to October 2026
The data behind this graphic
| Series | Latest |
|---|---|
| Canada | 6.70%, October 2026 |
| Ontario | 7.30%, October 2026 |
| Toronto (3-month average) | 7.10%, October 2026 |
Summary
Statistics Canada publishes labour, price, housing and population series for provinces, census metropolitan areas (CMAs) and the country. They look alike: the same words in the title, often the same units. They are not interchangeable. This note shows four concrete cases from the agency’s tables, with the data, and explains the rule Northline follows: compare within one level and one table, and say plainly when that is not possible.
None of these cases is an error. Each is a difference in definition that is documented by the publisher and easy to miss when two series are laid side by side.
Case one: the same word, different smoothing
The data behind this graphic
| Series | Latest |
|---|---|
| Canada | 6.70%, October 2026 |
| Ontario | 7.30%, October 2026 |
| Toronto (3-month average) | 7.10%, October 2026 |
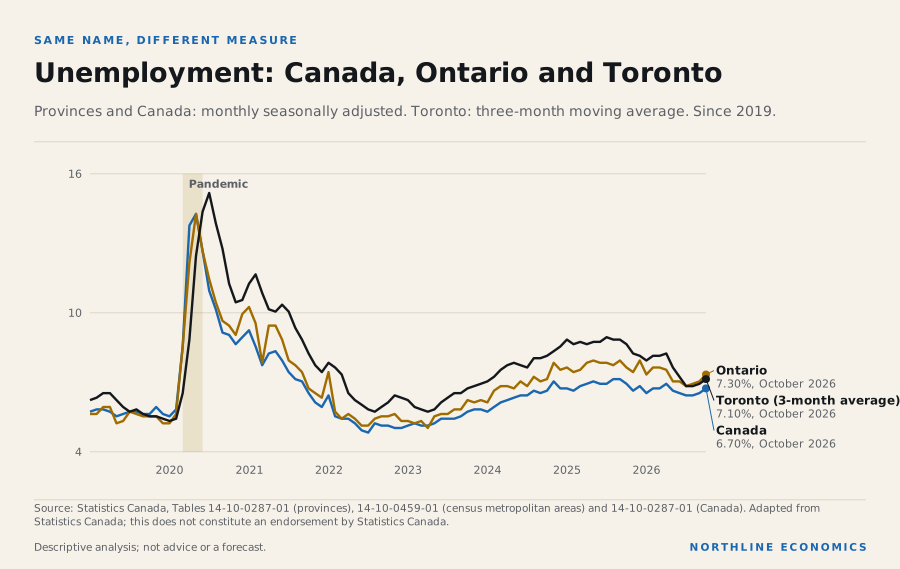
Provincial unemployment rates, and the national rate, are monthly seasonally adjusted estimates from the Labour Force Survey. Metropolitan rates come from the same survey and are published as three-month moving averages, which smooth month-to-month movements; this note uses those averages.
For Montréal, Toronto and Vancouver, Statistics Canada also publishes monthly seasonally adjusted estimates. They remove the difference in smoothing, but not the difference in boundaries.
The difference shows when conditions change quickly. In April 2020, at the start of the pandemic, Ontario’s rate was 12.1% and Canada’s 13.7%, while Toronto’s three-month average was 8.8%. In May, Ontario’s was 14.2% and Toronto’s 12.4%. Toronto’s figure had not “missed” the shock; it averaged it with two earlier months, before the rise. The average also trails on the way down: Ontario’s monthly rate peaked in May 2020, and Toronto’s three-month average not until July 2020, partly because it still included the May and June readings.
In calmer times the difference is smaller and sometimes of the opposite sign. In September 2025 Ontario’s monthly estimate was 7.9% against Toronto’s 8.8%. In the latest month, October 2026, they were 7.3% and 7.1%. A reader who compared a single month of each could conclude that Toronto’s labour market was weaker, or stronger, than the province’s, when part of the gap is smoothing.
The practical rule is that a city rate and a provincial rate can be compared in direction over a year or more, but not month by month, and the size of a gap in a single month should not be read as a finding.
Case two: a city that is published in parts
The data behind this graphic
| Indicator | Place | Latest | Period | Change |
|---|---|---|---|---|
| Consumer prices (index): Ontario part only | Ottawa–Gatineau CMA, Ontario part | 172.0 | September 2026 | +3.0% on a year earlier |
| New housing prices (index): Ontario part only | Ottawa–Gatineau CMA, Ontario part | 162.3 | September 2026 | +1.0% on a year earlier |
| Population, July 1: whole area, both provinces | Ottawa–Gatineau CMA | 1.7 million | 2025 | +2.3% on a year earlier |
| Unemployment rate, 3-month average: whole area | Ottawa–Gatineau CMA | 7.1% | October 2026 | -0.2 points on a year earlier |
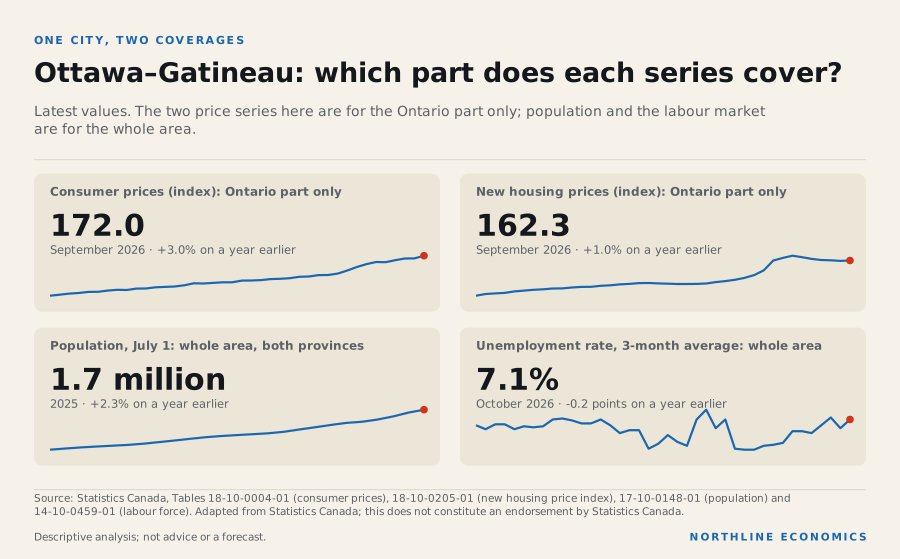
Ottawa–Gatineau is one metropolitan area on two sides of a provincial boundary. For consumer prices Statistics Canada publishes the Ontario part only. For the new housing price index it publishes the Ontario part and the Quebec part separately. Neither covers the whole area. Northline therefore labels its Ottawa price series “Ontario part” and never presents it as the whole metropolitan area. The population estimate and the labour force survey, by contrast, cover the whole area.
The result is that four series with “Ottawa–Gatineau” in the title describe two different coverages, as the board above shows. Setting the Ontario-part price index beside whole-area population growth would imply a link between populations and prices of a single geography that the data do not describe. The same issue arises for any city on a provincial or international boundary.
Case three: when is a year?
The data behind this graphic
| Step | What happens |
|---|---|
| A July 1 snapshot | The estimate of how many people live in the area on July 1. Annual, for census metropolitan areas. |
| Twelve months from July 1 | Births, deaths and moves counted from July 1 of one year to June 30 of the next. |
| A quarter | Provinces are estimated every quarter, so a provincial ‘latest’ is later than a city’s. |
| A census | A count every five years, from which estimates are adjusted. Boundaries are fixed to the census year. |
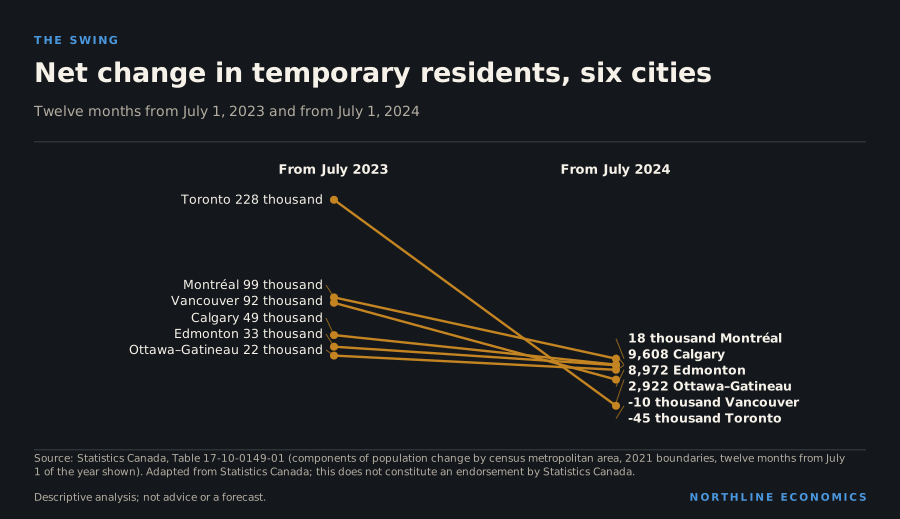
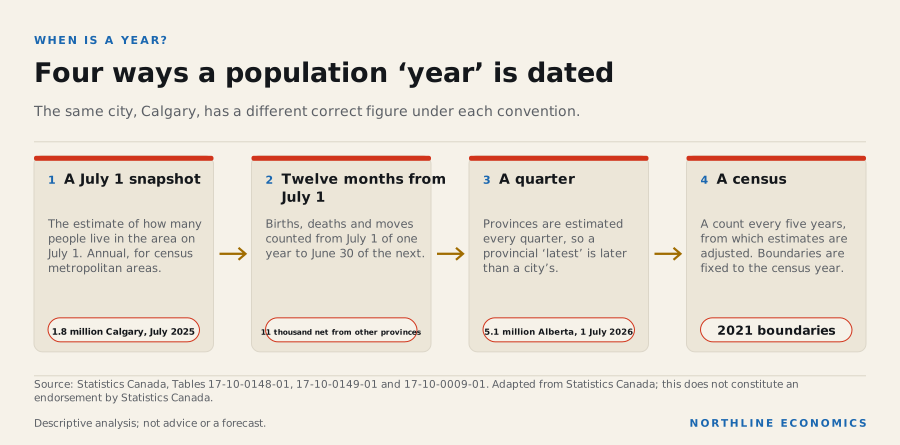
Population is the clearest example of dates mattering. A metropolitan population estimate is a July 1 snapshot, so Calgary’s latest figure, 1.8 million, is for July 2025. The components of change, such as births, immigrants and net moves from other provinces, are counted for the twelve months from July 1, so the figure labelled 2024 in the library, 11 thousand net moves from other provinces for Calgary, covers July 2024 to June 2025. Provinces are estimated every quarter: Alberta’s latest is for 1 July 2026, a year later than Calgary’s.
The data behind this graphic
| Item | Value |
|---|---|
| Edmonton, to July 2025 | 3.1% |
| Calgary, to July 2025 | 2.9% |
| Alberta, to 1 July 2026 | 1.5% |
| Ontario, to 1 July 2026 | 0.3% |
| Toronto, to July 2025 | 0.0% |
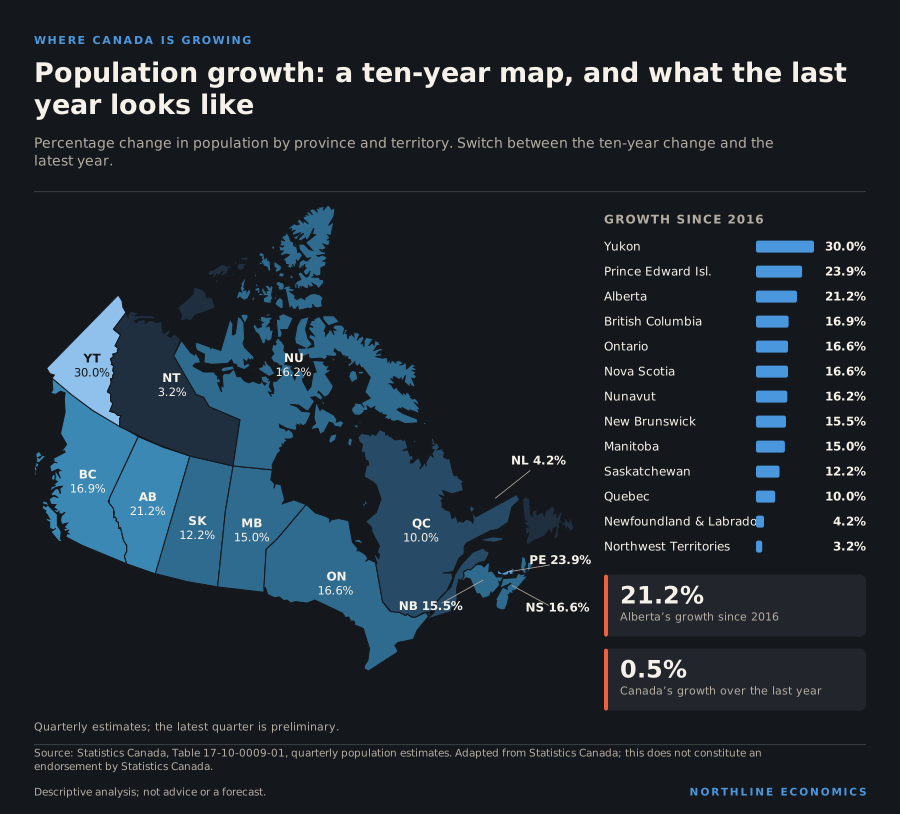
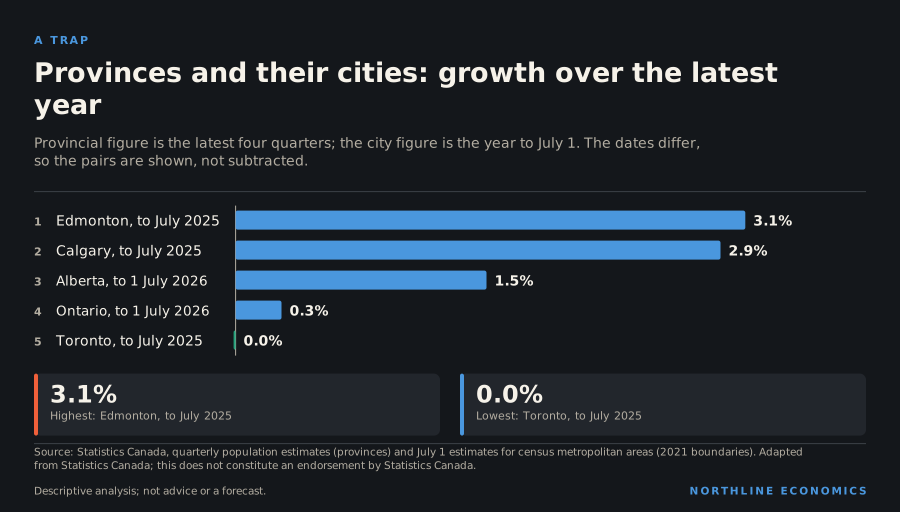
This matters for comparison. Alberta’s population grew 1.5% over the four quarters to 1 July 2026. Calgary’s grew 2.9% in the year to July 2025. It would be easy to say Calgary outgrew the province, or the reverse. But the two figures cover different years, and in a period when growth is changing quickly, a year’s difference can change the answer. The other pairs in the chart, Ontario and Toronto and Alberta and Edmonton, carry the same caution.
Boundaries are another date: metropolitan figures are on 2021 census boundaries, so a city whose limits changed would be restated. A chart of an area’s history is only reliable on one set of boundaries.
Case four: units described twice
For some tables Statistics Canada’s metadata give both a scale factor and a unit of measure that say the same thing, for example “persons in thousands”. Applying both multiplies by a million instead of a thousand. Northline reconciles the two and blocks implausible magnitudes. It is a technical point, but one that illustrates the broader principle: an agency’s numbers carry conventions that a reader cannot see in the figure.
Why this matters for decisions
For businesses that benchmark a local market against a provincial or national figure, the comparison is safest on the same table and release. A city unemployment rate set beside a national one should be read for direction.
For planners and analysts, the fix is not complicated but needs to be stated: say which part of an area a series covers, which dates it spans and how it is smoothed. Many apparent contradictions between two reports are differences of this kind.
For readers of the news, the most useful question about any “local” statistic is which geography and period it covers.
What Northline does about it
Comparisons are offered within one level and one table. City and provincial figures are not combined into a single series; where a chart sets them side by side, as the first chart in this note does to show the problem, each line is labelled with its own definition. Where a pair of figures cannot be made comparable, the figures are shown with their dates and not subtracted, as above.
What this does not show
This note describes Northline’s reading of Statistics Canada’s published metadata and tables, not a statement of agency policy. It does not list every definitional difference in the agency’s tables. The examples use particular months and releases; they are chosen to illustrate the point, and a different month would show different gaps.
Where to read next
Ten provincial labour markets compares provinces with each other on one table. Two Canadas in one year compares six cities on one table and one date convention.
Method
Findings come from reading the Statistics Canada Web Data Service metadata and tables while building Northline’s data library. Source: Adapted from Statistics Canada. This does not constitute an endorsement by Statistics Canada.
Keep exploring
- Compare these places
- /methodology/
- Ten provincial labour markets: who is tight, who is slack, and what the rate hides
- Two Canadas in the year to July 2025: Edmonton and Calgary grew fast while Toronto’s population stood still
Related research
Sources, method and limits
- Limitations
- Describes Northline’s reading of the agency’s metadata; not a statement of agency policy.
- Preparation
- Prepared by the Northline research desk with AI assistance; every figure is read from the data library or a cited source at build time.
Data
- Labour force characteristics, monthly, seasonally adjusted and trend-cycle (14-10-0287-01; 2 series; latest October 2026; retrieved 2026-11-07). Adapted from Statistics Canada, Labour force characteristics, monthly, seasonally adjusted and trend-cycle, Table 14-10-0287-01. This does not constitute an endorsement by Statistics Canada.
- Labour force characteristics by census metropolitan area, three-month moving average, seasonally adjusted (14-10-0459-01; 1 series; latest October 2026; retrieved 2026-11-07). Adapted from Statistics Canada, Labour force characteristics by census metropolitan area, three-month moving average, seasonally adjusted, Table 14-10-0459-01. This does not constitute an endorsement by Statistics Canada.
- Population estimates, July 1, by census metropolitan area and census agglomeration, 2021 boundaries (17-10-0148-01; 2 series; latest 2025; retrieved 2026-10-23). Adapted from Statistics Canada, Population estimates, July 1, by census metropolitan area and census agglomeration, 2021 boundaries, Table 17-10-0148-01. This does not constitute an endorsement by Statistics Canada.
- Components of population change by census metropolitan area and census agglomeration, 2021 boundaries (17-10-0149-01; 1 series; latest 2024; retrieved 2026-10-25). Adapted from Statistics Canada, Components of population change by census metropolitan area and census agglomeration, 2021 boundaries, Table 17-10-0149-01. This does not constitute an endorsement by Statistics Canada.
- Population estimates, quarterly (17-10-0009-01; 1 series; latest 1 July 2026; retrieved 2026-10-23). Adapted from Statistics Canada, Population estimates, quarterly, Table 17-10-0009-01. This does not constitute an endorsement by Statistics Canada.
Documents
- Statistics Canada: Labour Force Survey, September 2026, Table 8: labour force characteristics by Montréal, Toronto and Vancouver census metropolitan areas, monthly, seasonally adjusted (retrieved 2026-10-25)
- Statistics Canada Web Data Service user guide (retrieved 2026-10-23)
- Statistics Canada, Table 14-10-0459-01, Labour force characteristics by census metropolitan area, three-month moving average, seasonally adjusted (retrieved 2026-10-23)
- Statistics Canada, Table 14-10-0287-01, Labour force characteristics, monthly, seasonally adjusted (retrieved 2026-10-23)
Approved by an editor on 2026-11-09; published 2026-11-09. See the corrections log.